Michiana Shores Airbnb Market Analysis 2026: Short Term Rental Data & Vacation Rental Statistics in Indiana, United States
Is Airbnb profitable in Michiana Shores in 2026? Explore comprehensive Airbnb analytics for Michiana Shores, Indiana, United States to uncover income potential. This 2026 STR market report for Michiana Shores, based on AirROI data from February 2025 to January 2026, reveals key trends in the niche market of 25 active listings.
Whether you're considering an Airbnb investment in Michiana Shores, optimizing your existing vacation rental, or exploring rental arbitrage opportunities, understanding the Michiana Shores Airbnb data is crucial. Leveraging the low regulation environment is key to maximizing your short term rental income potential. Let's dive into the specifics.
Key Michiana Shores Airbnb Performance Metrics Overview
Monthly Airbnb Revenue Variations & Income Potential in Michiana Shores (2026)
Understanding the monthly revenue variations for Airbnb listings in Michiana Shores is key to maximizing your short term rental income potential. Seasonality significantly impacts earnings. Our analysis, based on data from the past 12 months, shows that the peak revenue month for STRs in Michiana Shores is typically July, while February often presents the lowest earnings, highlighting opportunities for strategic pricing adjustments during shoulder and low seasons. Explore the typical Airbnb income in Michiana Shores across different performance tiers:
- Best-in-class properties (Top 10%) achieve $8,440+ monthly, often utilizing dynamic pricing and superior guest experiences.
- Strong performing properties (Top 25%) earn $5,486 or more, indicating effective management and desirable locations/amenities.
- Typical properties (Median) generate around $3,543 per month, representing the average market performance.
- Entry-level properties (Bottom 25%) see earnings around $2,260, often with potential for optimization.
Average Monthly Airbnb Earnings Trend in Michiana Shores
Michiana Shores Airbnb Occupancy Rate Trends (2026)
Maximize your bookings by understanding the Michiana Shores STR occupancy trends. Seasonal demand shifts significantly influence how often properties are booked. Typically, Julysees the highest demand (peak season occupancy), while January experiences the lowest (low season). Effective strategies, like adjusting minimum stays or offering promotions, can boost occupancy during slower periods. Here's how different property tiers perform in Michiana Shores:
- Best-in-class properties (Top 10%) achieve 63%+ occupancy, indicating high desirability and potentially optimized availability.
- Strong performing properties (Top 25%) maintain 50% or higher occupancy, suggesting good market fit and guest satisfaction.
- Typical properties (Median) have an occupancy rate around 34%.
- Entry-level properties (Bottom 25%) average 21% occupancy, potentially facing higher vacancy.
Average Monthly Occupancy Rate Trend in Michiana Shores
Average Daily Rate (ADR) Airbnb Trends in Michiana Shores (2026)
Effective short term rental pricing strategy in Michiana Shores involves understanding monthly ADR fluctuations. The Average Daily Rate (ADR) for Airbnb in Michiana Shores typically peaks in July and dips lowest during February. Leveraging Airbnb dynamic pricing tools or strategies based on this seasonality can significantly boost revenue. Here's a look at the typical nightly rates achieved:
- Best-in-class properties (Top 10%) command rates of $599+ per night, often due to premium features or locations.
- Strong performing properties (Top 25%) achieve nightly rates of $454 or more.
- Typical properties (Median) charge around $332 per night.
- Entry-level properties (Bottom 25%) earn around $247 per night.
Average Daily Rate (ADR) Trend by Month in Michiana Shores
Get Live Michiana Shores Market Intelligence 👇

Explore Real-time Analytics
Airbnb Seasonality Analysis & Trends in Michiana Shores (2026)
Peak Season (July, August, June)
- Revenue averages $9,578 per month
- Occupancy rates average 66.0%
- Daily rates average $464
Shoulder Season
- Revenue averages $3,209 per month
- Occupancy maintains around 29.9%
- Daily rates hold near $380
Low Season (January, February, March)
- Revenue drops to average $1,916 per month
- Occupancy decreases to average 21.4%
- Daily rates adjust to average $351
Seasonality Insights for Michiana Shores
- The Airbnb seasonality in Michiana Shores shows highly seasonal trends requiring careful strategy. While the sections above show seasonal averages, it's also insightful to look at the extremes:
- During the high season, the absolute peak month showcases Michiana Shores's highest earning potential, with monthly revenues capable of climbing to $12,250, occupancy reaching a high of 80.9%, and ADRs peaking at $479.
- Conversely, the slowest single month of the year, typically falling within the low season, marks the market's lowest point. In this month, revenue might dip to $1,769, occupancy could drop to 18.4%, and ADRs may adjust down to $335.
- Understanding both the seasonal averages and these monthly peaks and troughs in revenue, occupancy, and ADR is crucial for maximizing your Airbnb profit potential in Michiana Shores.
Seasonal Strategies for Maximizing Profit
- Peak Season: Maximize revenue through premium pricing and potentially longer minimum stays. Ensure high availability.
- Low Season: Offer competitive pricing, special promotions (e.g., extended stay discounts), and flexible cancellation policies. Target off-season travelers like remote workers or budget-conscious guests.
- Shoulder Seasons: Implement dynamic pricing that balances peak and low rates. Target weekend travelers or specific events. Offer slightly more flexible terms than peak season.
- Regularly analyze your own performance against these Michiana Shores seasonality benchmarks and adjust your pricing and availability strategy accordingly.
Best Areas for Airbnb Investment in Michiana Shores (2026)
Exploring the top neighborhoods for short-term rentals in Michiana Shores? This section highlights key areas, outlining why they are attractive for hosts and guests, along with notable local attractions. Consider these locations based on your target guest profile and investment strategy.
| Neighborhood / Area | Why Host Here? (Target Guests & Appeal) | Key Attractions & Landmarks |
|---|---|---|
| Lake Michigan Beach | A beautiful area along the shores of Lake Michigan, perfect for summer getaways. This beach attracts families and couples looking for a peaceful retreat with ample outdoor activities. | Lake Michigan, Town Park, Michiana Shores Beach, Outdoor sports facilities, Scenic walking trails, Local art galleries |
| Dune Acres | A picturesque community set against the backdrop of the Indiana Dunes National Park. Ideal for nature lovers and those seeking tranquility by the beach and dunes. | Indiana Dunes National Park, Lake View Beach, The Little Calumet River, Nature trails, Birdwatching spots, Historical landmarks |
| Chicagoland | Close to the vibrant city of Chicago, this area offers easy access for visitors looking for an urban experience, combined with a lakeside retreat. | Chicago skyline views, Local dining and shopping, Cultural events in Chicago, Water sports, Lake Michigan activities |
| Union Pier | A charming beach town with a cozy atmosphere, Union Pier offers a mix of beach relaxation and local culture, attracting guests year-round. | Local wineries, Beaches, Art galleries, Farmers markets, Community festivals, Historic sites |
| New Buffalo | A bustling harbor town with a beautiful beach and a vibrant downtown area, perfect for tourists looking for a blend of relaxation and entertainment. | New Buffalo Beach, Dining and shopping, Harbor activities, Local breweries, Community events, Golf courses |
| Three Oaks | A quaint village known for its arts, cuisine, and natural beauty, offering visitors a chance to experience local culture and outdoor adventures. | Weko Beach, Dune Dancer Trail, Local artisans, Festivals, Wine tastings, Historical buildings |
| Berrien Springs | Located near the St. Joseph River, Berrien Springs offers a quieter rural experience with plenty of outdoor activities and access to nearby attractions. | St. Joseph River, Orchards and farms, Nature preserves, Local parks, Community events, Historic sites |
| Saugatuck-Douglas | Famous for its artistic community and stunning beaches, this area attracts art lovers and beachgoers alike, providing a blend of culture and relaxation. | Oval Beach, Saugatuck Dune Rides, Art galleries, Local shops, Dining options, Events and festivals |
Understanding Airbnb License Requirements & STR Laws in Michiana Shores (2026)
While Michiana Shores, Indiana, United States currently shows low STR regulations, specific Airbnb license requirements might still exist or change. Always verify the latest short term rental regulations and Airbnb license requirements directly with local government authorities for Michiana Shores to ensure full compliance before hosting.
(Source: AirROI data, 2026, finding no licensed listings among those analyzed)
Top Performing Airbnb Properties in Michiana Shores (2026)
Benchmark your potential! Explore examples of top-performing Airbnb properties in Michiana Shoresbased on Trailing Twelve Month (TTM) revenue. Analyze their characteristics, revenue, occupancy rate, and ADR to understand what drives success in this market.
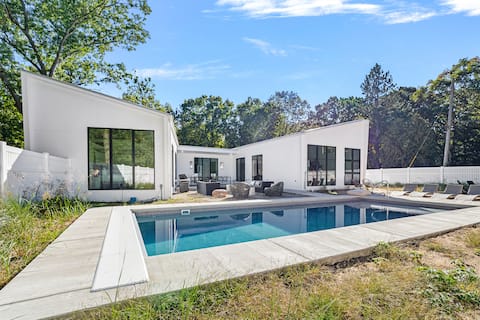
Fab Vacay Home, Pool, Walk to Lake Michigan Beach
Entire Place • 6 bedrooms
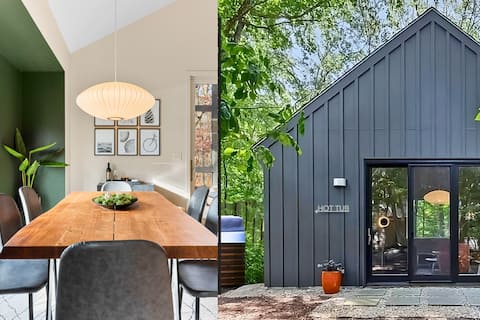
Beach! Hot Tub! New Buffalo! Firepit! King Bed!
Entire Place • 4 bedrooms
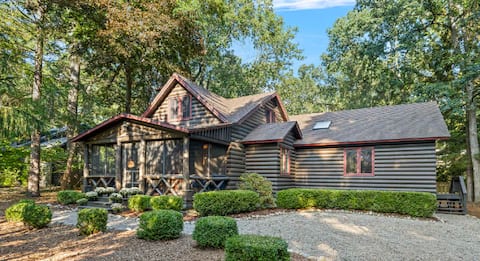
Pristine cabin with fireplace, sauna, cozy vibes
Entire Place • 3 bedrooms
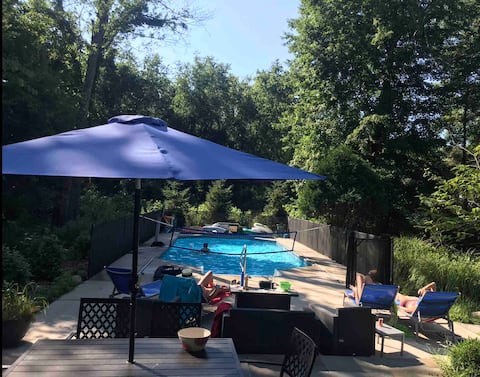
Splash (Pool! Hot Tub!) at Aqua House by the Lake
Entire Place • 3 bedrooms
A Wooded Retreat Michigan City
Entire Place • 3 bedrooms

2026 Dates Now Open @ The Birchwood Cottage!
Entire Place • 3 bedrooms
Note: Performance varies based on location, size, amenities, seasonality, and management quality. Data reflects the past 12 months.
Top Performing Airbnb Hosts in Michiana Shores (2026)
Learn from the best! This table showcases top-performing Airbnb hosts in Michiana Shores based on the number of properties managed and estimated total revenue over the past year. Analyze their scale and performance metrics.
| Host Name | Properties | Grossing Revenue | Stay Reviews | Avg Rating |
|---|---|---|---|---|
| Juniper | 2 | $196,939 | 58 | 4.89/5.0 |
| Alison | 1 | $128,442 | 136 | 4.98/5.0 |
| Kelly | 1 | $87,757 | 13 | 5.00/5.0 |
| Greg | 1 | $62,159 | 113 | 4.88/5.0 |
| Melanie | 1 | $58,656 | 15 | 4.93/5.0 |
| Peter & Eve | 1 | $58,259 | 184 | 4.96/5.0 |
| Meta Rose | 1 | $45,002 | 149 | 4.99/5.0 |
| Michael | 1 | $44,242 | 22 | 5.00/5.0 |
| Billy | 1 | $42,775 | 9 | 5.00/5.0 |
| Bluefish | 1 | $40,156 | 16 | 4.69/5.0 |
Analyzing the strategies of top hosts, such as their property selection, pricing, and guest communication, can offer valuable lessons for optimizing your own Airbnb operations in Michiana Shores.
Dive Deeper: Advanced Michiana Shores STR Market Data (2026)
Ready to unlock more insights? AirROI provides access to advanced metrics and comprehensive Airbnb data for Michiana Shores. Explore detailed analytics beyond this report to refine your investment strategy, optimize pricing, and maximize your vacation rental profits.
Explore Advanced MetricsMichiana Shores Short-Term Rental Market Composition (2026): Property & Room Types
Room Type Distribution
Property Type Distribution
Market Composition Insights for Michiana Shores
- The Michiana Shores Airbnb market composition is heavily skewed towards Entire Home/Apt listings, which make up 100% of the 25 active rentals. This indicates strong guest preference for privacy and space.
- Looking at the property type distribution in Michiana Shores, House properties are the most common (88%), reflecting the local real estate landscape.
- Houses represent a significant 88% portion, catering likely to families or larger groups.
Michiana Shores Airbnb Room Capacity Analysis (2026): Bedroom Distribution
Distribution of Listings by Number of Bedrooms
Room Capacity Insights for Michiana Shores
- The dominant room capacity in Michiana Shores is 3 bedrooms listings, making up 48% of the market. This suggests a strong demand for properties suitable for families or small groups.
- Together, 3 bedrooms and 2 bedrooms properties represent 80.0% of the active Airbnb listings in Michiana Shores, indicating a high concentration in these sizes.
- A significant 68.0% of listings offer 3+ bedrooms, catering to larger groups and families seeking more space in Michiana Shores.
Michiana Shores Vacation Rental Guest Capacity Trends (2026)
Distribution of Listings by Guest Capacity
Guest Capacity Insights for Michiana Shores
- The most common guest capacity trend in Michiana Shores vacation rentals is listings accommodating 8+ guests (48%). This suggests the primary traveler segment is likely larger groups.
- Properties designed for 8+ guests and 4 guests dominate the Michiana Shores STR market, accounting for 72.0% of listings.
- 72.0% of properties accommodate 6+ guests, serving the market segment for larger families or group travel in Michiana Shores.
- On average, properties in Michiana Shores are equipped to host 6.4 guests.
Michiana Shores Airbnb Booking Patterns (2026): Available vs. Booked Days
Available Days Distribution
Booked Days Distribution
Booking Pattern Insights for Michiana Shores
- The most common availability pattern in Michiana Shores falls within the 271-366 days range, representing 48% of listings. This suggests many properties have significant open periods on their calendars.
- Approximately 80.0% of listings show high availability (181+ days open annually), indicating potential for increased bookings or specific owner usage patterns.
- For booked days, the 91-180 days range is most frequent in Michiana Shores (40%), reflecting common guest stay durations or potential owner blocking patterns.
- A notable 20.0% of properties secure long booking periods (181+ days booked per year), highlighting successful long-term rental strategies or significant owner usage.
Michiana Shores Airbnb Minimum Stay Requirements Analysis
Distribution of Listings by Minimum Night Requirement
1 Night
1 listings
4% of total
2 Nights
11 listings
44% of total
3 Nights
1 listings
4% of total
4-6 Nights
2 listings
8% of total
7-29 Nights
1 listings
4% of total
30+ Nights
9 listings
36% of total
Key Insights
- The most prevalent minimum stay requirement in Michiana Shores is 2 Nights, adopted by 44% of listings. This highlights the market's preference for shorter, flexible bookings.
- A significant segment (36%) caters to monthly stays (30+ nights) in Michiana Shores, pointing to opportunities in the extended-stay market.
Recommendations
- Align with the market by considering a 2 Nights minimum stay, as 44% of Michiana Shores hosts use this setting.
- If feasible, allowing 1-night stays, especially midweek or during low season, could capture last-minute bookings, as only 4% currently do.
- A 2-night minimum appears standard (44%). Consider this for weekends or peak periods.
- Explore offering discounts for stays of 30+ nights to attract the 36% of the market seeking extended stays.
- Adjust minimum nights based on seasonality – potentially shorter during low season and longer during peak demand periods in Michiana Shores.
Michiana Shores Airbnb Cancellation Policy Trends Analysis (2026)
Limited
1 listings
4% of total
Super Strict 30 Days
1 listings
4% of total
Flexible
5 listings
20% of total
Moderate
4 listings
16% of total
Firm
12 listings
48% of total
Strict
2 listings
8% of total
Cancellation Policy Insights for Michiana Shores
- The prevailing Airbnb cancellation policy trend in Michiana Shores is Firm, used by 48% of listings.
- A majority (56.0%) of hosts in Michiana Shores utilize Firm or Strict policies, indicating a market where hosts prioritize booking security.
- Strict cancellation policies are quite rare (8%), potentially making listings with this policy less competitive unless justified by high demand or property type.
Recommendations for Hosts
- Consider adopting a Firm policy to align with the 48% market standard in Michiana Shores.
- Using a Strict policy might deter some guests, as only 8% of listings use it. Evaluate if potential revenue protection outweighs possible lower booking rates.
- Regularly review your cancellation policy against competitors and market demand shifts in Michiana Shores.
Michiana Shores STR Booking Lead Time Analysis (2026)
Average Booking Lead Time by Month
Booking Lead Time Insights for Michiana Shores
- The overall average booking lead time for vacation rentals in Michiana Shores is 56 days.
- Guests book furthest in advance for stays during July (average 102 days), likely coinciding with peak travel demand or local events.
- The shortest booking windows occur for stays in March (average 10 days), indicating more last-minute travel plans during this time.
- Seasonally, Summer (89 days avg.) sees the longest lead times, while Winter (31 days avg.) has the shortest, reflecting typical travel planning cycles.
Recommendations for Hosts
- Use the overall average lead time (56 days) as a baseline for your pricing and availability strategy in Michiana Shores.
- For July stays, consider implementing length-of-stay discounts or slightly higher rates for bookings made less than 102 days out to capitalize on advance planning.
- During March, focus on last-minute booking availability and promotions, as guests book with very short notice (10 days avg.).
- Target marketing efforts for the Summer season well in advance (at least 89 days) to capture early planners.
- Monitor your own booking lead times against these Michiana Shores averages to identify opportunities for dynamic pricing adjustments.
Popular & Essential Airbnb Amenities in Michiana Shores (2026)
Amenity Prevalence
No amenities with partial availability (less than 100%) were found to display in the chart. All essential amenities might be present in all listings. Check insights below.
Amenity Insights for Michiana Shores
- Essential amenities in Michiana Shores that guests expect include: Air conditioning, Wifi, Microwave, Heating, Smoke alarm, Refrigerator, TV, Dishes and silverware, Kitchen, Carbon monoxide alarm. Lacking these (any) could significantly impact bookings.
Recommendations for Hosts
- Ensure your listing includes all essential amenities for Michiana Shores: Air conditioning, Wifi, Microwave, Heating, Smoke alarm, Refrigerator, TV, Dishes and silverware, Kitchen, Carbon monoxide alarm.
- Highlight unique or less common amenities you offer (e.g., hot tub, dedicated workspace, EV charger) in your listing description and photos.
- Regularly check competitor amenities in Michiana Shores to stay competitive.
Michiana Shores Airbnb Guest Demographics & Profile Analysis (2026)
Guest Profile Summary for Michiana Shores
- The typical guest profile for Airbnb in Michiana Shores consists of primarily domestic travelers (99%), often arriving from nearby Chicago, typically belonging to the Post-2000s (Gen Z/Alpha) group (50%), primarily speaking English or Spanish.
- Domestic travelers account for 99.1% of guests.
- Key international markets include United States (99.1%) and United Kingdom (0.5%).
- Top languages spoken are English (71.4%) followed by Spanish (12.9%).
- A significant demographic segment is the Post-2000s (Gen Z/Alpha) group, representing 50% of guests.
Recommendations for Hosts
- Target domestic marketing efforts towards travelers from Chicago and Indianapolis.
- Tailor amenities and listing descriptions to appeal to the dominant Post-2000s (Gen Z/Alpha) demographic (e.g., highlight fast WiFi, smart home features, local guides).
- Highlight unique local experiences or amenities relevant to the primary guest profile.
- Consider seasonal promotions aligned with peak travel times for key origin markets.
Nearby Short-Term Rental Market Comparison
How does the Michiana Shores Airbnb market stack up against its neighbors? Compare key performance metrics like average monthly revenue, ADR, and occupancy rates in surrounding areas to understand the broader regional STR landscape.
| Market | Active Properties | Monthly Revenue | Daily Rate | Avg. Occupancy |
|---|---|---|---|---|
| Laketown Township | 59 | $6,112 | $529.59 | 44% |
| Port Sheldon Township | 26 | $6,015 | $566.98 | 47% |
| Ganges Township | 69 | $5,687 | $636.25 | 38% |
| Saugatuck Township | 141 | $5,627 | $508.58 | 43% |
| Paw Paw Township | 10 | $5,458 | $418.85 | 49% |
| New Buffalo Township | 260 | $5,145 | $633.18 | 36% |
| Bertrand Township | 22 | $5,011 | $365.69 | 40% |
| Union Pier | 16 | $4,998 | $659.10 | 36% |
| Fremont | 16 | $4,898 | $436.31 | 42% |
| Fennville | 34 | $4,874 | $542.47 | 42% |