Greenwood Airbnb Market Analysis 2026: Short Term Rental Data & Vacation Rental Statistics in Indiana, United States
Is Airbnb profitable in Greenwood in 2026? Explore comprehensive Airbnb analytics for Greenwood, Indiana, United States to uncover income potential. This 2026 STR market report for Greenwood, based on AirROI data from February 2025 to January 2026, reveals key trends in the niche market of 46 active listings.
Whether you're considering an Airbnb investment in Greenwood, optimizing your existing vacation rental, or exploring rental arbitrage opportunities, understanding the Greenwood Airbnb data is crucial. Leveraging the low regulation environment is key to maximizing your short term rental income potential. Let's dive into the specifics.
Key Greenwood Airbnb Performance Metrics Overview
Monthly Airbnb Revenue Variations & Income Potential in Greenwood (2026)
Understanding the monthly revenue variations for Airbnb listings in Greenwood is key to maximizing your short term rental income potential. Seasonality significantly impacts earnings. Our analysis, based on data from the past 12 months, shows that the peak revenue month for STRs in Greenwood is typically July, while February often presents the lowest earnings, highlighting opportunities for strategic pricing adjustments during shoulder and low seasons. Explore the typical Airbnb income in Greenwood across different performance tiers:
- Best-in-class properties (Top 10%) achieve $7,929+ monthly, often utilizing dynamic pricing and superior guest experiences.
- Strong performing properties (Top 25%) earn $5,326 or more, indicating effective management and desirable locations/amenities.
- Typical properties (Median) generate around $3,225 per month, representing the average market performance.
- Entry-level properties (Bottom 25%) see earnings around $1,592, often with potential for optimization.
Average Monthly Airbnb Earnings Trend in Greenwood
Greenwood Airbnb Occupancy Rate Trends (2026)
Maximize your bookings by understanding the Greenwood STR occupancy trends. Seasonal demand shifts significantly influence how often properties are booked. Typically, Julysees the highest demand (peak season occupancy), while November experiences the lowest (low season). Effective strategies, like adjusting minimum stays or offering promotions, can boost occupancy during slower periods. Here's how different property tiers perform in Greenwood:
- Best-in-class properties (Top 10%) achieve 84%+ occupancy, indicating high desirability and potentially optimized availability.
- Strong performing properties (Top 25%) maintain 71% or higher occupancy, suggesting good market fit and guest satisfaction.
- Typical properties (Median) have an occupancy rate around 53%.
- Entry-level properties (Bottom 25%) average 35% occupancy, potentially facing higher vacancy.
Average Monthly Occupancy Rate Trend in Greenwood
Average Daily Rate (ADR) Airbnb Trends in Greenwood (2026)
Effective short term rental pricing strategy in Greenwood involves understanding monthly ADR fluctuations. The Average Daily Rate (ADR) for Airbnb in Greenwood typically peaks in November and dips lowest during February. Leveraging Airbnb dynamic pricing tools or strategies based on this seasonality can significantly boost revenue. Here's a look at the typical nightly rates achieved:
- Best-in-class properties (Top 10%) command rates of $438+ per night, often due to premium features or locations.
- Strong performing properties (Top 25%) achieve nightly rates of $283 or more.
- Typical properties (Median) charge around $168 per night.
- Entry-level properties (Bottom 25%) earn around $97 per night.
Average Daily Rate (ADR) Trend by Month in Greenwood
Get Live Greenwood Market Intelligence 👇

Explore Real-time Analytics
Airbnb Seasonality Analysis & Trends in Greenwood (2026)
Peak Season (July, December, June)
- Revenue averages $5,305 per month
- Occupancy rates average 57.8%
- Daily rates average $242
Shoulder Season
- Revenue averages $3,787 per month
- Occupancy maintains around 50.4%
- Daily rates hold near $250
Low Season (January, February, March)
- Revenue drops to average $2,974 per month
- Occupancy decreases to average 48.9%
- Daily rates adjust to average $217
Seasonality Insights for Greenwood
- The Airbnb seasonality in Greenwood shows highly seasonal trends requiring careful strategy. While the sections above show seasonal averages, it's also insightful to look at the extremes:
- During the high season, the absolute peak month showcases Greenwood's highest earning potential, with monthly revenues capable of climbing to $5,589, occupancy reaching a high of 60.6%, and ADRs peaking at $304.
- Conversely, the slowest single month of the year, typically falling within the low season, marks the market's lowest point. In this month, revenue might dip to $2,484, occupancy could drop to 44.0%, and ADRs may adjust down to $187.
- Understanding both the seasonal averages and these monthly peaks and troughs in revenue, occupancy, and ADR is crucial for maximizing your Airbnb profit potential in Greenwood.
Seasonal Strategies for Maximizing Profit
- Peak Season: Maximize revenue through premium pricing and potentially longer minimum stays. Ensure high availability.
- Low Season: Offer competitive pricing, special promotions (e.g., extended stay discounts), and flexible cancellation policies. Target off-season travelers like remote workers or budget-conscious guests.
- Shoulder Seasons: Implement dynamic pricing that balances peak and low rates. Target weekend travelers or specific events. Offer slightly more flexible terms than peak season.
- Regularly analyze your own performance against these Greenwood seasonality benchmarks and adjust your pricing and availability strategy accordingly.
Best Areas for Airbnb Investment in Greenwood (2026)
Exploring the top neighborhoods for short-term rentals in Greenwood? This section highlights key areas, outlining why they are attractive for hosts and guests, along with notable local attractions. Consider these locations based on your target guest profile and investment strategy.
| Neighborhood / Area | Why Host Here? (Target Guests & Appeal) | Key Attractions & Landmarks |
|---|---|---|
| Downtown Greenwood | The city center is bustling with shops, restaurants, and entertainment options, making it popular for visitors seeking a vibrant urban experience. | Greenwood Park Mall, Old Town Greenwood, Freedom Springs Aquatic Park, Greenwood Community Center, Cranberry Lake Park |
| Southport | A suburban area close to Greenwood with a family-friendly atmosphere and local attractions, appealing for longer stays. | Southport Antique Mall, Garfield Park, Interactive exhibits at the Indiana State Museum, Southport Crossing Park |
| Greenwood’s Old Town | Charming historic area with boutique shops and eateries, drawing tourists looking for a quaint experience and local culture. | Old Town Greenwood Historic District, The Artcraft Theatre, Greenwood Farmers Market, Various local cafes and restaurants |
| Craig Park | A spacious park area perfect for family gatherings, drawing visitors who appreciate outdoor activities and community events. | Craig Park, Playgrounds, Walking trails, Picnic areas |
| Honey Creek | A quieter residential area with parks and family-friendly amenities, appealing for visitors wanting a suburban retreat. | Honey Creek Park, Quiet residential neighborhoods, Local eateries |
| Woodmen Park | Great for outdoor enthusiasts as it offers recreational activities and parks, attracting active travelers. | Woodmen Park, Playgrounds and picnic areas, Walking trails |
| Greenwood's Arts District | Emerging area known for local artisans and cultural events, appealing to tourists who appreciate arts and creativity. | Art galleries, Local artists studios, Cultural events, Craft fairs |
| Recent Developments | Newer housing and commercial developments attract young professionals and families, making it a hot spot for prospective Airbnb hosts. | Shopping centers, Dining options, Proximity to main highways, New parks and green spaces |
Understanding Airbnb License Requirements & STR Laws in Greenwood (2026)
While Greenwood, Indiana, United States currently shows low STR regulations, specific Airbnb license requirements might still exist or change. Always verify the latest short term rental regulations and Airbnb license requirements directly with local government authorities for Greenwood to ensure full compliance before hosting.
(Source: AirROI data, 2026, finding no licensed listings among those analyzed)
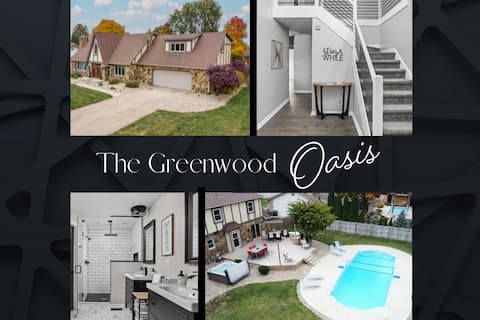
Top Performing Airbnb Properties in Greenwood (2026)
Benchmark your potential! Explore examples of top-performing Airbnb properties in Greenwoodbased on Trailing Twelve Month (TTM) revenue. Analyze their characteristics, revenue, occupancy rate, and ADR to understand what drives success in this market.

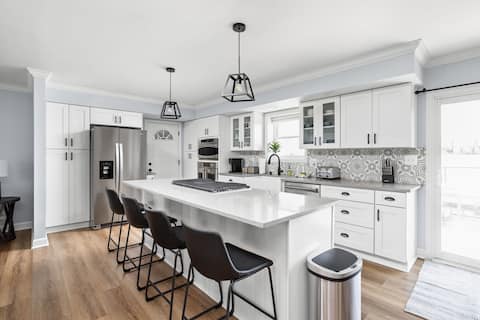
The Suburban Luxe
Entire Place • 5 bedrooms
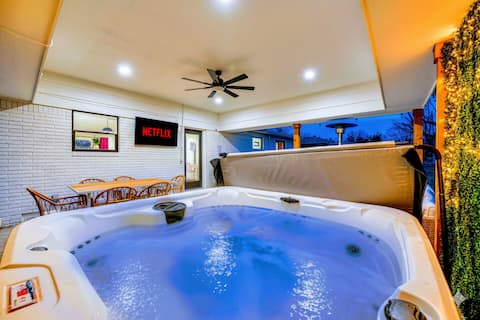
Luxe Winter Escapes: Hot tub w/ TV, Smores, Games
Entire Place • 4 bedrooms
Updated Home, Pool, Hot Tub, Game Room
Entire Place • 4 bedrooms
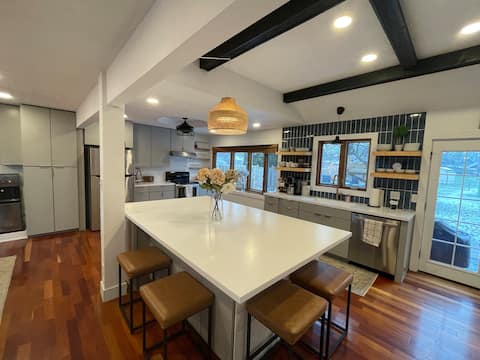
Spacious Game Room, 4BR/2.5BA, Pool, 7 Beds
Entire Place • 4 bedrooms
Charming updated family home with Treehouse deck
Entire Place • 4 bedrooms

Rustic Chic in Charming Center Grove w Fenced Yard
Entire Place • 4 bedrooms
Note: Performance varies based on location, size, amenities, seasonality, and management quality. Data reflects the past 12 months.
Top Performing Airbnb Hosts in Greenwood (2026)
Learn from the best! This table showcases top-performing Airbnb hosts in Greenwood based on the number of properties managed and estimated total revenue over the past year. Analyze their scale and performance metrics.
| Host Name | Properties | Grossing Revenue | Stay Reviews | Avg Rating |
|---|---|---|---|---|
| Afrina | 2 | $166,047 | 75 | 4.98/5.0 |
| Sarah | 1 | $148,707 | 19 | 5.00/5.0 |
| Rajsinh | 2 | $128,207 | 208 | 4.89/5.0 |
| David | 1 | $95,331 | 76 | 4.99/5.0 |
| Jason | 1 | $86,789 | 89 | 4.99/5.0 |
| Sarah | 1 | $74,646 | 72 | 5.00/5.0 |
| Home Base | 1 | $71,593 | 124 | 4.85/5.0 |
| Chad | 2 | $67,313 | 193 | 4.99/5.0 |
| Courtney | 1 | $62,486 | 139 | 4.85/5.0 |
| Patrick | 1 | $62,064 | 74 | 4.74/5.0 |
Analyzing the strategies of top hosts, such as their property selection, pricing, and guest communication, can offer valuable lessons for optimizing your own Airbnb operations in Greenwood.
Dive Deeper: Advanced Greenwood STR Market Data (2026)
Ready to unlock more insights? AirROI provides access to advanced metrics and comprehensive Airbnb data for Greenwood. Explore detailed analytics beyond this report to refine your investment strategy, optimize pricing, and maximize your vacation rental profits.
Explore Advanced MetricsGreenwood Short-Term Rental Market Composition (2026): Property & Room Types
Room Type Distribution
Property Type Distribution
Market Composition Insights for Greenwood
- The Greenwood Airbnb market composition is heavily skewed towards Entire Home/Apt listings, which make up 73.9% of the 46 active rentals. This indicates strong guest preference for privacy and space.
- Looking at the property type distribution in Greenwood, House properties are the most common (76.1%), reflecting the local real estate landscape.
- Houses represent a significant 76.1% portion, catering likely to families or larger groups.
- Smaller segments like unique stays, others, outdoor/unique (combined 10.8%) offer potential for unique stay experiences.
Greenwood Airbnb Room Capacity Analysis (2026): Bedroom Distribution
Distribution of Listings by Number of Bedrooms
Room Capacity Insights for Greenwood
- The dominant room capacity in Greenwood is 4 bedrooms listings, making up 21.7% of the market. This suggests a strong demand for properties suitable for families or small groups.
- Together, 4 bedrooms and 2 bedrooms properties represent 43.4% of the active Airbnb listings in Greenwood, indicating a high concentration in these sizes.
- A significant 43.4% of listings offer 3+ bedrooms, catering to larger groups and families seeking more space in Greenwood.
Greenwood Vacation Rental Guest Capacity Trends (2026)
Distribution of Listings by Guest Capacity
Guest Capacity Insights for Greenwood
- The most common guest capacity trend in Greenwood vacation rentals is listings accommodating 8+ guests (37%). This suggests the primary traveler segment is likely larger groups.
- Properties designed for 8+ guests and 6 guests dominate the Greenwood STR market, accounting for 54.4% of listings.
- 54.4% of properties accommodate 6+ guests, serving the market segment for larger families or group travel in Greenwood.
- On average, properties in Greenwood are equipped to host 4.9 guests.
Greenwood Airbnb Booking Patterns (2026): Available vs. Booked Days
Available Days Distribution
Booked Days Distribution
Booking Pattern Insights for Greenwood
- The most common availability pattern in Greenwood falls within the 181-270 days range, representing 34.8% of listings. This suggests many properties have significant open periods on their calendars.
- Approximately 67.4% of listings show high availability (181+ days open annually), indicating potential for increased bookings or specific owner usage patterns.
- For booked days, the 91-180 days range is most frequent in Greenwood (34.8%), reflecting common guest stay durations or potential owner blocking patterns.
- A notable 32.6% of properties secure long booking periods (181+ days booked per year), highlighting successful long-term rental strategies or significant owner usage.
Greenwood Airbnb Minimum Stay Requirements Analysis
Distribution of Listings by Minimum Night Requirement
1 Night
10 listings
21.7% of total
2 Nights
12 listings
26.1% of total
3 Nights
1 listings
2.2% of total
7-29 Nights
1 listings
2.2% of total
30+ Nights
22 listings
47.8% of total
Key Insights
- The most prevalent minimum stay requirement in Greenwood is 30+ Nights, adopted by 47.8% of listings. This highlights the market's preference for longer commitments.
- A significant segment (47.8%) caters to monthly stays (30+ nights) in Greenwood, pointing to opportunities in the extended-stay market.
Recommendations
- Align with the market by considering a 30+ Nights minimum stay, as 47.8% of Greenwood hosts use this setting.
- If feasible, allowing 1-night stays, especially midweek or during low season, could capture last-minute bookings, as only 21.7% currently do.
- Explore offering discounts for stays of 30+ nights to attract the 47.8% of the market seeking extended stays.
- Adjust minimum nights based on seasonality – potentially shorter during low season and longer during peak demand periods in Greenwood.
Greenwood Airbnb Cancellation Policy Trends Analysis (2026)
Limited
1 listings
2.2% of total
Flexible
12 listings
26.1% of total
Moderate
7 listings
15.2% of total
Firm
13 listings
28.3% of total
Strict
13 listings
28.3% of total
Cancellation Policy Insights for Greenwood
- The prevailing Airbnb cancellation policy trend in Greenwood is Firm, used by 28.3% of listings.
- A majority (56.6%) of hosts in Greenwood utilize Firm or Strict policies, indicating a market where hosts prioritize booking security.
Recommendations for Hosts
- Consider adopting a Firm policy to align with the 28.3% market standard in Greenwood.
- Regularly review your cancellation policy against competitors and market demand shifts in Greenwood.
Greenwood STR Booking Lead Time Analysis (2026)
Average Booking Lead Time by Month
Booking Lead Time Insights for Greenwood
- The overall average booking lead time for vacation rentals in Greenwood is 51 days.
- Guests book furthest in advance for stays during July (average 84 days), likely coinciding with peak travel demand or local events.
- The shortest booking windows occur for stays in February (average 19 days), indicating more last-minute travel plans during this time.
- Seasonally, Summer (69 days avg.) sees the longest lead times, while Winter (32 days avg.) has the shortest, reflecting typical travel planning cycles.
Recommendations for Hosts
- Use the overall average lead time (51 days) as a baseline for your pricing and availability strategy in Greenwood.
- For July stays, consider implementing length-of-stay discounts or slightly higher rates for bookings made less than 84 days out to capitalize on advance planning.
- Target marketing efforts for the Summer season well in advance (at least 69 days) to capture early planners.
- Monitor your own booking lead times against these Greenwood averages to identify opportunities for dynamic pricing adjustments.
Popular & Essential Airbnb Amenities in Greenwood (2026)
Amenity Prevalence
Amenity Insights for Greenwood
- Essential amenities in Greenwood that guests expect include: TV, Wifi, Smoke alarm, Air conditioning, Free parking on premises, Heating, Kitchen. Lacking these (any) could significantly impact bookings.
- Popular amenities like Hot water, Cooking basics, Dishes and silverware are common but not universal. Offering these can provide a competitive edge.
Recommendations for Hosts
- Ensure your listing includes all essential amenities for Greenwood: TV, Wifi, Smoke alarm, Air conditioning, Free parking on premises, Heating, Kitchen.
- Prioritize adding missing essentials: Free parking on premises, Heating, Kitchen.
- Consider adding popular differentiators like Hot water or Cooking basics to increase appeal.
- Highlight unique or less common amenities you offer (e.g., hot tub, dedicated workspace, EV charger) in your listing description and photos.
- Regularly check competitor amenities in Greenwood to stay competitive.
Greenwood Airbnb Guest Demographics & Profile Analysis (2026)
Guest Profile Summary for Greenwood
- The typical guest profile for Airbnb in Greenwood consists of primarily domestic travelers (97%), often arriving from nearby Indianapolis, typically belonging to the Post-2000s (Gen Z/Alpha) group (50%), primarily speaking English or Spanish.
- Domestic travelers account for 96.6% of guests.
- Key international markets include United States (96.6%) and Germany (0.8%).
- Top languages spoken are English (77.8%) followed by Spanish (8%).
- A significant demographic segment is the Post-2000s (Gen Z/Alpha) group, representing 50% of guests.
Recommendations for Hosts
- Target domestic marketing efforts towards travelers from Indianapolis and Fort Wayne.
- Tailor amenities and listing descriptions to appeal to the dominant Post-2000s (Gen Z/Alpha) demographic (e.g., highlight fast WiFi, smart home features, local guides).
- Highlight unique local experiences or amenities relevant to the primary guest profile.
- Consider seasonal promotions aligned with peak travel times for key origin markets.
Nearby Short-Term Rental Market Comparison
How does the Greenwood Airbnb market stack up against its neighbors? Compare key performance metrics like average monthly revenue, ADR, and occupancy rates in surrounding areas to understand the broader regional STR landscape.
| Market | Active Properties | Monthly Revenue | Daily Rate | Avg. Occupancy |
|---|---|---|---|---|
| Westfield | 131 | $3,724 | $338.42 | 44% |
| Unionville | 21 | $3,475 | $387.48 | 43% |
| Nashville | 250 | $3,428 | $294.88 | 41% |
| Shelbyville | 78 | $3,309 | $350.54 | 38% |
| Marshall | 12 | $3,135 | $264.69 | 39% |
| Simpsonville | 20 | $3,077 | $322.37 | 42% |
| Mount Washington | 14 | $2,898 | $229.72 | 43% |
| West Baden Springs | 18 | $2,892 | $363.80 | 29% |
| Louisville | 2,027 | $2,846 | $318.83 | 41% |
| La Grange | 29 | $2,826 | $327.31 | 35% |