Carmel Airbnb Market Analysis 2026: Short Term Rental Data & Vacation Rental Statistics in Indiana, United States
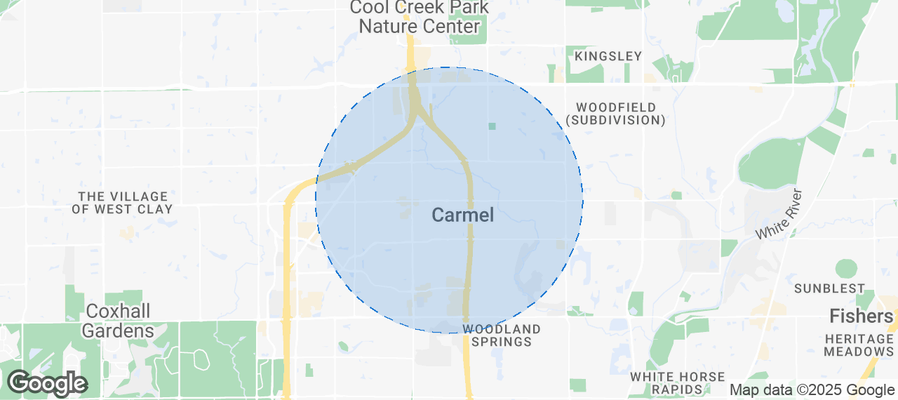
Is Airbnb profitable in Carmel in 2026? Explore comprehensive Airbnb analytics for Carmel, Indiana, United States to uncover income potential. This 2026 STR market report for Carmel, based on AirROI data from February 2025 to January 2026, reveals key trends in the niche market of 57 active listings.
Whether you're considering an Airbnb investment in Carmel, optimizing your existing vacation rental, or exploring rental arbitrage opportunities, understanding the Carmel Airbnb data is crucial. Leveraging the low regulation environment is key to maximizing your short term rental income potential. Let's dive into the specifics.
Key Carmel Airbnb Performance Metrics Overview
Monthly Airbnb Revenue Variations & Income Potential in Carmel (2026)
Understanding the monthly revenue variations for Airbnb listings in Carmel is key to maximizing your short term rental income potential. Seasonality significantly impacts earnings. Our analysis, based on data from the past 12 months, shows that the peak revenue month for STRs in Carmel is typically July, while January often presents the lowest earnings, highlighting opportunities for strategic pricing adjustments during shoulder and low seasons. Explore the typical Airbnb income in Carmel across different performance tiers:
- Best-in-class properties (Top 10%) achieve $8,917+ monthly, often utilizing dynamic pricing and superior guest experiences.
- Strong performing properties (Top 25%) earn $5,430 or more, indicating effective management and desirable locations/amenities.
- Typical properties (Median) generate around $2,966 per month, representing the average market performance.
- Entry-level properties (Bottom 25%) see earnings around $1,321, often with potential for optimization.
Average Monthly Airbnb Earnings Trend in Carmel
Carmel Airbnb Occupancy Rate Trends (2026)
Maximize your bookings by understanding the Carmel STR occupancy trends. Seasonal demand shifts significantly influence how often properties are booked. Typically, Julysees the highest demand (peak season occupancy), while January experiences the lowest (low season). Effective strategies, like adjusting minimum stays or offering promotions, can boost occupancy during slower periods. Here's how different property tiers perform in Carmel:
- Best-in-class properties (Top 10%) achieve 82%+ occupancy, indicating high desirability and potentially optimized availability.
- Strong performing properties (Top 25%) maintain 67% or higher occupancy, suggesting good market fit and guest satisfaction.
- Typical properties (Median) have an occupancy rate around 45%.
- Entry-level properties (Bottom 25%) average 25% occupancy, potentially facing higher vacancy.
Average Monthly Occupancy Rate Trend in Carmel
Average Daily Rate (ADR) Airbnb Trends in Carmel (2026)
Effective short term rental pricing strategy in Carmel involves understanding monthly ADR fluctuations. The Average Daily Rate (ADR) for Airbnb in Carmel typically peaks in July and dips lowest during January. Leveraging Airbnb dynamic pricing tools or strategies based on this seasonality can significantly boost revenue. Here's a look at the typical nightly rates achieved:
- Best-in-class properties (Top 10%) command rates of $561+ per night, often due to premium features or locations.
- Strong performing properties (Top 25%) achieve nightly rates of $319 or more.
- Typical properties (Median) charge around $190 per night.
- Entry-level properties (Bottom 25%) earn around $111 per night.
Average Daily Rate (ADR) Trend by Month in Carmel
Get Live Carmel Market Intelligence 👇
Explore Real-time Analytics
Airbnb Seasonality Analysis & Trends in Carmel (2026)
Peak Season (July, June, August)
- Revenue averages $5,786 per month
- Occupancy rates average 57.3%
- Daily rates average $282
Shoulder Season
- Revenue averages $4,086 per month
- Occupancy maintains around 48.1%
- Daily rates hold near $273
Low Season (January, February, November)
- Revenue drops to average $2,543 per month
- Occupancy decreases to average 34.4%
- Daily rates adjust to average $262
Seasonality Insights for Carmel
- The Airbnb seasonality in Carmel shows highly seasonal trends requiring careful strategy. While the sections above show seasonal averages, it's also insightful to look at the extremes:
- During the high season, the absolute peak month showcases Carmel's highest earning potential, with monthly revenues capable of climbing to $6,362, occupancy reaching a high of 60.7%, and ADRs peaking at $287.
- Conversely, the slowest single month of the year, typically falling within the low season, marks the market's lowest point. In this month, revenue might dip to $1,859, occupancy could drop to 29.9%, and ADRs may adjust down to $254.
- Understanding both the seasonal averages and these monthly peaks and troughs in revenue, occupancy, and ADR is crucial for maximizing your Airbnb profit potential in Carmel.
Seasonal Strategies for Maximizing Profit
- Peak Season: Maximize revenue through premium pricing and potentially longer minimum stays. Ensure high availability.
- Low Season: Offer competitive pricing, special promotions (e.g., extended stay discounts), and flexible cancellation policies. Target off-season travelers like remote workers or budget-conscious guests.
- Shoulder Seasons: Implement dynamic pricing that balances peak and low rates. Target weekend travelers or specific events. Offer slightly more flexible terms than peak season.
- Regularly analyze your own performance against these Carmel seasonality benchmarks and adjust your pricing and availability strategy accordingly.
Best Areas for Airbnb Investment in Carmel (2026)
Exploring the top neighborhoods for short-term rentals in Carmel? This section highlights key areas, outlining why they are attractive for hosts and guests, along with notable local attractions. Consider these locations based on your target guest profile and investment strategy.
| Neighborhood / Area | Why Host Here? (Target Guests & Appeal) | Key Attractions & Landmarks |
|---|---|---|
| Downtown Carmel | The vibrant heart of Carmel, featuring a variety of shops, restaurants, and cultural attractions. This area appeals to tourists looking for a lively atmosphere and easy access to events and arts venues. | Carmel Arts and Design District, War Memorial Plaza, The Palladium, Carmel Farmers Market, The Carmel Cool Creek Park |
| Carmel City Center | A modern, mixed-use development that offers a blend of residential, commercial, and entertainment spaces. Ideal for guests seeking upscale dining and shopping in a pedestrian-friendly environment. | Carmel City Center, The District Theatre, The Center for the Performing Arts, Carmel Clay Public Library, Cosmic bowling at Pins Mechanical Co. |
| The Village of West Clay | A charming, picturesque neighborhood with New England-style homes and a strong sense of community. Perfect for families and visitors seeking a quieter, residential vibe with easy access to nearby parks. | West Clay Park, The Village Boardwalk, Golf Club of Indiana, Parks and Trails, Local Shops and Cafes |
| Art District | Known for its vibrant arts scene and cultural offerings, this area attracts artists, art lovers, and tourists who appreciate galleries and art-related events throughout the year. | Carmel Art Center, Art Galleries, Carmel International Arts Festival, Local Artists Studios, Outdoor Art Exhibitions |
| Market District | This area features a range of dining and shopping options, popular with both locals and visitors. It combines convenience and variety, making it appealing for those looking to explore local favorites. | Carmel Market District, Restaurants and Cafés, Local Breweries, Armstrong Park, Parks and Recreation Facilities |
| Keystone Parkway | A major transportation corridor that provides easy access to and from Carmel, making it attractive for business travelers and those attending events in the area. | Local Business Centers, Access to Major Highways, Parks in the Area, Dining Options Along Keystone, Family-Friendly Attractions |
| Carmel's Monon Trail | A popular stretch for biking and walking, this scenic trail attracts visitors who enjoy outdoor activities. Hosting Airbnb here allows guests to experience the active lifestyle Carmel promotes. | Monon Trail, Parks Along the Trail, Cafés and Restaurants Nearby, Cycling Events, Nature Walks |
| East Carmel | A growing residential area with newer developments and convenient access to schools and shopping. Ideal for families and business travelers seeking modern amenities and a suburban feel. | Community Parks, Shopping Centers, Local Schools, Family Activities, Easy Access to Downtown |
Understanding Airbnb License Requirements & STR Laws in Carmel (2026)
While Carmel, Indiana, United States currently shows low STR regulations, specific Airbnb license requirements might still exist or change. Always verify the latest short term rental regulations and Airbnb license requirements directly with local government authorities for Carmel to ensure full compliance before hosting.
(Source: AirROI data, 2026, finding no licensed listings among those analyzed)
Top Performing Airbnb Properties in Carmel (2026)
Benchmark your potential! Explore examples of top-performing Airbnb properties in Carmelbased on Trailing Twelve Month (TTM) revenue. Analyze their characteristics, revenue, occupancy rate, and ADR to understand what drives success in this market.
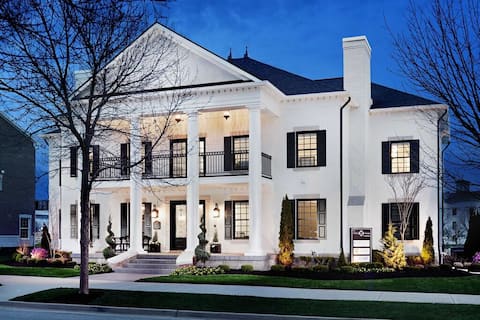
The WhiteHouse ! Your Private Oasis in Carmel
Entire Place • 3 bedrooms
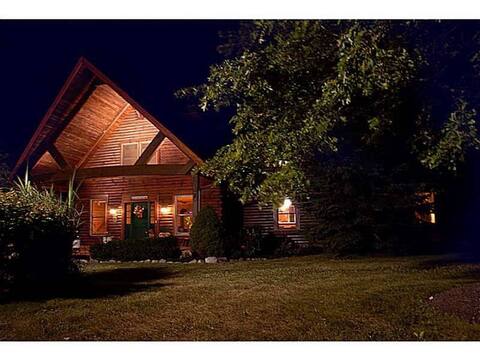
Timber West Lodge
Entire Place • 5 bedrooms
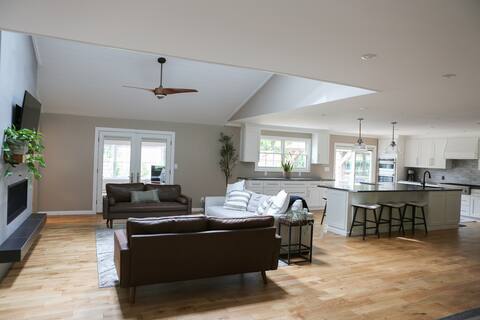
Indy Woodland House • 5min to d-town Carmel
Entire Place • 4 bedrooms

Sweet Valentine! | Carmel Townhome with garage!
Entire Place • 3 bedrooms

Townhome in Carmel
Entire Place • 3 bedrooms

Downtown Carmel Getaway
Entire Place • 2 bedrooms
Note: Performance varies based on location, size, amenities, seasonality, and management quality. Data reflects the past 12 months.
Top Performing Airbnb Hosts in Carmel (2026)
Learn from the best! This table showcases top-performing Airbnb hosts in Carmel based on the number of properties managed and estimated total revenue over the past year. Analyze their scale and performance metrics.
| Host Name | Properties | Grossing Revenue | Stay Reviews | Avg Rating |
|---|---|---|---|---|
| Pam & Vince | 7 | $202,970 | 973 | 4.96/5.0 |
| Zachary | 1 | $178,181 | 42 | 5.00/5.0 |
| Nathan | 2 | $145,600 | 245 | 4.92/5.0 |
| Lazy Sunday Rentals | 2 | $106,176 | 85 | 4.83/5.0 |
| Kristine | 1 | $102,293 | 86 | 5.00/5.0 |
| Mona | 2 | $85,088 | 148 | 4.84/5.0 |
| Kristin And Chase | 1 | $74,178 | 11 | 4.91/5.0 |
| Erin | 1 | $73,767 | 30 | 5.00/5.0 |
| Lauren | 1 | $73,161 | 51 | 5.00/5.0 |
| Michelle | 1 | $72,527 | 70 | 5.00/5.0 |
Analyzing the strategies of top hosts, such as their property selection, pricing, and guest communication, can offer valuable lessons for optimizing your own Airbnb operations in Carmel.
Dive Deeper: Advanced Carmel STR Market Data (2026)
Ready to unlock more insights? AirROI provides access to advanced metrics and comprehensive Airbnb data for Carmel. Explore detailed analytics beyond this report to refine your investment strategy, optimize pricing, and maximize your vacation rental profits.
Explore Advanced MetricsCarmel Short-Term Rental Market Composition (2026): Property & Room Types
Room Type Distribution
Property Type Distribution
Market Composition Insights for Carmel
- The Carmel Airbnb market composition is heavily skewed towards Entire Home/Apt listings, which make up 68.4% of the 57 active rentals. This indicates strong guest preference for privacy and space.
- However, a notable 31.6% share for Private Rooms suggests opportunities for budget-conscious travelers or hosts renting out spare rooms.
- Looking at the property type distribution in Carmel, House properties are the most common (70.2%), reflecting the local real estate landscape.
- Houses represent a significant 70.2% portion, catering likely to families or larger groups.
- Smaller segments like others, hotel/boutique (combined 5.3%) offer potential for unique stay experiences.
Carmel Airbnb Room Capacity Analysis (2026): Bedroom Distribution
Distribution of Listings by Number of Bedrooms
Room Capacity Insights for Carmel
- The dominant room capacity in Carmel is 3 bedrooms listings, making up 31.6% of the market. This suggests a strong demand for properties suitable for families or small groups.
- Together, 3 bedrooms and 2 bedrooms properties represent 47.4% of the active Airbnb listings in Carmel, indicating a high concentration in these sizes.
- A significant 49.1% of listings offer 3+ bedrooms, catering to larger groups and families seeking more space in Carmel.
Carmel Vacation Rental Guest Capacity Trends (2026)
Distribution of Listings by Guest Capacity
Guest Capacity Insights for Carmel
- The most common guest capacity trend in Carmel vacation rentals is listings accommodating 6 guests (26.3%). This suggests the primary traveler segment is likely larger groups.
- Properties designed for 6 guests and 8+ guests dominate the Carmel STR market, accounting for 45.6% of listings.
- 47.4% of properties accommodate 6+ guests, serving the market segment for larger families or group travel in Carmel.
- On average, properties in Carmel are equipped to host 4.2 guests.
Carmel Airbnb Booking Patterns (2026): Available vs. Booked Days
Available Days Distribution
Booked Days Distribution
Booking Pattern Insights for Carmel
- The most common availability pattern in Carmel falls within the 271-366 days range, representing 42.1% of listings. This suggests many properties have significant open periods on their calendars.
- Approximately 78.9% of listings show high availability (181+ days open annually), indicating potential for increased bookings or specific owner usage patterns.
- For booked days, the 91-180 days range is most frequent in Carmel (33.3%), reflecting common guest stay durations or potential owner blocking patterns.
- A notable 24.5% of properties secure long booking periods (181+ days booked per year), highlighting successful long-term rental strategies or significant owner usage.
Carmel Airbnb Minimum Stay Requirements Analysis
Distribution of Listings by Minimum Night Requirement
1 Night
9 listings
15.8% of total
2 Nights
18 listings
31.6% of total
4-6 Nights
3 listings
5.3% of total
7-29 Nights
4 listings
7% of total
30+ Nights
23 listings
40.4% of total
Key Insights
- The most prevalent minimum stay requirement in Carmel is 30+ Nights, adopted by 40.4% of listings. This highlights the market's preference for longer commitments.
- A significant segment (40.4%) caters to monthly stays (30+ nights) in Carmel, pointing to opportunities in the extended-stay market.
Recommendations
- Align with the market by considering a 30+ Nights minimum stay, as 40.4% of Carmel hosts use this setting.
- If feasible, allowing 1-night stays, especially midweek or during low season, could capture last-minute bookings, as only 15.8% currently do.
- A 2-night minimum appears standard (31.6%). Consider this for weekends or peak periods.
- Explore offering discounts for stays of 30+ nights to attract the 40.4% of the market seeking extended stays.
- Adjust minimum nights based on seasonality – potentially shorter during low season and longer during peak demand periods in Carmel.
Carmel Airbnb Cancellation Policy Trends Analysis (2026)
Limited
3 listings
5.3% of total
Super Strict 30 Days
1 listings
1.8% of total
Flexible
11 listings
19.3% of total
Moderate
17 listings
29.8% of total
Firm
16 listings
28.1% of total
Strict
9 listings
15.8% of total
Cancellation Policy Insights for Carmel
- The prevailing Airbnb cancellation policy trend in Carmel is Moderate, used by 29.8% of listings.
- There's a relatively balanced mix between guest-friendly (49.1%) and stricter (43.9%) policies, offering choices for different guest needs.
Recommendations for Hosts
- Consider adopting a Moderate policy to align with the 29.8% market standard in Carmel.
- Regularly review your cancellation policy against competitors and market demand shifts in Carmel.
Carmel STR Booking Lead Time Analysis (2026)
Average Booking Lead Time by Month
Booking Lead Time Insights for Carmel
- The overall average booking lead time for vacation rentals in Carmel is 56 days.
- Guests book furthest in advance for stays during May (average 89 days), likely coinciding with peak travel demand or local events.
- The shortest booking windows occur for stays in February (average 24 days), indicating more last-minute travel plans during this time.
- Seasonally, Summer (69 days avg.) sees the longest lead times, while Winter (34 days avg.) has the shortest, reflecting typical travel planning cycles.
Recommendations for Hosts
- Use the overall average lead time (56 days) as a baseline for your pricing and availability strategy in Carmel.
- For May stays, consider implementing length-of-stay discounts or slightly higher rates for bookings made less than 89 days out to capitalize on advance planning.
- Target marketing efforts for the Summer season well in advance (at least 69 days) to capture early planners.
- Monitor your own booking lead times against these Carmel averages to identify opportunities for dynamic pricing adjustments.
Popular & Essential Airbnb Amenities in Carmel (2026)
Amenity Prevalence
Amenity Insights for Carmel
- Essential amenities in Carmel that guests expect include: Wifi, Air conditioning, Heating, Bed linens. Lacking these (any) could significantly impact bookings.
- Popular amenities like TV, Smoke alarm, Microwave are common but not universal. Offering these can provide a competitive edge.
Recommendations for Hosts
- Ensure your listing includes all essential amenities for Carmel: Wifi, Air conditioning, Heating, Bed linens.
- Prioritize adding missing essentials: Heating, Bed linens.
- Consider adding popular differentiators like TV or Smoke alarm to increase appeal.
- Highlight unique or less common amenities you offer (e.g., hot tub, dedicated workspace, EV charger) in your listing description and photos.
- Regularly check competitor amenities in Carmel to stay competitive.
Carmel Airbnb Guest Demographics & Profile Analysis (2026)
Guest Profile Summary for Carmel
- The typical guest profile for Airbnb in Carmel consists of primarily domestic travelers (93%), often arriving from nearby Indianapolis, typically belonging to the Post-2000s (Gen Z/Alpha) group (50%), primarily speaking English or Spanish.
- Domestic travelers account for 93.3% of guests.
- Key international markets include United States (93.3%) and Canada (1.5%).
- Top languages spoken are English (72.9%) followed by Spanish (13.5%).
- A significant demographic segment is the Post-2000s (Gen Z/Alpha) group, representing 50% of guests.
Recommendations for Hosts
- Target domestic marketing efforts towards travelers from Indianapolis and Chicago.
- Tailor amenities and listing descriptions to appeal to the dominant Post-2000s (Gen Z/Alpha) demographic (e.g., highlight fast WiFi, smart home features, local guides).
- Highlight unique local experiences or amenities relevant to the primary guest profile.
- Consider seasonal promotions aligned with peak travel times for key origin markets.
Nearby Short-Term Rental Market Comparison
How does the Carmel Airbnb market stack up against its neighbors? Compare key performance metrics like average monthly revenue, ADR, and occupancy rates in surrounding areas to understand the broader regional STR landscape.
| Market | Active Properties | Monthly Revenue | Daily Rate | Avg. Occupancy |
|---|---|---|---|---|
| Westfield | 131 | $3,724 | $338.42 | 44% |
| Unionville | 21 | $3,475 | $387.47 | 43% |
| Nashville | 250 | $3,428 | $294.88 | 41% |
| Shelbyville | 78 | $3,309 | $350.54 | 38% |
| Marshall | 12 | $3,135 | $264.69 | 39% |
| Simpsonville | 20 | $3,077 | $322.37 | 42% |
| Mount Washington | 14 | $2,898 | $229.72 | 43% |
| West Baden Springs | 18 | $2,892 | $363.80 | 29% |
| Greenwood | 46 | $2,846 | $249.65 | 48% |
| Louisville | 2,027 | $2,846 | $318.83 | 41% |