Woodstock Airbnb Market Analysis 2026: Short Term Rental Data & Vacation Rental Statistics in Illinois, United States
Is Airbnb profitable in Woodstock in 2026? Explore comprehensive Airbnb analytics for Woodstock, Illinois, United States to uncover income potential. This 2026 STR market report for Woodstock, based on AirROI data from February 2025 to January 2026, reveals key trends in the niche market of 22 active listings.
Whether you're considering an Airbnb investment in Woodstock, optimizing your existing vacation rental, or exploring rental arbitrage opportunities, understanding the Woodstock Airbnb data is crucial. Leveraging the low regulation environment is key to maximizing your short term rental income potential. Let's dive into the specifics.
Key Woodstock Airbnb Performance Metrics Overview
Monthly Airbnb Revenue Variations & Income Potential in Woodstock (2026)
Understanding the monthly revenue variations for Airbnb listings in Woodstock is key to maximizing your short term rental income potential. Seasonality significantly impacts earnings. Our analysis, based on data from the past 12 months, shows that the peak revenue month for STRs in Woodstock is typically July, while January often presents the lowest earnings, highlighting opportunities for strategic pricing adjustments during shoulder and low seasons. Explore the typical Airbnb income in Woodstock across different performance tiers:
- Best-in-class properties (Top 10%) achieve $7,051+ monthly, often utilizing dynamic pricing and superior guest experiences.
- Strong performing properties (Top 25%) earn $4,393 or more, indicating effective management and desirable locations/amenities.
- Typical properties (Median) generate around $2,051 per month, representing the average market performance.
- Entry-level properties (Bottom 25%) see earnings around $1,154, often with potential for optimization.
Average Monthly Airbnb Earnings Trend in Woodstock
Woodstock Airbnb Occupancy Rate Trends (2026)
Maximize your bookings by understanding the Woodstock STR occupancy trends. Seasonal demand shifts significantly influence how often properties are booked. Typically, Julysees the highest demand (peak season occupancy), while January experiences the lowest (low season). Effective strategies, like adjusting minimum stays or offering promotions, can boost occupancy during slower periods. Here's how different property tiers perform in Woodstock:
- Best-in-class properties (Top 10%) achieve 77%+ occupancy, indicating high desirability and potentially optimized availability.
- Strong performing properties (Top 25%) maintain 56% or higher occupancy, suggesting good market fit and guest satisfaction.
- Typical properties (Median) have an occupancy rate around 26%.
- Entry-level properties (Bottom 25%) average 15% occupancy, potentially facing higher vacancy.
Average Monthly Occupancy Rate Trend in Woodstock
Average Daily Rate (ADR) Airbnb Trends in Woodstock (2026)
Effective short term rental pricing strategy in Woodstock involves understanding monthly ADR fluctuations. The Average Daily Rate (ADR) for Airbnb in Woodstock typically peaks in December and dips lowest during April. Leveraging Airbnb dynamic pricing tools or strategies based on this seasonality can significantly boost revenue. Here's a look at the typical nightly rates achieved:
- Best-in-class properties (Top 10%) command rates of $754+ per night, often due to premium features or locations.
- Strong performing properties (Top 25%) achieve nightly rates of $309 or more.
- Typical properties (Median) charge around $241 per night.
- Entry-level properties (Bottom 25%) earn around $213 per night.
Average Daily Rate (ADR) Trend by Month in Woodstock
Get Live Woodstock Market Intelligence 👇

Explore Real-time Analytics
Airbnb Seasonality Analysis & Trends in Woodstock (2026)
Peak Season (July, December, August)
- Revenue averages $4,410 per month
- Occupancy rates average 39.9%
- Daily rates average $351
Shoulder Season
- Revenue averages $3,112 per month
- Occupancy maintains around 35.5%
- Daily rates hold near $353
Low Season (January, March, April)
- Revenue drops to average $2,381 per month
- Occupancy decreases to average 31.3%
- Daily rates adjust to average $341
Seasonality Insights for Woodstock
- The Airbnb seasonality in Woodstock shows highly seasonal trends requiring careful strategy. While the sections above show seasonal averages, it's also insightful to look at the extremes:
- During the high season, the absolute peak month showcases Woodstock's highest earning potential, with monthly revenues capable of climbing to $4,484, occupancy reaching a high of 44.8%, and ADRs peaking at $405.
- Conversely, the slowest single month of the year, typically falling within the low season, marks the market's lowest point. In this month, revenue might dip to $2,056, occupancy could drop to 20.9%, and ADRs may adjust down to $314.
- Understanding both the seasonal averages and these monthly peaks and troughs in revenue, occupancy, and ADR is crucial for maximizing your Airbnb profit potential in Woodstock.
Seasonal Strategies for Maximizing Profit
- Peak Season: Maximize revenue through premium pricing and potentially longer minimum stays. Ensure high availability.
- Low Season: Offer competitive pricing, special promotions (e.g., extended stay discounts), and flexible cancellation policies. Target off-season travelers like remote workers or budget-conscious guests.
- Shoulder Seasons: Implement dynamic pricing that balances peak and low rates. Target weekend travelers or specific events. Offer slightly more flexible terms than peak season.
- Regularly analyze your own performance against these Woodstock seasonality benchmarks and adjust your pricing and availability strategy accordingly.
Best Areas for Airbnb Investment in Woodstock (2026)
Exploring the top neighborhoods for short-term rentals in Woodstock? This section highlights key areas, outlining why they are attractive for hosts and guests, along with notable local attractions. Consider these locations based on your target guest profile and investment strategy.
| Neighborhood / Area | Why Host Here? (Target Guests & Appeal) | Key Attractions & Landmarks |
|---|---|---|
| Downtown Woodstock | The historic center of Woodstock offers charming streets, a variety of shops, restaurants, and local events, making it a fantastic spot for visitors. | Woodstock Square, Old McHenry County Courthouse, Illinois Railway Museum, Woodstock Opera House, Civic Center of Woodstock |
| Lake Geneva | Just a short drive from Woodstock, Lake Geneva is a popular vacation destination known for its beautiful lake, outdoor activities, and vibrant town atmosphere. | Lake Geneva Waterfront, Geneva Lake Shore Path, Baker House, Lake Geneva Cruise Line, Yerkes Observatory |
| Bull Valley | This picturesque area is known for its scenic landscapes and luxurious homes, attracting visitors looking for peace and nature close to Woodstock. | Bull Valley Golf Club, Lakewood Road, Scenic bike routes, Culverts and Natural Reserves |
| Crystal Lake | Nearby Crystal Lake offers a mix of suburban charm and outdoor fun, making it appealing for families and outdoor enthusiasts visiting the area. | Crystal Lake Main Beach, Veterans Acres Park, The Crystal Lake Historical Society, Crystal Lake Plaza |
| McHenry | A growing city with a beautiful riverfront, McHenry offers ample recreational opportunities and attractions that appeal to families and nature lovers. | McHenry Riverwalk, McHenry Public Library, Pioneer Center for the Performing Arts, The Hollows Conservation Area |
| Woodstock Country Club | With its scenic views and proximity to golfing, this area appeals to visitors looking for leisure activities and relaxation in a natural setting. | Woodstock Country Club, Golf courses, Beautiful hiking trails |
| Marengo | Marengo is a small, charming town that offers a quiet escape with a friendly atmosphere, appealing to those looking for a slower pace during their stay. | Marengo Ridge Conservation Area, Marengo Union Township Park District, Local farmers market, Marengo Area Historical Society |
| Spring Grove | Known for its picturesque landscapes and proximity to nature trails, Spring Grove attracts visitors looking for outdoor activities and a tranquil getaway. | Chain O'Lakes State Park, Spring Grove Country Club, Local bike paths, Spring Grove Nature Reserve |
Understanding Airbnb License Requirements & STR Laws in Woodstock (2026)
While Woodstock, Illinois, United States currently shows low STR regulations, specific Airbnb license requirements might still exist or change. Always verify the latest short term rental regulations and Airbnb license requirements directly with local government authorities for Woodstock to ensure full compliance before hosting.
(Source: AirROI data, 2026, finding no licensed listings among those analyzed)
Top Performing Airbnb Properties in Woodstock (2026)
Benchmark your potential! Explore examples of top-performing Airbnb properties in Woodstockbased on Trailing Twelve Month (TTM) revenue. Analyze their characteristics, revenue, occupancy rate, and ADR to understand what drives success in this market.
The Matador - Home on Golf Course by CL/Woodstock
Entire Place • 5 bedrooms
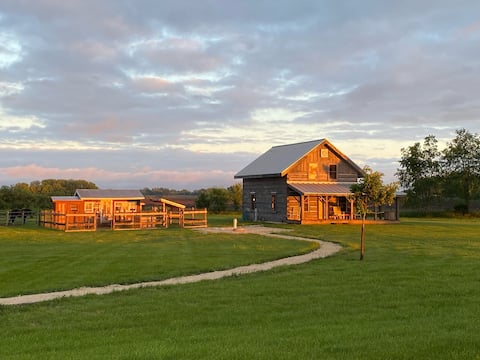
Cabin on the Prairie
Entire Place • 3 bedrooms

3 BR near DT Woodstock Square | Hot Tub & Arcades
Entire Place • 3 bedrooms

The Tailor House: 2BR w/ Hot Tub near Woodstock Sq
Entire Place • 2 bedrooms
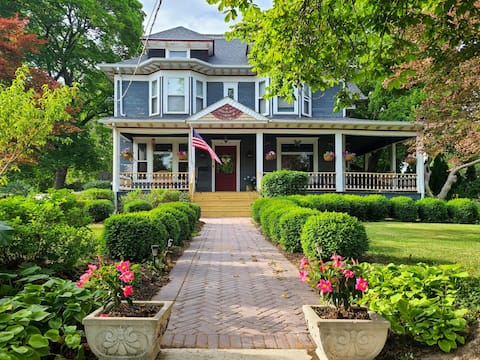
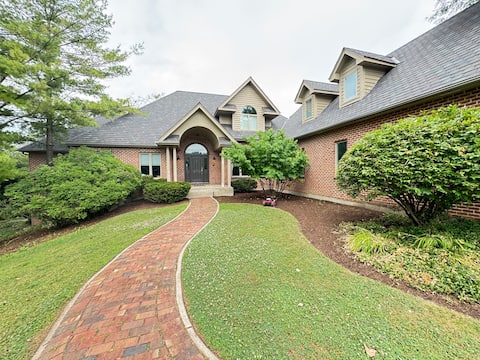
Grand 1800s Victorian Gem: Updated/by Downtown
Entire Place • 5 bedrooms

Whole House Rental - Bed & Breakfast
Private Room • 5 bedrooms
Note: Performance varies based on location, size, amenities, seasonality, and management quality. Data reflects the past 12 months.
Top Performing Airbnb Hosts in Woodstock (2026)
Learn from the best! This table showcases top-performing Airbnb hosts in Woodstock based on the number of properties managed and estimated total revenue over the past year. Analyze their scale and performance metrics.
| Host Name | Properties | Grossing Revenue | Stay Reviews | Avg Rating |
|---|---|---|---|---|
| Lori | 7 | $137,442 | 48 | 4.93/5.0 |
| Collin | 2 | $119,893 | 364 | 4.92/5.0 |
| Jordain | 1 | $108,657 | 6 | 4.83/5.0 |
| Linda | 1 | $95,574 | 18 | 5.00/5.0 |
| Craig | 3 | $72,201 | 111 | 4.98/5.0 |
| Deirdre | 1 | $51,601 | 84 | 4.88/5.0 |
| Peter | 1 | $40,025 | 293 | 4.85/5.0 |
| Susan | 1 | $32,366 | 215 | 4.96/5.0 |
| Calvin | 1 | $17,721 | 7 | 3.43/5.0 |
| Minerva | 1 | $13,647 | 16 | 4.38/5.0 |
Analyzing the strategies of top hosts, such as their property selection, pricing, and guest communication, can offer valuable lessons for optimizing your own Airbnb operations in Woodstock.
Dive Deeper: Advanced Woodstock STR Market Data (2026)
Ready to unlock more insights? AirROI provides access to advanced metrics and comprehensive Airbnb data for Woodstock. Explore detailed analytics beyond this report to refine your investment strategy, optimize pricing, and maximize your vacation rental profits.
Explore Advanced MetricsWoodstock Short-Term Rental Market Composition (2026): Property & Room Types
Room Type Distribution
Property Type Distribution
Market Composition Insights for Woodstock
- The Woodstock Airbnb market composition is heavily skewed towards Entire Home/Apt listings, which make up 54.5% of the 22 active rentals. This indicates strong guest preference for privacy and space.
- However, a notable 45.5% share for Private Rooms suggests opportunities for budget-conscious travelers or hosts renting out spare rooms.
- Looking at the property type distribution in Woodstock, House properties are the most common (50%), reflecting the local real estate landscape.
- Houses represent a significant 50% portion, catering likely to families or larger groups.
- The presence of 27.3% Hotel/Boutique listings indicates integration with traditional hospitality.
- Smaller segments like outdoor/unique, others (combined 9.0%) offer potential for unique stay experiences.
Woodstock Airbnb Room Capacity Analysis (2026): Bedroom Distribution
Distribution of Listings by Number of Bedrooms
Room Capacity Insights for Woodstock
- The dominant room capacity in Woodstock is 1 bedroom listings, making up 27.3% of the market. This suggests a strong demand for properties suitable for couples or solo travelers.
- Together, 1 bedroom and 2 bedrooms properties represent 45.5% of the active Airbnb listings in Woodstock, indicating a high concentration in these sizes.
- A significant 31.8% of listings offer 3+ bedrooms, catering to larger groups and families seeking more space in Woodstock.
Woodstock Vacation Rental Guest Capacity Trends (2026)
Distribution of Listings by Guest Capacity
Guest Capacity Insights for Woodstock
- The most common guest capacity trend in Woodstock vacation rentals is listings accommodating 8+ guests (22.7%). This suggests the primary traveler segment is likely larger groups.
- Properties designed for 8+ guests and 2 guests dominate the Woodstock STR market, accounting for 45.4% of listings.
- 36.3% of properties accommodate 6+ guests, serving the market segment for larger families or group travel in Woodstock.
- On average, properties in Woodstock are equipped to host 3.9 guests.
Woodstock Airbnb Booking Patterns (2026): Available vs. Booked Days
Available Days Distribution
Booked Days Distribution
Booking Pattern Insights for Woodstock
- The most common availability pattern in Woodstock falls within the 271-366 days range, representing 54.5% of listings. This suggests many properties have significant open periods on their calendars.
- Approximately 72.7% of listings show high availability (181+ days open annually), indicating potential for increased bookings or specific owner usage patterns.
- For booked days, the 31-90 days range is most frequent in Woodstock (50%), reflecting common guest stay durations or potential owner blocking patterns.
- A notable 27.2% of properties secure long booking periods (181+ days booked per year), highlighting successful long-term rental strategies or significant owner usage.
Woodstock Airbnb Minimum Stay Requirements Analysis
Distribution of Listings by Minimum Night Requirement
1 Night
15 listings
68.2% of total
2 Nights
3 listings
13.6% of total
4-6 Nights
1 listings
4.5% of total
30+ Nights
3 listings
13.6% of total
Key Insights
- The most prevalent minimum stay requirement in Woodstock is 1 Night, adopted by 68.2% of listings. This highlights the market's preference for shorter, flexible bookings.
- A strong majority (81.8%) of the Woodstock Airbnb data shows acceptance of very short stays (1-2 nights), indicating a dynamic, high-turnover market.
- A significant segment (13.6%) caters to monthly stays (30+ nights) in Woodstock, pointing to opportunities in the extended-stay market.
Recommendations
- Align with the market by considering a 1 Night minimum stay, as 68.2% of Woodstock hosts use this setting.
- Explore offering discounts for stays of 30+ nights to attract the 13.6% of the market seeking extended stays.
- Adjust minimum nights based on seasonality – potentially shorter during low season and longer during peak demand periods in Woodstock.
Woodstock Airbnb Cancellation Policy Trends Analysis (2026)
Limited
1 listings
4.5% of total
Flexible
6 listings
27.3% of total
Moderate
6 listings
27.3% of total
Firm
6 listings
27.3% of total
Strict
3 listings
13.6% of total
Cancellation Policy Insights for Woodstock
- The prevailing Airbnb cancellation policy trend in Woodstock is Flexible, used by 27.3% of listings.
- There's a relatively balanced mix between guest-friendly (54.6%) and stricter (40.9%) policies, offering choices for different guest needs.
Recommendations for Hosts
- Consider adopting a Flexible policy to align with the 27.3% market standard in Woodstock.
- Using a Strict policy might deter some guests, as only 13.6% of listings use it. Evaluate if potential revenue protection outweighs possible lower booking rates.
- Regularly review your cancellation policy against competitors and market demand shifts in Woodstock.
Woodstock STR Booking Lead Time Analysis (2026)
Average Booking Lead Time by Month
Booking Lead Time Insights for Woodstock
- The overall average booking lead time for vacation rentals in Woodstock is 75 days.
- Guests book furthest in advance for stays during January (average 113 days), likely coinciding with peak travel demand or local events.
- The shortest booking windows occur for stays in June (average 45 days), indicating more last-minute travel plans during this time.
- Seasonally, Winter (102 days avg.) sees the longest lead times, while Summer (59 days avg.) has the shortest, reflecting typical travel planning cycles.
Recommendations for Hosts
- Use the overall average lead time (75 days) as a baseline for your pricing and availability strategy in Woodstock.
- For January stays, consider implementing length-of-stay discounts or slightly higher rates for bookings made less than 113 days out to capitalize on advance planning.
- Target marketing efforts for the Winter season well in advance (at least 102 days) to capture early planners.
- Monitor your own booking lead times against these Woodstock averages to identify opportunities for dynamic pricing adjustments.
Popular & Essential Airbnb Amenities in Woodstock (2026)
Amenity Prevalence
Amenity Insights for Woodstock
- Essential amenities in Woodstock that guests expect include: Smoke alarm, Wifi, Heating, Air conditioning, TV, Carbon monoxide alarm, Hot water, Fire extinguisher, Coffee maker, Refrigerator. Lacking these (any) could significantly impact bookings.
Recommendations for Hosts
- Ensure your listing includes all essential amenities for Woodstock: Smoke alarm, Wifi, Heating, Air conditioning, TV, Carbon monoxide alarm, Hot water, Fire extinguisher, Coffee maker, Refrigerator.
- Prioritize adding missing essentials: Heating, Air conditioning, TV, Carbon monoxide alarm, Hot water, Fire extinguisher, Coffee maker, Refrigerator.
- Highlight unique or less common amenities you offer (e.g., hot tub, dedicated workspace, EV charger) in your listing description and photos.
- Regularly check competitor amenities in Woodstock to stay competitive.
Woodstock Airbnb Guest Demographics & Profile Analysis (2026)
Guest Profile Summary for Woodstock
- The typical guest profile for Airbnb in Woodstock consists of primarily domestic travelers (96%), often arriving from nearby Chicago, typically belonging to the Post-2000s (Gen Z/Alpha) group (50%), primarily speaking English or Spanish.
- Domestic travelers account for 95.5% of guests.
- Key international markets include United States (95.5%) and Australia (1.3%).
- Top languages spoken are English (76.2%) followed by Spanish (7.9%).
- A significant demographic segment is the Post-2000s (Gen Z/Alpha) group, representing 50% of guests.
Recommendations for Hosts
- Target domestic marketing efforts towards travelers from Chicago and Woodstock.
- Tailor amenities and listing descriptions to appeal to the dominant Post-2000s (Gen Z/Alpha) demographic (e.g., highlight fast WiFi, smart home features, local guides).
- Highlight unique local experiences or amenities relevant to the primary guest profile.
- Consider seasonal promotions aligned with peak travel times for key origin markets.
Nearby Short-Term Rental Market Comparison
How does the Woodstock Airbnb market stack up against its neighbors? Compare key performance metrics like average monthly revenue, ADR, and occupancy rates in surrounding areas to understand the broader regional STR landscape.
| Market | Active Properties | Monthly Revenue | Daily Rate | Avg. Occupancy |
|---|---|---|---|---|
| Town of Sugar Creek | 18 | $9,830 | $662.90 | 53% |
| Monona | 29 | $6,957 | $648.65 | 49% |
| Twin Lakes | 35 | $6,152 | $547.54 | 43% |
| Lake Geneva | 209 | $5,014 | $473.36 | 41% |
| Town of Geneva | 63 | $5,012 | $448.89 | 43% |
| McHenry | 32 | $4,982 | $463.12 | 44% |
| Town of Marion | 47 | $4,817 | $364.51 | 43% |
| Town of Greenfield | 14 | $4,740 | $355.57 | 42% |
| City of Pewaukee | 11 | $4,657 | $510.14 | 44% |
| Salem Lakes | 23 | $4,513 | $330.45 | 49% |