Waterloo Airbnb Market Analysis 2026: Short Term Rental Data & Vacation Rental Statistics in Illinois, United States
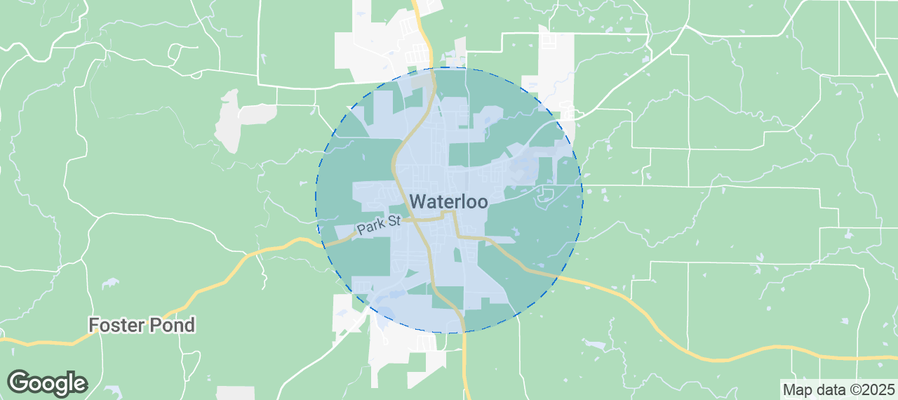
Is Airbnb profitable in Waterloo in 2026? Explore comprehensive Airbnb analytics for Waterloo, Illinois, United States to uncover income potential. This 2026 STR market report for Waterloo, based on AirROI data from February 2025 to January 2026, reveals key trends in the niche market of 20 active listings.
Whether you're considering an Airbnb investment in Waterloo, optimizing your existing vacation rental, or exploring rental arbitrage opportunities, understanding the Waterloo Airbnb data is crucial. Leveraging the low regulation environment is key to maximizing your short term rental income potential. Let's dive into the specifics.
Key Waterloo Airbnb Performance Metrics Overview
Monthly Airbnb Revenue Variations & Income Potential in Waterloo (2026)
Understanding the monthly revenue variations for Airbnb listings in Waterloo is key to maximizing your short term rental income potential. Seasonality significantly impacts earnings. Our analysis, based on data from the past 12 months, shows that the peak revenue month for STRs in Waterloo is typically July, while February often presents the lowest earnings, highlighting opportunities for strategic pricing adjustments during shoulder and low seasons. Explore the typical Airbnb income in Waterloo across different performance tiers:
- Best-in-class properties (Top 10%) achieve $4,024+ monthly, often utilizing dynamic pricing and superior guest experiences.
- Strong performing properties (Top 25%) earn $2,642 or more, indicating effective management and desirable locations/amenities.
- Typical properties (Median) generate around $1,498 per month, representing the average market performance.
- Entry-level properties (Bottom 25%) see earnings around $810, often with potential for optimization.
Average Monthly Airbnb Earnings Trend in Waterloo
Waterloo Airbnb Occupancy Rate Trends (2026)
Maximize your bookings by understanding the Waterloo STR occupancy trends. Seasonal demand shifts significantly influence how often properties are booked. Typically, Julysees the highest demand (peak season occupancy), while January experiences the lowest (low season). Effective strategies, like adjusting minimum stays or offering promotions, can boost occupancy during slower periods. Here's how different property tiers perform in Waterloo:
- Best-in-class properties (Top 10%) achieve 71%+ occupancy, indicating high desirability and potentially optimized availability.
- Strong performing properties (Top 25%) maintain 56% or higher occupancy, suggesting good market fit and guest satisfaction.
- Typical properties (Median) have an occupancy rate around 36%.
- Entry-level properties (Bottom 25%) average 23% occupancy, potentially facing higher vacancy.
Average Monthly Occupancy Rate Trend in Waterloo
Average Daily Rate (ADR) Airbnb Trends in Waterloo (2026)
Effective short term rental pricing strategy in Waterloo involves understanding monthly ADR fluctuations. The Average Daily Rate (ADR) for Airbnb in Waterloo typically peaks in December and dips lowest during March. Leveraging Airbnb dynamic pricing tools or strategies based on this seasonality can significantly boost revenue. Here's a look at the typical nightly rates achieved:
- Best-in-class properties (Top 10%) command rates of $258+ per night, often due to premium features or locations.
- Strong performing properties (Top 25%) achieve nightly rates of $196 or more.
- Typical properties (Median) charge around $137 per night.
- Entry-level properties (Bottom 25%) earn around $108 per night.
Average Daily Rate (ADR) Trend by Month in Waterloo
Get Live Waterloo Market Intelligence 👇
Explore Real-time Analytics
Airbnb Seasonality Analysis & Trends in Waterloo (2026)
Peak Season (July, June, August)
- Revenue averages $2,318 per month
- Occupancy rates average 47.3%
- Daily rates average $154
Shoulder Season
- Revenue averages $1,908 per month
- Occupancy maintains around 38.9%
- Daily rates hold near $157
Low Season (January, February, April)
- Revenue drops to average $1,439 per month
- Occupancy decreases to average 31.3%
- Daily rates adjust to average $153
Seasonality Insights for Waterloo
- The Airbnb seasonality in Waterloo shows moderate seasonality with distinct peak and low periods. While the sections above show seasonal averages, it's also insightful to look at the extremes:
- During the high season, the absolute peak month showcases Waterloo's highest earning potential, with monthly revenues capable of climbing to $2,472, occupancy reaching a high of 51.6%, and ADRs peaking at $172.
- Conversely, the slowest single month of the year, typically falling within the low season, marks the market's lowest point. In this month, revenue might dip to $1,202, occupancy could drop to 25.3%, and ADRs may adjust down to $143.
- Understanding both the seasonal averages and these monthly peaks and troughs in revenue, occupancy, and ADR is crucial for maximizing your Airbnb profit potential in Waterloo.
Seasonal Strategies for Maximizing Profit
- Peak Season: Maximize revenue through premium pricing and potentially longer minimum stays. Ensure high availability.
- Low Season: Offer competitive pricing, special promotions (e.g., extended stay discounts), and flexible cancellation policies. Target off-season travelers like remote workers or budget-conscious guests.
- Shoulder Seasons: Implement dynamic pricing that balances peak and low rates. Target weekend travelers or specific events. Offer slightly more flexible terms than peak season.
- Regularly analyze your own performance against these Waterloo seasonality benchmarks and adjust your pricing and availability strategy accordingly.
Best Areas for Airbnb Investment in Waterloo (2026)
Exploring the top neighborhoods for short-term rentals in Waterloo? This section highlights key areas, outlining why they are attractive for hosts and guests, along with notable local attractions. Consider these locations based on your target guest profile and investment strategy.
| Neighborhood / Area | Why Host Here? (Target Guests & Appeal) | Key Attractions & Landmarks |
|---|---|---|
| Downtown Waterloo | The heart of the city with shopping, dining, and entertainment options. Popular for both business travelers and tourists visiting local attractions. | Waterloo Historical Society, Waterloo Cinema, Public Square, Waterloo Parks, local shops and cafes |
| Fairfield Inn & Suites Area | Close to I-55, this area attracts visitors looking for convenient and comfortable accommodation options for family visits and events. | Fairfield Inn, shopping centers, restaurants, nearby parks, easy highway access |
| Waterloo Community Park | A large park that offers recreational opportunities and is close to residential neighborhoods, making it appealing for families and outdoor enthusiasts. | Community Pool, playground, sports fields, walking trails, picnic areas |
| Waterloo's Historic District | Charming area with historic homes and a quaint atmosphere that appeals to those interested in local history and architecture. | Historic Homes Tour, local museums, quaint shops, culinary experiences |
| Columbia, IL (nearby) | A short drive from Waterloo, Columbia offers additional lodging options and local attractions, drawing in visitors who want a quieter stay. | Columbia Bottom Conservation Area, local wineries, parks, shopping centers |
| Wine Country Ridge | This area is known for its vineyards and wineries, making it a popular choice for wine enthusiasts and those looking for a unique getaway experience. | local wineries, wine tours, scenic views, tasting events, vineyard dining |
| Lakeview Area | A peaceful area with beautiful lakes and outdoor recreation, attracting visitors looking for a relaxing stay in nature. | Lakeview Park, fishing, boating, nature trails |
| Civic Center Area | Home to various civic events and community activities, providing both convenience and accessibility for guests attending local events or conferences. | Civic Center events, local fairs, community activities, centralized location |
Understanding Airbnb License Requirements & STR Laws in Waterloo (2026)
While Waterloo, Illinois, United States currently shows low STR regulations, specific Airbnb license requirements might still exist or change. Always verify the latest short term rental regulations and Airbnb license requirements directly with local government authorities for Waterloo to ensure full compliance before hosting.
(Source: AirROI data, 2026, finding no licensed listings among those analyzed)
Top Performing Airbnb Properties in Waterloo (2026)
Benchmark your potential! Explore examples of top-performing Airbnb properties in Waterloobased on Trailing Twelve Month (TTM) revenue. Analyze their characteristics, revenue, occupancy rate, and ADR to understand what drives success in this market.

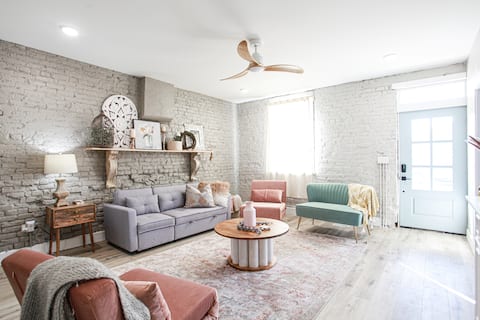
Spotless Downtown Loft w/ Games & Glam Room
Entire Place • 2 bedrooms

3 bedrooms with hot tub, fireplace. Walk to town.
Entire Place • 3 bedrooms

Doc's Farmhouse, Historic Home (built in 1844)
Entire Place • 4 bedrooms
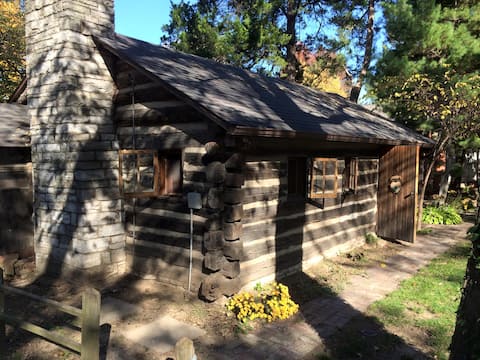
Cozy 1953 Countryside Log Cabin Minutes to STL
Entire Place • N/A

Haus on Main
Entire Place • 3 bedrooms
Little Honey Cottage
Entire Place • 2 bedrooms
Note: Performance varies based on location, size, amenities, seasonality, and management quality. Data reflects the past 12 months.
Top Performing Airbnb Hosts in Waterloo (2026)
Learn from the best! This table showcases top-performing Airbnb hosts in Waterloo based on the number of properties managed and estimated total revenue over the past year. Analyze their scale and performance metrics.
| Host Name | Properties | Grossing Revenue | Stay Reviews | Avg Rating |
|---|---|---|---|---|
| Rika | 2 | $69,195 | 219 | 4.93/5.0 |
| Waterloo Suites | 6 | $54,725 | 140 | 4.99/5.0 |
| Sarah | 1 | $51,738 | 33 | 5.00/5.0 |
| Christy | 2 | $47,556 | 229 | 4.99/5.0 |
| Taylor | 2 | $46,894 | 141 | 4.81/5.0 |
| Lisa | 1 | $39,521 | 53 | 4.98/5.0 |
| Jerrod | 1 | $26,923 | 81 | 4.88/5.0 |
| Patrick | 1 | $23,293 | 83 | 4.94/5.0 |
| Tim | 1 | $20,864 | 29 | 5.00/5.0 |
| Anthony | 1 | $11,994 | 84 | 4.73/5.0 |
Analyzing the strategies of top hosts, such as their property selection, pricing, and guest communication, can offer valuable lessons for optimizing your own Airbnb operations in Waterloo.
Dive Deeper: Advanced Waterloo STR Market Data (2026)
Ready to unlock more insights? AirROI provides access to advanced metrics and comprehensive Airbnb data for Waterloo. Explore detailed analytics beyond this report to refine your investment strategy, optimize pricing, and maximize your vacation rental profits.
Explore Advanced MetricsWaterloo Short-Term Rental Market Composition (2026): Property & Room Types
Room Type Distribution
Property Type Distribution
Market Composition Insights for Waterloo
- The Waterloo Airbnb market composition is heavily skewed towards Entire Home/Apt listings, which make up 60% of the 20 active rentals. This indicates strong guest preference for privacy and space.
- However, a notable 40% share for Private Rooms suggests opportunities for budget-conscious travelers or hosts renting out spare rooms.
- Looking at the property type distribution in Waterloo, House properties are the most common (45%), reflecting the local real estate landscape.
- Houses represent a significant 45% portion, catering likely to families or larger groups.
- The presence of 35% Hotel/Boutique listings indicates integration with traditional hospitality.
Waterloo Airbnb Room Capacity Analysis (2026): Bedroom Distribution
Distribution of Listings by Number of Bedrooms
Room Capacity Insights for Waterloo
- The dominant room capacity in Waterloo is 2 bedrooms listings, making up 45% of the market. This suggests a strong demand for properties suitable for couples or solo travelers.
- Together, 2 bedrooms and 1 bedroom properties represent 70.0% of the active Airbnb listings in Waterloo, indicating a high concentration in these sizes.
Waterloo Vacation Rental Guest Capacity Trends (2026)
Distribution of Listings by Guest Capacity
Guest Capacity Insights for Waterloo
- The most common guest capacity trend in Waterloo vacation rentals is listings accommodating 4 guests (25%). This suggests the primary traveler segment is likely small families or groups.
- Properties designed for 4 guests and 2 guests dominate the Waterloo STR market, accounting for 50.0% of listings.
- 40.0% of properties accommodate 6+ guests, serving the market segment for larger families or group travel in Waterloo.
- On average, properties in Waterloo are equipped to host 4.5 guests.
Waterloo Airbnb Booking Patterns (2026): Available vs. Booked Days
Available Days Distribution
Booked Days Distribution
Booking Pattern Insights for Waterloo
- The most common availability pattern in Waterloo falls within the 181-270 days range, representing 60% of listings. This suggests many properties have significant open periods on their calendars.
- Approximately 90.0% of listings show high availability (181+ days open annually), indicating potential for increased bookings or specific owner usage patterns.
- For booked days, the 91-180 days range is most frequent in Waterloo (60%), reflecting common guest stay durations or potential owner blocking patterns.
- A notable 10.0% of properties secure long booking periods (181+ days booked per year), highlighting successful long-term rental strategies or significant owner usage.
Waterloo Airbnb Minimum Stay Requirements Analysis
Distribution of Listings by Minimum Night Requirement
1 Night
13 listings
65% of total
2 Nights
3 listings
15% of total
30+ Nights
4 listings
20% of total
Key Insights
- The most prevalent minimum stay requirement in Waterloo is 1 Night, adopted by 65% of listings. This highlights the market's preference for shorter, flexible bookings.
- A strong majority (80.0%) of the Waterloo Airbnb data shows acceptance of very short stays (1-2 nights), indicating a dynamic, high-turnover market.
- A significant segment (20%) caters to monthly stays (30+ nights) in Waterloo, pointing to opportunities in the extended-stay market.
Recommendations
- Align with the market by considering a 1 Night minimum stay, as 65% of Waterloo hosts use this setting.
- Explore offering discounts for stays of 30+ nights to attract the 20% of the market seeking extended stays.
- Adjust minimum nights based on seasonality – potentially shorter during low season and longer during peak demand periods in Waterloo.
Waterloo Airbnb Cancellation Policy Trends Analysis (2026)
Flexible
9 listings
45% of total
Moderate
4 listings
20% of total
Firm
6 listings
30% of total
Strict
1 listings
5% of total
Cancellation Policy Insights for Waterloo
- The prevailing Airbnb cancellation policy trend in Waterloo is Flexible, used by 45% of listings.
- There's a relatively balanced mix between guest-friendly (65.0%) and stricter (35.0%) policies, offering choices for different guest needs.
- Strict cancellation policies are quite rare (5%), potentially making listings with this policy less competitive unless justified by high demand or property type.
Recommendations for Hosts
- Consider adopting a Flexible policy to align with the 45% market standard in Waterloo.
- Using a Strict policy might deter some guests, as only 5% of listings use it. Evaluate if potential revenue protection outweighs possible lower booking rates.
- Regularly review your cancellation policy against competitors and market demand shifts in Waterloo.
Waterloo STR Booking Lead Time Analysis (2026)
Average Booking Lead Time by Month
Booking Lead Time Insights for Waterloo
- The overall average booking lead time for vacation rentals in Waterloo is 41 days.
- Guests book furthest in advance for stays during October (average 64 days), likely coinciding with peak travel demand or local events.
- The shortest booking windows occur for stays in January (average 15 days), indicating more last-minute travel plans during this time.
- Seasonally, Fall (54 days avg.) sees the longest lead times, while Winter (33 days avg.) has the shortest, reflecting typical travel planning cycles.
Recommendations for Hosts
- Use the overall average lead time (41 days) as a baseline for your pricing and availability strategy in Waterloo.
- For October stays, consider implementing length-of-stay discounts or slightly higher rates for bookings made less than 64 days out to capitalize on advance planning.
- Target marketing efforts for the Fall season well in advance (at least 54 days) to capture early planners.
- Monitor your own booking lead times against these Waterloo averages to identify opportunities for dynamic pricing adjustments.
Popular & Essential Airbnb Amenities in Waterloo (2026)
Amenity Prevalence
Amenity Insights for Waterloo
- Essential amenities in Waterloo that guests expect include: Heating, Air conditioning, Wifi, TV, Smoke alarm, First aid kit, Carbon monoxide alarm, Hangers, Hair dryer. Lacking these (any) could significantly impact bookings.
- Popular amenities like Bed linens are common but not universal. Offering these can provide a competitive edge.
Recommendations for Hosts
- Ensure your listing includes all essential amenities for Waterloo: Heating, Air conditioning, Wifi, TV, Smoke alarm, First aid kit, Carbon monoxide alarm, Hangers, Hair dryer.
- Prioritize adding missing essentials: Smoke alarm, First aid kit, Carbon monoxide alarm, Hangers, Hair dryer.
- Consider adding popular differentiators like Bed linens to increase appeal.
- Highlight unique or less common amenities you offer (e.g., hot tub, dedicated workspace, EV charger) in your listing description and photos.
- Regularly check competitor amenities in Waterloo to stay competitive.
Waterloo Airbnb Guest Demographics & Profile Analysis (2026)
Guest Profile Summary for Waterloo
- The typical guest profile for Airbnb in Waterloo consists of primarily domestic travelers (99%), often arriving from nearby Waterloo, typically belonging to the Post-2000s (Gen Z/Alpha) group (50%), primarily speaking English or German.
- Domestic travelers account for 98.7% of guests.
- Key international markets include United States (98.7%) and Mexico (0.6%).
- Top languages spoken are English (93.8%) followed by German (3.1%).
- A significant demographic segment is the Post-2000s (Gen Z/Alpha) group, representing 50% of guests.
Recommendations for Hosts
- Target domestic marketing efforts towards travelers from Waterloo and St. Louis.
- Tailor amenities and listing descriptions to appeal to the dominant Post-2000s (Gen Z/Alpha) demographic (e.g., highlight fast WiFi, smart home features, local guides).
- Highlight unique local experiences or amenities relevant to the primary guest profile.
- Consider seasonal promotions aligned with peak travel times for key origin markets.
Nearby Short-Term Rental Market Comparison
How does the Waterloo Airbnb market stack up against its neighbors? Compare key performance metrics like average monthly revenue, ADR, and occupancy rates in surrounding areas to understand the broader regional STR landscape.
| Market | Active Properties | Monthly Revenue | Daily Rate | Avg. Occupancy |
|---|---|---|---|---|
| Wright City | 13 | $4,135 | $455.44 | 37% |
| Innsbrook | 199 | $4,100 | $422.60 | 35% |
| Ste. Genevieve | 13 | $3,781 | $375.74 | 36% |
| Creve Coeur | 10 | $3,420 | $282.01 | 42% |
| Makanda | 19 | $3,145 | $247.99 | 51% |
| Godfrey | 10 | $3,077 | $217.89 | 50% |
| Maryland Heights | 19 | $2,989 | $219.63 | 55% |
| Wentzville | 19 | $2,964 | $195.63 | 51% |
| Saint Charles | 159 | $2,907 | $214.21 | 50% |
| O’Fallon | 38 | $2,897 | $225.47 | 51% |