St. Charles Township Airbnb Market Analysis 2026: Short Term Rental Data & Vacation Rental Statistics in Illinois, United States
Is Airbnb profitable in St. Charles Township in 2026? Explore comprehensive Airbnb analytics for St. Charles Township, Illinois, United States to uncover income potential. This 2026 STR market report for St. Charles Township, based on AirROI data from February 2025 to January 2026, reveals key trends in the niche market of 19 active listings.
Whether you're considering an Airbnb investment in St. Charles Township, optimizing your existing vacation rental, or exploring rental arbitrage opportunities, understanding the St. Charles Township Airbnb data is crucial. Leveraging the low regulation environment is key to maximizing your short term rental income potential. Let's dive into the specifics.
Key St. Charles Township Airbnb Performance Metrics Overview
Monthly Airbnb Revenue Variations & Income Potential in St. Charles Township (2026)
Understanding the monthly revenue variations for Airbnb listings in St. Charles Township is key to maximizing your short term rental income potential. Seasonality significantly impacts earnings. Our analysis, based on data from the past 12 months, shows that the peak revenue month for STRs in St. Charles Township is typically June, while January often presents the lowest earnings, highlighting opportunities for strategic pricing adjustments during shoulder and low seasons. Explore the typical Airbnb income in St. Charles Township across different performance tiers:
- Best-in-class properties (Top 10%) achieve $9,930+ monthly, often utilizing dynamic pricing and superior guest experiences.
- Strong performing properties (Top 25%) earn $4,874 or more, indicating effective management and desirable locations/amenities.
- Typical properties (Median) generate around $2,537 per month, representing the average market performance.
- Entry-level properties (Bottom 25%) see earnings around $1,474, often with potential for optimization.
Average Monthly Airbnb Earnings Trend in St. Charles Township
St. Charles Township Airbnb Occupancy Rate Trends (2026)
Maximize your bookings by understanding the St. Charles Township STR occupancy trends. Seasonal demand shifts significantly influence how often properties are booked. Typically, Augustsees the highest demand (peak season occupancy), while January experiences the lowest (low season). Effective strategies, like adjusting minimum stays or offering promotions, can boost occupancy during slower periods. Here's how different property tiers perform in St. Charles Township:
- Best-in-class properties (Top 10%) achieve 77%+ occupancy, indicating high desirability and potentially optimized availability.
- Strong performing properties (Top 25%) maintain 64% or higher occupancy, suggesting good market fit and guest satisfaction.
- Typical properties (Median) have an occupancy rate around 43%.
- Entry-level properties (Bottom 25%) average 23% occupancy, potentially facing higher vacancy.
Average Monthly Occupancy Rate Trend in St. Charles Township
Average Daily Rate (ADR) Airbnb Trends in St. Charles Township (2026)
Effective short term rental pricing strategy in St. Charles Township involves understanding monthly ADR fluctuations. The Average Daily Rate (ADR) for Airbnb in St. Charles Township typically peaks in October and dips lowest during April. Leveraging Airbnb dynamic pricing tools or strategies based on this seasonality can significantly boost revenue. Here's a look at the typical nightly rates achieved:
- Best-in-class properties (Top 10%) command rates of $874+ per night, often due to premium features or locations.
- Strong performing properties (Top 25%) achieve nightly rates of $319 or more.
- Typical properties (Median) charge around $168 per night.
- Entry-level properties (Bottom 25%) earn around $120 per night.
Average Daily Rate (ADR) Trend by Month in St. Charles Township
Get Live St. Charles Township Market Intelligence 👇
Explore Real-time Analytics
Airbnb Seasonality Analysis & Trends in St. Charles Township (2026)
Peak Season (June, July, May)
- Revenue averages $6,243 per month
- Occupancy rates average 55.9%
- Daily rates average $302
Shoulder Season
- Revenue averages $3,819 per month
- Occupancy maintains around 44.8%
- Daily rates hold near $332
Low Season (January, February, April)
- Revenue drops to average $2,243 per month
- Occupancy decreases to average 31.1%
- Daily rates adjust to average $295
Seasonality Insights for St. Charles Township
- The Airbnb seasonality in St. Charles Township shows highly seasonal trends requiring careful strategy. While the sections above show seasonal averages, it's also insightful to look at the extremes:
- During the high season, the absolute peak month showcases St. Charles Township's highest earning potential, with monthly revenues capable of climbing to $6,786, occupancy reaching a high of 61.3%, and ADRs peaking at $355.
- Conversely, the slowest single month of the year, typically falling within the low season, marks the market's lowest point. In this month, revenue might dip to $1,596, occupancy could drop to 25.2%, and ADRs may adjust down to $276.
- Understanding both the seasonal averages and these monthly peaks and troughs in revenue, occupancy, and ADR is crucial for maximizing your Airbnb profit potential in St. Charles Township.
Seasonal Strategies for Maximizing Profit
- Peak Season: Maximize revenue through premium pricing and potentially longer minimum stays. Ensure high availability.
- Low Season: Offer competitive pricing, special promotions (e.g., extended stay discounts), and flexible cancellation policies. Target off-season travelers like remote workers or budget-conscious guests.
- Shoulder Seasons: Implement dynamic pricing that balances peak and low rates. Target weekend travelers or specific events. Offer slightly more flexible terms than peak season.
- Regularly analyze your own performance against these St. Charles Township seasonality benchmarks and adjust your pricing and availability strategy accordingly.
Best Areas for Airbnb Investment in St. Charles Township (2026)
Exploring the top neighborhoods for short-term rentals in St. Charles Township? This section highlights key areas, outlining why they are attractive for hosts and guests, along with notable local attractions. Consider these locations based on your target guest profile and investment strategy.
| Neighborhood / Area | Why Host Here? (Target Guests & Appeal) | Key Attractions & Landmarks |
|---|---|---|
| Pottawatomie Park | A beautiful and serene area known for its parks, walking trails, and proximity to the Fox River. It's great for families and outdoor enthusiasts looking to relax in nature while being near the city. | Pottawatomie Park, Fox River, St. Charles Riverwalk, Kane County Forest Preserve, St. Charles Golf Club |
| Downtown St. Charles | The vibrant downtown area features shops, restaurants, and cafes. Its historic charm and riverfront views make it appealing to tourists and locals alike, perfect for short-term rentals. | The Arcada Theatre, St. Charles Public Library, Fox River bike trail, Riverfront Park, Café and Restaurant Row |
| Big Rock Forest Preserve | Ideal for those seeking a nature escape, this area offers hiking trails and wildlife watching, attracting visitors looking to immerse themselves in nature without leaving the city. | Big Rock Forest Preserve, Nature Trails, Wildlife Viewing, Picnic Areas |
| Norton Lake | A quiet neighborhood around a scenic lake, perfect for fishing and boating. Appeals to families and travelers looking for a peaceful retreat close to downtown amenities. | Norton Lake, Fishing and Boating, Scenic Walking Trails, Nearby Parks |
| St. Charles Park District | Home to several community parks and recreational facilities, this area is attractive for families and those looking for an active lifestyle, with lots of annual events and activities. | St. Charles Sports Complex, Community Events, Parks and Recreational Facilities |
| Delnor Woods | A suburban neighborhood known for its spacious homes and quiet streets. A great location for families and those looking for a suburban retreat with easy access to the city. | Delnor Woods Park, Family-friendly Atmosphere, Nearby Schools, Community Activities |
| Campton Hills | A neighboring township known for its beautiful landscapes and equestrian facilities. Ideal for visitors seeking a rural experience close to urban conveniences. | Campton Hills Park, Horseback Riding, Scenic Views, Nature Trails |
| Spring Hill Mall Area | A shopping and commercial hub that attracts numerous visitors. It's great for short term rentals, appealing to shoppers and those seeking convenience during their stay. | Spring Hill Mall, Shopping Centers, Restaurants and Cafes, Entertainment Options |
Understanding Airbnb License Requirements & STR Laws in St. Charles Township (2026)
While St. Charles Township, Illinois, United States currently shows low STR regulations, specific Airbnb license requirements might still exist or change. Always verify the latest short term rental regulations and Airbnb license requirements directly with local government authorities for St. Charles Township to ensure full compliance before hosting.
(Source: AirROI data, 2026, finding no licensed listings among those analyzed)
Top Performing Airbnb Properties in St. Charles Township (2026)
Benchmark your potential! Explore examples of top-performing Airbnb properties in St. Charles Townshipbased on Trailing Twelve Month (TTM) revenue. Analyze their characteristics, revenue, occupancy rate, and ADR to understand what drives success in this market.
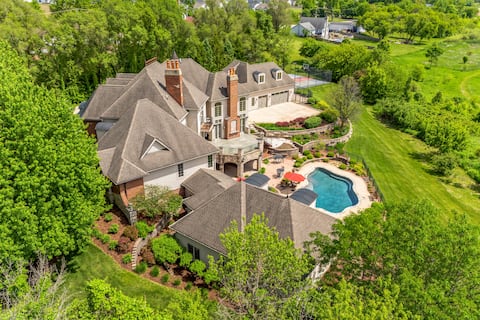
Grand Estate at the Preserve
Entire Place • 6 bedrooms
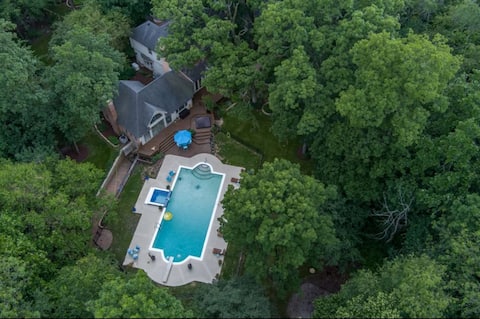
Spacious 5bd/5bth house w/Pool, Hot Tub, Sauna
Entire Place • 5 bedrooms
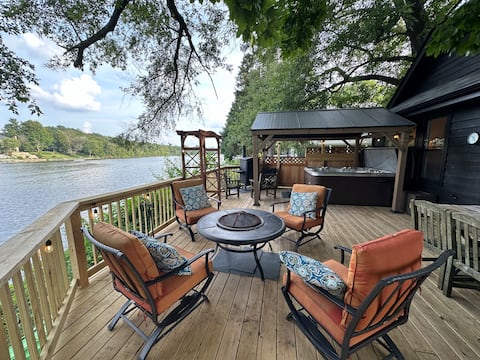
THE RIVER HOUSE Water front! Hot Tub,Sauna!
Entire Place • 4 bedrooms

Riverfront 3BR 2BA | Scenic Views & Historic Charm
Entire Place • 3 bedrooms

Red River Cottage w/firepit, Blackhawk on the Fox!
Entire Place • 2 bedrooms
Adorable 2 bedroom Cottage on the Fox River.
Entire Place • 2 bedrooms
Note: Performance varies based on location, size, amenities, seasonality, and management quality. Data reflects the past 12 months.
Top Performing Airbnb Hosts in St. Charles Township (2026)
Learn from the best! This table showcases top-performing Airbnb hosts in St. Charles Township based on the number of properties managed and estimated total revenue over the past year. Analyze their scale and performance metrics.
| Host Name | Properties | Grossing Revenue | Stay Reviews | Avg Rating |
|---|---|---|---|---|
| Joel | 1 | $160,341 | 24 | 4.96/5.0 |
| Sofiia | 1 | $130,682 | 19 | 5.00/5.0 |
| Fi | 1 | $81,307 | 68 | 4.81/5.0 |
| Jeffrey | 1 | $52,263 | 180 | 4.90/5.0 |
| Erik & Cindy | 1 | $42,960 | 278 | 4.97/5.0 |
| Sam | 2 | $42,696 | 152 | 4.87/5.0 |
| Marianne | 1 | $36,122 | 34 | 5.00/5.0 |
| Cheri | 2 | $33,459 | 497 | 4.96/5.0 |
| Dawn | 1 | $33,250 | 22 | 4.59/5.0 |
| Mark And Susanna | 1 | $33,203 | 57 | 4.88/5.0 |
Analyzing the strategies of top hosts, such as their property selection, pricing, and guest communication, can offer valuable lessons for optimizing your own Airbnb operations in St. Charles Township.
Dive Deeper: Advanced St. Charles Township STR Market Data (2026)
Ready to unlock more insights? AirROI provides access to advanced metrics and comprehensive Airbnb data for St. Charles Township. Explore detailed analytics beyond this report to refine your investment strategy, optimize pricing, and maximize your vacation rental profits.
Explore Advanced MetricsSt. Charles Township Short-Term Rental Market Composition (2026): Property & Room Types
Room Type Distribution
Property Type Distribution
Market Composition Insights for St. Charles Township
- The St. Charles Township Airbnb market composition is heavily skewed towards Entire Home/Apt listings, which make up 84.2% of the 19 active rentals. This indicates strong guest preference for privacy and space.
- Looking at the property type distribution in St. Charles Township, House properties are the most common (63.2%), reflecting the local real estate landscape.
- Houses represent a significant 63.2% portion, catering likely to families or larger groups.
- The presence of 5.3% Hotel/Boutique listings indicates integration with traditional hospitality.
St. Charles Township Airbnb Room Capacity Analysis (2026): Bedroom Distribution
Distribution of Listings by Number of Bedrooms
Room Capacity Insights for St. Charles Township
- The dominant room capacity in St. Charles Township is 2 bedrooms listings, making up 36.8% of the market. This suggests a strong demand for properties suitable for couples or solo travelers.
- Together, 2 bedrooms and 1 bedroom properties represent 57.9% of the active Airbnb listings in St. Charles Township, indicating a high concentration in these sizes.
- A significant 26.3% of listings offer 3+ bedrooms, catering to larger groups and families seeking more space in St. Charles Township.
St. Charles Township Vacation Rental Guest Capacity Trends (2026)
Distribution of Listings by Guest Capacity
Guest Capacity Insights for St. Charles Township
- The most common guest capacity trend in St. Charles Township vacation rentals is listings accommodating 2 guests (26.3%). This suggests the primary traveler segment is likely couples or solo travelers.
- Properties designed for 2 guests and 8+ guests dominate the St. Charles Township STR market, accounting for 52.6% of listings.
- 31.6% of properties accommodate 6+ guests, serving the market segment for larger families or group travel in St. Charles Township.
- On average, properties in St. Charles Township are equipped to host 4.2 guests.
St. Charles Township Airbnb Booking Patterns (2026): Available vs. Booked Days
Available Days Distribution
Booked Days Distribution
Booking Pattern Insights for St. Charles Township
- The most common availability pattern in St. Charles Township falls within the 181-270 days range, representing 47.4% of listings. This suggests many properties have significant open periods on their calendars.
- Approximately 79.0% of listings show high availability (181+ days open annually), indicating potential for increased bookings or specific owner usage patterns.
- For booked days, the 91-180 days range is most frequent in St. Charles Township (52.6%), reflecting common guest stay durations or potential owner blocking patterns.
- A notable 21.1% of properties secure long booking periods (181+ days booked per year), highlighting successful long-term rental strategies or significant owner usage.
St. Charles Township Airbnb Minimum Stay Requirements Analysis
Distribution of Listings by Minimum Night Requirement
1 Night
7 listings
36.8% of total
2 Nights
2 listings
10.5% of total
3 Nights
1 listings
5.3% of total
4-6 Nights
1 listings
5.3% of total
7-29 Nights
2 listings
10.5% of total
30+ Nights
6 listings
31.6% of total
Key Insights
- The most prevalent minimum stay requirement in St. Charles Township is 1 Night, adopted by 36.8% of listings. This highlights the market's preference for shorter, flexible bookings.
- A significant segment (31.6%) caters to monthly stays (30+ nights) in St. Charles Township, pointing to opportunities in the extended-stay market.
Recommendations
- Align with the market by considering a 1 Night minimum stay, as 36.8% of St. Charles Township hosts use this setting.
- Explore offering discounts for stays of 30+ nights to attract the 31.6% of the market seeking extended stays.
- Adjust minimum nights based on seasonality – potentially shorter during low season and longer during peak demand periods in St. Charles Township.
St. Charles Township Airbnb Cancellation Policy Trends Analysis (2026)
Flexible
3 listings
15.8% of total
Moderate
4 listings
21.1% of total
Firm
10 listings
52.6% of total
Strict
2 listings
10.5% of total
Cancellation Policy Insights for St. Charles Township
- The prevailing Airbnb cancellation policy trend in St. Charles Township is Firm, used by 52.6% of listings.
- A majority (63.1%) of hosts in St. Charles Township utilize Firm or Strict policies, indicating a market where hosts prioritize booking security.
Recommendations for Hosts
- Consider adopting a Firm policy to align with the 52.6% market standard in St. Charles Township.
- Using a Strict policy might deter some guests, as only 10.5% of listings use it. Evaluate if potential revenue protection outweighs possible lower booking rates.
- Regularly review your cancellation policy against competitors and market demand shifts in St. Charles Township.
St. Charles Township STR Booking Lead Time Analysis (2026)
Average Booking Lead Time by Month
Booking Lead Time Insights for St. Charles Township
- The overall average booking lead time for vacation rentals in St. Charles Township is 46 days.
- Guests book furthest in advance for stays during July (average 75 days), likely coinciding with peak travel demand or local events.
- The shortest booking windows occur for stays in March (average 23 days), indicating more last-minute travel plans during this time.
- Seasonally, Summer (70 days avg.) sees the longest lead times, while Winter (35 days avg.) has the shortest, reflecting typical travel planning cycles.
Recommendations for Hosts
- Use the overall average lead time (46 days) as a baseline for your pricing and availability strategy in St. Charles Township.
- For July stays, consider implementing length-of-stay discounts or slightly higher rates for bookings made less than 75 days out to capitalize on advance planning.
- Target marketing efforts for the Summer season well in advance (at least 70 days) to capture early planners.
- Monitor your own booking lead times against these St. Charles Township averages to identify opportunities for dynamic pricing adjustments.
Popular & Essential Airbnb Amenities in St. Charles Township (2026)
Amenity Prevalence
Amenity Insights for St. Charles Township
- Popular amenities like Free parking on premises, Air conditioning, Heating are common but not universal. Offering these can provide a competitive edge.
- Warning: Wifi is not universally provided but is considered essential globally. Ensure reliable Wifi is offered.
Recommendations for Hosts
- Consider adding popular differentiators like Free parking on premises or Air conditioning to increase appeal.
- Highlight unique or less common amenities you offer (e.g., hot tub, dedicated workspace, EV charger) in your listing description and photos.
- Regularly check competitor amenities in St. Charles Township to stay competitive.
St. Charles Township Airbnb Guest Demographics & Profile Analysis (2026)
Guest Profile Summary for St. Charles Township
- The typical guest profile for Airbnb in St. Charles Township consists of primarily domestic travelers (96%), often arriving from nearby Chicago, typically belonging to the Post-2000s (Gen Z/Alpha) group (50%), primarily speaking English or Spanish.
- Domestic travelers account for 95.8% of guests.
- Key international markets include United States (95.8%) and Canada (1.2%).
- Top languages spoken are English (66.7%) followed by Spanish (11.5%).
- A significant demographic segment is the Post-2000s (Gen Z/Alpha) group, representing 50% of guests.
Recommendations for Hosts
- Target domestic marketing efforts towards travelers from Chicago and Indianapolis.
- Tailor amenities and listing descriptions to appeal to the dominant Post-2000s (Gen Z/Alpha) demographic (e.g., highlight fast WiFi, smart home features, local guides).
- Highlight unique local experiences or amenities relevant to the primary guest profile.
- Consider seasonal promotions aligned with peak travel times for key origin markets.
Nearby Short-Term Rental Market Comparison
How does the St. Charles Township Airbnb market stack up against its neighbors? Compare key performance metrics like average monthly revenue, ADR, and occupancy rates in surrounding areas to understand the broader regional STR landscape.
| Market | Active Properties | Monthly Revenue | Daily Rate | Avg. Occupancy |
|---|---|---|---|---|
| Town of Sugar Creek | 18 | $9,830 | $662.90 | 53% |
| Twin Lakes | 35 | $6,152 | $547.54 | 43% |
| Lake Geneva | 209 | $5,014 | $473.36 | 41% |
| Town of Geneva | 63 | $5,012 | $448.89 | 43% |
| McHenry | 32 | $4,982 | $463.12 | 44% |
| Salem Lakes | 23 | $4,513 | $330.45 | 49% |
| Elmhurst | 16 | $4,469 | $355.09 | 49% |
| Fontana-on-Geneva Lake | 69 | $4,455 | $556.77 | 37% |
| Como | 53 | $4,236 | $387.43 | 41% |
| Addison Township | 19 | $4,214 | $362.67 | 42% |