Shelbyville Airbnb Market Analysis 2026: Short Term Rental Data & Vacation Rental Statistics in Illinois, United States
Is Airbnb profitable in Shelbyville in 2026? Explore comprehensive Airbnb analytics for Shelbyville, Illinois, United States to uncover income potential. This 2026 STR market report for Shelbyville, based on AirROI data from February 2025 to January 2026, reveals key trends in the niche market of 31 active listings.
Whether you're considering an Airbnb investment in Shelbyville, optimizing your existing vacation rental, or exploring rental arbitrage opportunities, understanding the Shelbyville Airbnb data is crucial. Leveraging the low regulation environment is key to maximizing your short term rental income potential. Let's dive into the specifics.
Key Shelbyville Airbnb Performance Metrics Overview
Monthly Airbnb Revenue Variations & Income Potential in Shelbyville (2026)
Understanding the monthly revenue variations for Airbnb listings in Shelbyville is key to maximizing your short term rental income potential. Seasonality significantly impacts earnings. Our analysis, based on data from the past 12 months, shows that the peak revenue month for STRs in Shelbyville is typically August, while January often presents the lowest earnings, highlighting opportunities for strategic pricing adjustments during shoulder and low seasons. Explore the typical Airbnb income in Shelbyville across different performance tiers:
- Best-in-class properties (Top 10%) achieve $4,161+ monthly, often utilizing dynamic pricing and superior guest experiences.
- Strong performing properties (Top 25%) earn $2,602 or more, indicating effective management and desirable locations/amenities.
- Typical properties (Median) generate around $1,288 per month, representing the average market performance.
- Entry-level properties (Bottom 25%) see earnings around $769, often with potential for optimization.
Average Monthly Airbnb Earnings Trend in Shelbyville
Shelbyville Airbnb Occupancy Rate Trends (2026)
Maximize your bookings by understanding the Shelbyville STR occupancy trends. Seasonal demand shifts significantly influence how often properties are booked. Typically, Julysees the highest demand (peak season occupancy), while January experiences the lowest (low season). Effective strategies, like adjusting minimum stays or offering promotions, can boost occupancy during slower periods. Here's how different property tiers perform in Shelbyville:
- Best-in-class properties (Top 10%) achieve 65%+ occupancy, indicating high desirability and potentially optimized availability.
- Strong performing properties (Top 25%) maintain 43% or higher occupancy, suggesting good market fit and guest satisfaction.
- Typical properties (Median) have an occupancy rate around 28%.
- Entry-level properties (Bottom 25%) average 18% occupancy, potentially facing higher vacancy.
Average Monthly Occupancy Rate Trend in Shelbyville
Average Daily Rate (ADR) Airbnb Trends in Shelbyville (2026)
Effective short term rental pricing strategy in Shelbyville involves understanding monthly ADR fluctuations. The Average Daily Rate (ADR) for Airbnb in Shelbyville typically peaks in December and dips lowest during March. Leveraging Airbnb dynamic pricing tools or strategies based on this seasonality can significantly boost revenue. Here's a look at the typical nightly rates achieved:
- Best-in-class properties (Top 10%) command rates of $286+ per night, often due to premium features or locations.
- Strong performing properties (Top 25%) achieve nightly rates of $199 or more.
- Typical properties (Median) charge around $143 per night.
- Entry-level properties (Bottom 25%) earn around $99 per night.
Average Daily Rate (ADR) Trend by Month in Shelbyville
Get Live Shelbyville Market Intelligence 👇

Explore Real-time Analytics
Airbnb Seasonality Analysis & Trends in Shelbyville (2026)
Peak Season (August, July, October)
- Revenue averages $2,415 per month
- Occupancy rates average 41.1%
- Daily rates average $169
Shoulder Season
- Revenue averages $2,086 per month
- Occupancy maintains around 34.4%
- Daily rates hold near $169
Low Season (January, February, March)
- Revenue drops to average $1,175 per month
- Occupancy decreases to average 21.5%
- Daily rates adjust to average $162
Seasonality Insights for Shelbyville
- The Airbnb seasonality in Shelbyville shows highly seasonal trends requiring careful strategy. While the sections above show seasonal averages, it's also insightful to look at the extremes:
- During the high season, the absolute peak month showcases Shelbyville's highest earning potential, with monthly revenues capable of climbing to $2,488, occupancy reaching a high of 42.7%, and ADRs peaking at $181.
- Conversely, the slowest single month of the year, typically falling within the low season, marks the market's lowest point. In this month, revenue might dip to $986, occupancy could drop to 14.0%, and ADRs may adjust down to $153.
- Understanding both the seasonal averages and these monthly peaks and troughs in revenue, occupancy, and ADR is crucial for maximizing your Airbnb profit potential in Shelbyville.
Seasonal Strategies for Maximizing Profit
- Peak Season: Maximize revenue through premium pricing and potentially longer minimum stays. Ensure high availability.
- Low Season: Offer competitive pricing, special promotions (e.g., extended stay discounts), and flexible cancellation policies. Target off-season travelers like remote workers or budget-conscious guests.
- Shoulder Seasons: Implement dynamic pricing that balances peak and low rates. Target weekend travelers or specific events. Offer slightly more flexible terms than peak season.
- Regularly analyze your own performance against these Shelbyville seasonality benchmarks and adjust your pricing and availability strategy accordingly.
Best Areas for Airbnb Investment in Shelbyville (2026)
Exploring the top neighborhoods for short-term rentals in Shelbyville? This section highlights key areas, outlining why they are attractive for hosts and guests, along with notable local attractions. Consider these locations based on your target guest profile and investment strategy.
| Neighborhood / Area | Why Host Here? (Target Guests & Appeal) | Key Attractions & Landmarks |
|---|---|---|
| Downtown Shelbyville | The heart of Shelbyville, featuring local shops, eateries, and cultural spots. Ideal for travelers seeking convenience and local charm. | Shelby County Courthouse, The Shelbyville Public Library, Local restaurants and cafes |
| Lake Shelbyville | A popular recreational area with beautiful lake views and outdoor activities. Great for families and nature enthusiasts. | Lake Shelbyville, Shelbyville State Park, Boating and fishing opportunities |
| Historic District | Filled with charming 19th-century architecture, this area showcases Shelbyville's history and offers a unique stay experience. | Museum of Shelby County History, Historic homes tours, Local antique shops |
| Parks and Recreational Areas | Access to green spaces and parks, ideal for families and those looking for outdoor adventures. | Katy Park, Forest Park, Playground facilities |
| Auto Racing Events | Known for hosting auto racing events nearby, attracting motorsport enthusiasts and spectators. | Local racetracks, Car shows, Motorsport events |
| Nearby Amish Communities | Explore the nearby Amish communities for a unique cultural experience and artisanal goods shopping. | Amish markets, Craft shops, Cultural tours |
| Shopping District | A burgeoning area with a variety of shops and boutiques, perfect for visitors who love to shop local. | Local boutiques, Gift shops, Shopping centers |
| Farmers Market Area | Hosts a seasonal farmers market, appealing to foodies and those interested in local produce and crafts. | Farmers market, Local produce stands, Community events |
Understanding Airbnb License Requirements & STR Laws in Shelbyville (2026)
While Shelbyville, Illinois, United States currently shows low STR regulations, specific Airbnb license requirements might still exist or change. Always verify the latest short term rental regulations and Airbnb license requirements directly with local government authorities for Shelbyville to ensure full compliance before hosting.
(Source: AirROI data, 2026, finding no licensed listings among those analyzed)
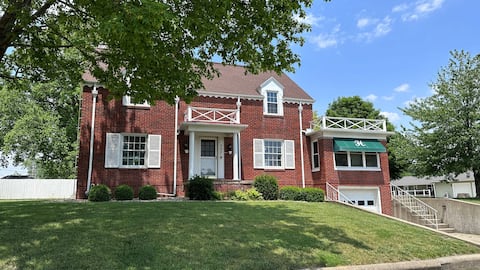
Top Performing Airbnb Properties in Shelbyville (2026)
Benchmark your potential! Explore examples of top-performing Airbnb properties in Shelbyvillebased on Trailing Twelve Month (TTM) revenue. Analyze their characteristics, revenue, occupancy rate, and ADR to understand what drives success in this market.
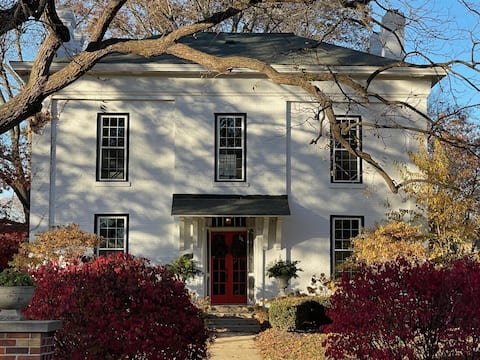
909 & Vine Photo Worthy Home With Pool & Hot Tub
Entire Place • 3 bedrooms
The Hub- 4 min to lake ramp/boat parking/Hot Tub
Entire Place • 4 bedrooms
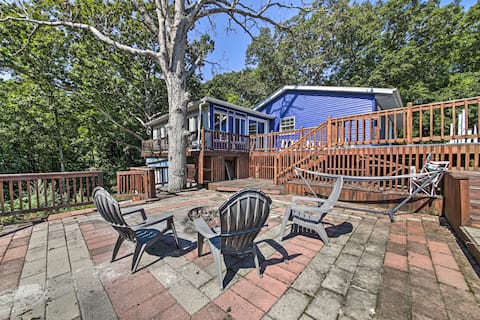
Woodsy Home w/ View, 1 Mi to Lake Shelbyville
Entire Place • 3 bedrooms

Our Dam House
Entire Place • 3 bedrooms

Queen City Cottage - Hot Tub & Tiki Bar
Entire Place • 3 bedrooms

Lake Shelbyville Home with a View
Entire Place • 4 bedrooms
Note: Performance varies based on location, size, amenities, seasonality, and management quality. Data reflects the past 12 months.
Top Performing Airbnb Hosts in Shelbyville (2026)
Learn from the best! This table showcases top-performing Airbnb hosts in Shelbyville based on the number of properties managed and estimated total revenue over the past year. Analyze their scale and performance metrics.
| Host Name | Properties | Grossing Revenue | Stay Reviews | Avg Rating |
|---|---|---|---|---|
| Renee | 4 | $161,803 | 120 | 4.83/5.0 |
| Foxmore Lodge | 8 | $106,443 | 193 | 5.00/5.0 |
| Evolve | 1 | $44,575 | 50 | 4.66/5.0 |
| Monica | 1 | $40,505 | 36 | 4.94/5.0 |
| Doug | 1 | $32,991 | 60 | 4.90/5.0 |
| Kendra | 1 | $31,164 | 80 | 4.98/5.0 |
| Donna | 1 | $29,684 | 38 | 4.71/5.0 |
| Lauren | 1 | $25,937 | 92 | 4.98/5.0 |
| Mark | 2 | $25,734 | 75 | 4.81/5.0 |
| Tracy | 1 | $23,553 | 14 | 4.93/5.0 |
Analyzing the strategies of top hosts, such as their property selection, pricing, and guest communication, can offer valuable lessons for optimizing your own Airbnb operations in Shelbyville.
Dive Deeper: Advanced Shelbyville STR Market Data (2026)
Ready to unlock more insights? AirROI provides access to advanced metrics and comprehensive Airbnb data for Shelbyville. Explore detailed analytics beyond this report to refine your investment strategy, optimize pricing, and maximize your vacation rental profits.
Explore Advanced MetricsShelbyville Short-Term Rental Market Composition (2026): Property & Room Types
Room Type Distribution
Property Type Distribution
Market Composition Insights for Shelbyville
- The Shelbyville Airbnb market composition is heavily skewed towards Private Room listings, which make up 58.1% of the 31 active rentals. This indicates strong guest preference for privacy and space.
- Looking at the property type distribution in Shelbyville, Hotel/Boutique properties are the most common (58.1%), reflecting the local real estate landscape.
- Houses represent a significant 29% portion, catering likely to families or larger groups.
- The presence of 58.1% Hotel/Boutique listings indicates integration with traditional hospitality.
- Smaller segments like others (combined 3.2%) offer potential for unique stay experiences.
Shelbyville Airbnb Room Capacity Analysis (2026): Bedroom Distribution
Distribution of Listings by Number of Bedrooms
Room Capacity Insights for Shelbyville
- The dominant room capacity in Shelbyville is 1 bedroom listings, making up 61.3% of the market. This suggests a strong demand for properties suitable for couples or solo travelers.
- Together, 1 bedroom and 3 bedrooms properties represent 80.7% of the active Airbnb listings in Shelbyville, indicating a high concentration in these sizes.
- With over half the market (61.3%) consisting of studios or 1-bedroom units, Shelbyville is particularly well-suited for individuals or couples.
- A significant 29.1% of listings offer 3+ bedrooms, catering to larger groups and families seeking more space in Shelbyville.
Shelbyville Vacation Rental Guest Capacity Trends (2026)
Distribution of Listings by Guest Capacity
Guest Capacity Insights for Shelbyville
- The most common guest capacity trend in Shelbyville vacation rentals is listings accommodating 2 guests (25.8%). This suggests the primary traveler segment is likely couples or solo travelers.
- Properties designed for 2 guests and 3 guests dominate the Shelbyville STR market, accounting for 48.4% of listings.
- 38.7% of properties accommodate 6+ guests, serving the market segment for larger families or group travel in Shelbyville.
- On average, properties in Shelbyville are equipped to host 4.4 guests.
Shelbyville Airbnb Booking Patterns (2026): Available vs. Booked Days
Available Days Distribution
Booked Days Distribution
Booking Pattern Insights for Shelbyville
- The most common availability pattern in Shelbyville falls within the 181-270 days range, representing 48.4% of listings. This suggests many properties have significant open periods on their calendars.
- Approximately 93.6% of listings show high availability (181+ days open annually), indicating potential for increased bookings or specific owner usage patterns.
- For booked days, the 91-180 days range is most frequent in Shelbyville (51.6%), reflecting common guest stay durations or potential owner blocking patterns.
- A notable 9.7% of properties secure long booking periods (181+ days booked per year), highlighting successful long-term rental strategies or significant owner usage.
Shelbyville Airbnb Minimum Stay Requirements Analysis
Distribution of Listings by Minimum Night Requirement
1 Night
11 listings
35.5% of total
2 Nights
18 listings
58.1% of total
3 Nights
1 listings
3.2% of total
30+ Nights
1 listings
3.2% of total
Key Insights
- The most prevalent minimum stay requirement in Shelbyville is 2 Nights, adopted by 58.1% of listings. This highlights the market's preference for shorter, flexible bookings.
- A strong majority (93.6%) of the Shelbyville Airbnb data shows acceptance of very short stays (1-2 nights), indicating a dynamic, high-turnover market.
Recommendations
- Align with the market by considering a 2 Nights minimum stay, as 58.1% of Shelbyville hosts use this setting.
- Adjust minimum nights based on seasonality – potentially shorter during low season and longer during peak demand periods in Shelbyville.
Shelbyville Airbnb Cancellation Policy Trends Analysis (2026)
Super Strict 30 Days
1 listings
3.2% of total
Flexible
11 listings
35.5% of total
Moderate
3 listings
9.7% of total
Firm
10 listings
32.3% of total
Strict
6 listings
19.4% of total
Cancellation Policy Insights for Shelbyville
- The prevailing Airbnb cancellation policy trend in Shelbyville is Flexible, used by 35.5% of listings.
- A majority (51.7%) of hosts in Shelbyville utilize Firm or Strict policies, indicating a market where hosts prioritize booking security.
Recommendations for Hosts
- Consider adopting a Flexible policy to align with the 35.5% market standard in Shelbyville.
- Regularly review your cancellation policy against competitors and market demand shifts in Shelbyville.
Shelbyville STR Booking Lead Time Analysis (2026)
Average Booking Lead Time by Month
Booking Lead Time Insights for Shelbyville
- The overall average booking lead time for vacation rentals in Shelbyville is 79 days.
- Guests book furthest in advance for stays during June (average 128 days), likely coinciding with peak travel demand or local events.
- The shortest booking windows occur for stays in April (average 51 days), indicating more last-minute travel plans during this time.
- Seasonally, Fall (105 days avg.) sees the longest lead times, while Spring (71 days avg.) has the shortest, reflecting typical travel planning cycles.
Recommendations for Hosts
- Use the overall average lead time (79 days) as a baseline for your pricing and availability strategy in Shelbyville.
- For June stays, consider implementing length-of-stay discounts or slightly higher rates for bookings made less than 128 days out to capitalize on advance planning.
- Target marketing efforts for the Fall season well in advance (at least 105 days) to capture early planners.
- Monitor your own booking lead times against these Shelbyville averages to identify opportunities for dynamic pricing adjustments.
Popular & Essential Airbnb Amenities in Shelbyville (2026)
Amenity Prevalence
Amenity Insights for Shelbyville
- Essential amenities in Shelbyville that guests expect include: Air conditioning, TV. Lacking these (any) could significantly impact bookings.
- Popular amenities like Heating, Hot water, Wifi are common but not universal. Offering these can provide a competitive edge.
- Warning: Wifi is not universally provided but is considered essential globally. Ensure reliable Wifi is offered.
Recommendations for Hosts
- Ensure your listing includes all essential amenities for Shelbyville: Air conditioning, TV.
- Consider adding popular differentiators like Heating or Hot water to increase appeal.
- Highlight unique or less common amenities you offer (e.g., hot tub, dedicated workspace, EV charger) in your listing description and photos.
- Regularly check competitor amenities in Shelbyville to stay competitive.
Shelbyville Airbnb Guest Demographics & Profile Analysis (2026)
Guest Profile Summary for Shelbyville
- The typical guest profile for Airbnb in Shelbyville consists of primarily domestic travelers (99%), often arriving from nearby Chicago, typically belonging to the Post-2000s (Gen Z/Alpha) group (50%), primarily speaking English or Spanish.
- Domestic travelers account for 98.5% of guests.
- Key international markets include United States (98.5%) and Hong Kong (0.8%).
- Top languages spoken are English (79.1%) followed by Spanish (11.6%).
- A significant demographic segment is the Post-2000s (Gen Z/Alpha) group, representing 50% of guests.
Recommendations for Hosts
- Target domestic marketing efforts towards travelers from Chicago and Springfield.
- Tailor amenities and listing descriptions to appeal to the dominant Post-2000s (Gen Z/Alpha) demographic (e.g., highlight fast WiFi, smart home features, local guides).
- Highlight unique local experiences or amenities relevant to the primary guest profile.
- Consider seasonal promotions aligned with peak travel times for key origin markets.
Nearby Short-Term Rental Market Comparison
How does the Shelbyville Airbnb market stack up against its neighbors? Compare key performance metrics like average monthly revenue, ADR, and occupancy rates in surrounding areas to understand the broader regional STR landscape.
| Market | Active Properties | Monthly Revenue | Daily Rate | Avg. Occupancy |
|---|---|---|---|---|
| Marshall | 12 | $3,135 | $264.69 | 39% |
| Effingham | 22 | $3,085 | $277.14 | 44% |
| East Peoria | 24 | $2,949 | $218.85 | 50% |
| Centralia | 17 | $2,873 | $220.87 | 51% |
| Sullivan | 13 | $2,287 | $184.90 | 45% |
| Edwardsville | 23 | $2,279 | $191.47 | 47% |
| Champaign | 264 | $2,277 | $200.84 | 44% |
| Vandalia | 10 | $2,253 | $280.62 | 48% |
| West Peoria | 14 | $2,169 | $130.84 | 56% |
| Washington | 14 | $2,165 | $178.41 | 42% |