Savanna Airbnb Market Analysis 2026: Short Term Rental Data & Vacation Rental Statistics in Illinois, United States
Is Airbnb profitable in Savanna in 2026? Explore comprehensive Airbnb analytics for Savanna, Illinois, United States to uncover income potential. This 2026 STR market report for Savanna, based on AirROI data from February 2025 to January 2026, reveals key trends in the niche market of 35 active listings.
Whether you're considering an Airbnb investment in Savanna, optimizing your existing vacation rental, or exploring rental arbitrage opportunities, understanding the Savanna Airbnb data is crucial. Leveraging the low regulation environment is key to maximizing your short term rental income potential. Let's dive into the specifics.
Key Savanna Airbnb Performance Metrics Overview
Monthly Airbnb Revenue Variations & Income Potential in Savanna (2026)
Understanding the monthly revenue variations for Airbnb listings in Savanna is key to maximizing your short term rental income potential. Seasonality significantly impacts earnings. Our analysis, based on data from the past 12 months, shows that the peak revenue month for STRs in Savanna is typically August, while February often presents the lowest earnings, highlighting opportunities for strategic pricing adjustments during shoulder and low seasons. Explore the typical Airbnb income in Savanna across different performance tiers:
- Best-in-class properties (Top 10%) achieve $2,900+ monthly, often utilizing dynamic pricing and superior guest experiences.
- Strong performing properties (Top 25%) earn $1,999 or more, indicating effective management and desirable locations/amenities.
- Typical properties (Median) generate around $1,128 per month, representing the average market performance.
- Entry-level properties (Bottom 25%) see earnings around $605, often with potential for optimization.
Average Monthly Airbnb Earnings Trend in Savanna
Savanna Airbnb Occupancy Rate Trends (2026)
Maximize your bookings by understanding the Savanna STR occupancy trends. Seasonal demand shifts significantly influence how often properties are booked. Typically, Augustsees the highest demand (peak season occupancy), while January experiences the lowest (low season). Effective strategies, like adjusting minimum stays or offering promotions, can boost occupancy during slower periods. Here's how different property tiers perform in Savanna:
- Best-in-class properties (Top 10%) achieve 65%+ occupancy, indicating high desirability and potentially optimized availability.
- Strong performing properties (Top 25%) maintain 43% or higher occupancy, suggesting good market fit and guest satisfaction.
- Typical properties (Median) have an occupancy rate around 24%.
- Entry-level properties (Bottom 25%) average 14% occupancy, potentially facing higher vacancy.
Average Monthly Occupancy Rate Trend in Savanna
Average Daily Rate (ADR) Airbnb Trends in Savanna (2026)
Effective short term rental pricing strategy in Savanna involves understanding monthly ADR fluctuations. The Average Daily Rate (ADR) for Airbnb in Savanna typically peaks in October and dips lowest during February. Leveraging Airbnb dynamic pricing tools or strategies based on this seasonality can significantly boost revenue. Here's a look at the typical nightly rates achieved:
- Best-in-class properties (Top 10%) command rates of $205+ per night, often due to premium features or locations.
- Strong performing properties (Top 25%) achieve nightly rates of $162 or more.
- Typical properties (Median) charge around $137 per night.
- Entry-level properties (Bottom 25%) earn around $103 per night.
Average Daily Rate (ADR) Trend by Month in Savanna
Get Live Savanna Market Intelligence 👇

Explore Real-time Analytics
Airbnb Seasonality Analysis & Trends in Savanna (2026)
Peak Season (August, July, June)
- Revenue averages $2,041 per month
- Occupancy rates average 42.9%
- Daily rates average $144
Shoulder Season
- Revenue averages $1,462 per month
- Occupancy maintains around 31.6%
- Daily rates hold near $142
Low Season (January, February, May)
- Revenue drops to average $847 per month
- Occupancy decreases to average 21.2%
- Daily rates adjust to average $139
Seasonality Insights for Savanna
- The Airbnb seasonality in Savanna shows highly seasonal trends requiring careful strategy. While the sections above show seasonal averages, it's also insightful to look at the extremes:
- During the high season, the absolute peak month showcases Savanna's highest earning potential, with monthly revenues capable of climbing to $2,129, occupancy reaching a high of 46.4%, and ADRs peaking at $150.
- Conversely, the slowest single month of the year, typically falling within the low season, marks the market's lowest point. In this month, revenue might dip to $668, occupancy could drop to 20.9%, and ADRs may adjust down to $132.
- Understanding both the seasonal averages and these monthly peaks and troughs in revenue, occupancy, and ADR is crucial for maximizing your Airbnb profit potential in Savanna.
Seasonal Strategies for Maximizing Profit
- Peak Season: Maximize revenue through premium pricing and potentially longer minimum stays. Ensure high availability.
- Low Season: Offer competitive pricing, special promotions (e.g., extended stay discounts), and flexible cancellation policies. Target off-season travelers like remote workers or budget-conscious guests.
- Shoulder Seasons: Implement dynamic pricing that balances peak and low rates. Target weekend travelers or specific events. Offer slightly more flexible terms than peak season.
- Regularly analyze your own performance against these Savanna seasonality benchmarks and adjust your pricing and availability strategy accordingly.
Best Areas for Airbnb Investment in Savanna (2026)
Exploring the top neighborhoods for short-term rentals in Savanna? This section highlights key areas, outlining why they are attractive for hosts and guests, along with notable local attractions. Consider these locations based on your target guest profile and investment strategy.
| Neighborhood / Area | Why Host Here? (Target Guests & Appeal) | Key Attractions & Landmarks |
|---|---|---|
| Downtown Savannah | Historic heart of Savannah with picturesque squares, cobblestone streets, and vibrant nightlife. Great for tourists because of its proximity to restaurants, shops, and the Savannah River. | Forsyth Park, River Street, Savannah Historic District, Bonaventure Cemetery, Cathedral of St. John the Baptist |
| The Historic District | Famous for its well-preserved architecture and rich history. It’s a prime tourist area with beautiful parks and historic homes. | Owens-Thomas House, Juliette Gordon Low Birthplace, Savannah College of Art and Design, 12 Oaks, Lafayette Square |
| Tybee Island | A nearby beach destination known for its laid-back vibe and natural beauty. Ideal for families and beachgoers looking for a coastal experience. | Tybee Island Beach, Tybee Island Light Station and Museum, Cockspur Island Light, Dolphin Tours, Fort Pulaski National Monument |
| Midtown Savannah | A blend of residential and commercial areas that offers a more local experience with dining and shopping options. Attracts visitors looking for a more authentic Savannah experience. | Abercorn Street shops, Henderson Golf Club, Daffin Park, Savannah Mall, Skidaway Island State Park |
| River Street | An iconic and bustling waterfront area with shops, restaurants, and historic buildings. It’s perfect for visitors to experience the riverfront during their stay. | Savannah Riverboat Cruises, River Street Marketplace, The Waving Girl Statue, The Olde Pink House, City Market |
| Pooler | A suburban area close to Savannah, known for modern amenities and family-friendly attractions. It is gaining popularity among visitors looking for affordable stays. | Tanger Outlets, Pooler Soccer Complex, Fun Zone Amusement and Sports Park, Southbridge Golf Club, The National Museum of the Mighty Eighth Air Force |
| Wilmington Island | Quiet residential area with beautiful landscapes and close proximity to the beach. Appeals to visitors seeking a tranquil getaway. | Wilmington Island Club, Savannah Beach, Wilmington Island Farmers Market, Dunham Farms, St. Andrews School |
| Skidaway Island | A scenic area known for its golf courses and nature preserves, attracting nature lovers and those looking for outdoor activities. | Skidaway Island State Park, The Landings Golf Club, Wassaw National Wildlife Refuge, Cahill's Market & Cafe, Savannah Scenic River Tours |
Understanding Airbnb License Requirements & STR Laws in Savanna (2026)
While Savanna, Illinois, United States currently shows low STR regulations, specific Airbnb license requirements might still exist or change. Always verify the latest short term rental regulations and Airbnb license requirements directly with local government authorities for Savanna to ensure full compliance before hosting.
(Source: AirROI data, 2026, finding no licensed listings among those analyzed)
Top Performing Airbnb Properties in Savanna (2026)
Benchmark your potential! Explore examples of top-performing Airbnb properties in Savannabased on Trailing Twelve Month (TTM) revenue. Analyze their characteristics, revenue, occupancy rate, and ADR to understand what drives success in this market.

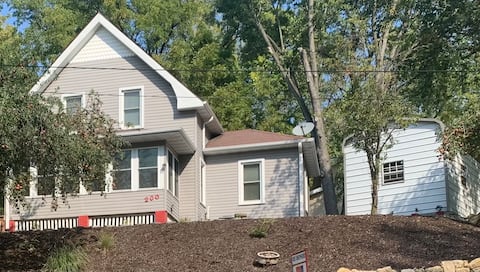
Savanna Vista - Entire Home
Entire Place • 3 bedrooms

Cozy, Secluded Cabin -A Peaceful Getaway Location!
Entire Place • 1 bedroom
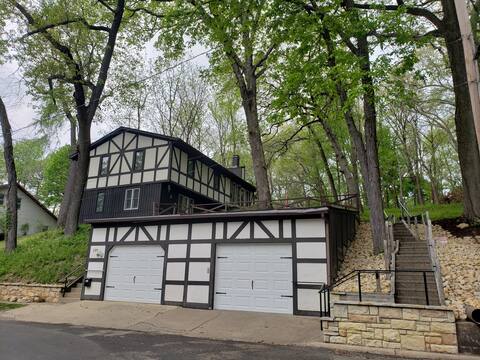
House On The Hill - Spacious, 3-Bedroom Home
Entire Place • 3 bedrooms
SNL Getaway LLC
Entire Place • 3 bedrooms

Rustic River 3
Entire Place • 1 bedroom

Rustic River 2
Entire Place • 1 bedroom
Note: Performance varies based on location, size, amenities, seasonality, and management quality. Data reflects the past 12 months.
Top Performing Airbnb Hosts in Savanna (2026)
Learn from the best! This table showcases top-performing Airbnb hosts in Savanna based on the number of properties managed and estimated total revenue over the past year. Analyze their scale and performance metrics.
| Host Name | Properties | Grossing Revenue | Stay Reviews | Avg Rating |
|---|---|---|---|---|
| Rustic River | 9 | $108,669 | 1245 | 4.86/5.0 |
| Donavon | 3 | $46,485 | 185 | 4.97/5.0 |
| Bruce Allen | 1 | $38,705 | 177 | 4.99/5.0 |
| Bekah | 1 | $37,831 | 353 | 4.97/5.0 |
| Lyubov | 4 | $37,040 | 210 | 4.67/5.0 |
| Javier | 1 | $35,235 | 96 | 4.96/5.0 |
| Shontrell | 1 | $33,472 | 34 | 4.79/5.0 |
| Natasha | 4 | $23,620 | 39 | 4.92/5.0 |
| Howard | 1 | $19,907 | 73 | 4.90/5.0 |
| Shanna | 2 | $19,627 | 168 | 4.93/5.0 |
Analyzing the strategies of top hosts, such as their property selection, pricing, and guest communication, can offer valuable lessons for optimizing your own Airbnb operations in Savanna.
Dive Deeper: Advanced Savanna STR Market Data (2026)
Ready to unlock more insights? AirROI provides access to advanced metrics and comprehensive Airbnb data for Savanna. Explore detailed analytics beyond this report to refine your investment strategy, optimize pricing, and maximize your vacation rental profits.
Explore Advanced MetricsSavanna Short-Term Rental Market Composition (2026): Property & Room Types
Room Type Distribution
Property Type Distribution
Market Composition Insights for Savanna
- The Savanna Airbnb market composition is heavily skewed towards Entire Home/Apt listings, which make up 91.4% of the 35 active rentals. This indicates strong guest preference for privacy and space.
- Looking at the property type distribution in Savanna, Outdoor/Unique properties are the most common (40%), reflecting the local real estate landscape.
- Houses represent a significant 28.6% portion, catering likely to families or larger groups.
- The presence of 5.7% Hotel/Boutique listings indicates integration with traditional hospitality.
- Smaller segments like others (combined 2.9%) offer potential for unique stay experiences.
Savanna Airbnb Room Capacity Analysis (2026): Bedroom Distribution
Distribution of Listings by Number of Bedrooms
Room Capacity Insights for Savanna
- The dominant room capacity in Savanna is 1 bedroom listings, making up 71.4% of the market. This suggests a strong demand for properties suitable for couples or solo travelers.
- Together, 1 bedroom and 3 bedrooms properties represent 85.7% of the active Airbnb listings in Savanna, indicating a high concentration in these sizes.
- With over half the market (71.4%) consisting of studios or 1-bedroom units, Savanna is particularly well-suited for individuals or couples.
Savanna Vacation Rental Guest Capacity Trends (2026)
Distribution of Listings by Guest Capacity
Guest Capacity Insights for Savanna
- The most common guest capacity trend in Savanna vacation rentals is listings accommodating 6 guests (37.1%). This suggests the primary traveler segment is likely larger groups.
- Properties designed for 6 guests and 4 guests dominate the Savanna STR market, accounting for 68.5% of listings.
- 42.9% of properties accommodate 6+ guests, serving the market segment for larger families or group travel in Savanna.
- On average, properties in Savanna are equipped to host 4.6 guests.
Savanna Airbnb Booking Patterns (2026): Available vs. Booked Days
Available Days Distribution
Booked Days Distribution
Booking Pattern Insights for Savanna
- The most common availability pattern in Savanna falls within the 271-366 days range, representing 60% of listings. This suggests many properties have significant open periods on their calendars.
- Approximately 91.4% of listings show high availability (181+ days open annually), indicating potential for increased bookings or specific owner usage patterns.
- For booked days, the 31-90 days range is most frequent in Savanna (45.7%), reflecting common guest stay durations or potential owner blocking patterns.
- A notable 8.6% of properties secure long booking periods (181+ days booked per year), highlighting successful long-term rental strategies or significant owner usage.
Savanna Airbnb Minimum Stay Requirements Analysis
Distribution of Listings by Minimum Night Requirement
1 Night
27 listings
77.1% of total
2 Nights
3 listings
8.6% of total
30+ Nights
5 listings
14.3% of total
Key Insights
- The most prevalent minimum stay requirement in Savanna is 1 Night, adopted by 77.1% of listings. This highlights the market's preference for shorter, flexible bookings.
- A strong majority (85.7%) of the Savanna Airbnb data shows acceptance of very short stays (1-2 nights), indicating a dynamic, high-turnover market.
- A significant segment (14.3%) caters to monthly stays (30+ nights) in Savanna, pointing to opportunities in the extended-stay market.
Recommendations
- Align with the market by considering a 1 Night minimum stay, as 77.1% of Savanna hosts use this setting.
- Explore offering discounts for stays of 30+ nights to attract the 14.3% of the market seeking extended stays.
- Adjust minimum nights based on seasonality – potentially shorter during low season and longer during peak demand periods in Savanna.
Savanna Airbnb Cancellation Policy Trends Analysis (2026)
Limited
1 listings
2.9% of total
Flexible
4 listings
11.4% of total
Moderate
10 listings
28.6% of total
Firm
17 listings
48.6% of total
Strict
3 listings
8.6% of total
Cancellation Policy Insights for Savanna
- The prevailing Airbnb cancellation policy trend in Savanna is Firm, used by 48.6% of listings.
- A majority (57.2%) of hosts in Savanna utilize Firm or Strict policies, indicating a market where hosts prioritize booking security.
- Strict cancellation policies are quite rare (8.6%), potentially making listings with this policy less competitive unless justified by high demand or property type.
Recommendations for Hosts
- Consider adopting a Firm policy to align with the 48.6% market standard in Savanna.
- Using a Strict policy might deter some guests, as only 8.6% of listings use it. Evaluate if potential revenue protection outweighs possible lower booking rates.
- Regularly review your cancellation policy against competitors and market demand shifts in Savanna.
Savanna STR Booking Lead Time Analysis (2026)
Average Booking Lead Time by Month
Booking Lead Time Insights for Savanna
- The overall average booking lead time for vacation rentals in Savanna is 38 days.
- Guests book furthest in advance for stays during June (average 59 days), likely coinciding with peak travel demand or local events.
- The shortest booking windows occur for stays in January (average 13 days), indicating more last-minute travel plans during this time.
- Seasonally, Summer (49 days avg.) sees the longest lead times, while Winter (23 days avg.) has the shortest, reflecting typical travel planning cycles.
Recommendations for Hosts
- Use the overall average lead time (38 days) as a baseline for your pricing and availability strategy in Savanna.
- For June stays, consider implementing length-of-stay discounts or slightly higher rates for bookings made less than 59 days out to capitalize on advance planning.
- During January, focus on last-minute booking availability and promotions, as guests book with very short notice (13 days avg.).
- Target marketing efforts for the Summer season well in advance (at least 49 days) to capture early planners.
- Monitor your own booking lead times against these Savanna averages to identify opportunities for dynamic pricing adjustments.
Popular & Essential Airbnb Amenities in Savanna (2026)
Amenity Prevalence
Amenity Insights for Savanna
- Essential amenities in Savanna that guests expect include: Heating, Smoke alarm, Air conditioning, Hot water. Lacking these (any) could significantly impact bookings.
- Popular amenities like Kitchen, Bed linens, Fire extinguisher are common but not universal. Offering these can provide a competitive edge.
Recommendations for Hosts
- Ensure your listing includes all essential amenities for Savanna: Heating, Smoke alarm, Air conditioning, Hot water.
- Consider adding popular differentiators like Kitchen or Bed linens to increase appeal.
- Highlight unique or less common amenities you offer (e.g., hot tub, dedicated workspace, EV charger) in your listing description and photos.
- Regularly check competitor amenities in Savanna to stay competitive.
Savanna Airbnb Guest Demographics & Profile Analysis (2026)
Guest Profile Summary for Savanna
- The typical guest profile for Airbnb in Savanna consists of primarily domestic travelers (98%), often arriving from nearby Chicago, typically belonging to the Post-2000s (Gen Z/Alpha) group (50%), primarily speaking English or Spanish.
- Domestic travelers account for 98.1% of guests.
- Key international markets include United States (98.1%) and Norway (0.5%).
- Top languages spoken are English (66.1%) followed by Spanish (15.7%).
- A significant demographic segment is the Post-2000s (Gen Z/Alpha) group, representing 50% of guests.
Recommendations for Hosts
- Target domestic marketing efforts towards travelers from Chicago and Cedar Rapids.
- Tailor amenities and listing descriptions to appeal to the dominant Post-2000s (Gen Z/Alpha) demographic (e.g., highlight fast WiFi, smart home features, local guides).
- Highlight unique local experiences or amenities relevant to the primary guest profile.
- Consider seasonal promotions aligned with peak travel times for key origin markets.
Nearby Short-Term Rental Market Comparison
How does the Savanna Airbnb market stack up against its neighbors? Compare key performance metrics like average monthly revenue, ADR, and occupancy rates in surrounding areas to understand the broader regional STR landscape.
| Market | Active Properties | Monthly Revenue | Daily Rate | Avg. Occupancy |
|---|---|---|---|---|
| Monona | 29 | $6,957 | $648.65 | 49% |
| Town of Germantown | 66 | $5,208 | $527.82 | 37% |
| Town of Marion | 47 | $4,817 | $364.51 | 43% |
| Town of Greenfield | 14 | $4,740 | $355.57 | 42% |
| East Galena Township | 43 | $4,168 | $345.11 | 40% |
| Town of Fulton | 17 | $4,144 | $346.09 | 44% |
| Town of Lyndon | 36 | $3,915 | $505.60 | 35% |
| Guilford Township | 288 | $3,843 | $368.50 | 35% |
| Fitchburg | 21 | $3,636 | $279.53 | 47% |
| Town of Freeman | 15 | $3,468 | $254.01 | 50% |