Rockford Airbnb Market Analysis 2026: Short Term Rental Data & Vacation Rental Statistics in Illinois, United States
Is Airbnb profitable in Rockford in 2026? Explore comprehensive Airbnb analytics for Rockford, Illinois, United States to uncover income potential. This 2026 STR market report for Rockford, based on AirROI data from February 2025 to January 2026, reveals key trends in the market of 211 active listings.
Whether you're considering an Airbnb investment in Rockford, optimizing your existing vacation rental, or exploring rental arbitrage opportunities, understanding the Rockford Airbnb data is crucial. Leveraging the low regulation environment is key to maximizing your short term rental income potential. Let's dive into the specifics.
Key Rockford Airbnb Performance Metrics Overview
Monthly Airbnb Revenue Variations & Income Potential in Rockford (2026)
Understanding the monthly revenue variations for Airbnb listings in Rockford is key to maximizing your short term rental income potential. Seasonality significantly impacts earnings. Our analysis, based on data from the past 12 months, shows that the peak revenue month for STRs in Rockford is typically July, while February often presents the lowest earnings, highlighting opportunities for strategic pricing adjustments during shoulder and low seasons. Explore the typical Airbnb income in Rockford across different performance tiers:
- Best-in-class properties (Top 10%) achieve $5,566+ monthly, often utilizing dynamic pricing and superior guest experiences.
- Strong performing properties (Top 25%) earn $2,920 or more, indicating effective management and desirable locations/amenities.
- Typical properties (Median) generate around $1,568 per month, representing the average market performance.
- Entry-level properties (Bottom 25%) see earnings around $746, often with potential for optimization.
Average Monthly Airbnb Earnings Trend in Rockford
Rockford Airbnb Occupancy Rate Trends (2026)
Maximize your bookings by understanding the Rockford STR occupancy trends. Seasonal demand shifts significantly influence how often properties are booked. Typically, Julysees the highest demand (peak season occupancy), while January experiences the lowest (low season). Effective strategies, like adjusting minimum stays or offering promotions, can boost occupancy during slower periods. Here's how different property tiers perform in Rockford:
- Best-in-class properties (Top 10%) achieve 81%+ occupancy, indicating high desirability and potentially optimized availability.
- Strong performing properties (Top 25%) maintain 66% or higher occupancy, suggesting good market fit and guest satisfaction.
- Typical properties (Median) have an occupancy rate around 44%.
- Entry-level properties (Bottom 25%) average 24% occupancy, potentially facing higher vacancy.
Average Monthly Occupancy Rate Trend in Rockford
Average Daily Rate (ADR) Airbnb Trends in Rockford (2026)
Effective short term rental pricing strategy in Rockford involves understanding monthly ADR fluctuations. The Average Daily Rate (ADR) for Airbnb in Rockford typically peaks in December and dips lowest during February. Leveraging Airbnb dynamic pricing tools or strategies based on this seasonality can significantly boost revenue. Here's a look at the typical nightly rates achieved:
- Best-in-class properties (Top 10%) command rates of $340+ per night, often due to premium features or locations.
- Strong performing properties (Top 25%) achieve nightly rates of $177 or more.
- Typical properties (Median) charge around $108 per night.
- Entry-level properties (Bottom 25%) earn around $60 per night.
Average Daily Rate (ADR) Trend by Month in Rockford
Get Live Rockford Market Intelligence 👇

Explore Real-time Analytics
Airbnb Seasonality Analysis & Trends in Rockford (2026)
Peak Season (July, August, June)
- Revenue averages $3,658 per month
- Occupancy rates average 53.5%
- Daily rates average $173
Shoulder Season
- Revenue averages $2,767 per month
- Occupancy maintains around 45.0%
- Daily rates hold near $176
Low Season (January, February, March)
- Revenue drops to average $2,273 per month
- Occupancy decreases to average 39.9%
- Daily rates adjust to average $161
Seasonality Insights for Rockford
- The Airbnb seasonality in Rockford shows moderate seasonality with distinct peak and low periods. While the sections above show seasonal averages, it's also insightful to look at the extremes:
- During the high season, the absolute peak month showcases Rockford's highest earning potential, with monthly revenues capable of climbing to $3,945, occupancy reaching a high of 55.4%, and ADRs peaking at $192.
- Conversely, the slowest single month of the year, typically falling within the low season, marks the market's lowest point. In this month, revenue might dip to $2,030, occupancy could drop to 32.7%, and ADRs may adjust down to $150.
- Understanding both the seasonal averages and these monthly peaks and troughs in revenue, occupancy, and ADR is crucial for maximizing your Airbnb profit potential in Rockford.
Seasonal Strategies for Maximizing Profit
- Peak Season: Maximize revenue through premium pricing and potentially longer minimum stays. Ensure high availability.
- Low Season: Offer competitive pricing, special promotions (e.g., extended stay discounts), and flexible cancellation policies. Target off-season travelers like remote workers or budget-conscious guests.
- Shoulder Seasons: Implement dynamic pricing that balances peak and low rates. Target weekend travelers or specific events. Offer slightly more flexible terms than peak season.
- Regularly analyze your own performance against these Rockford seasonality benchmarks and adjust your pricing and availability strategy accordingly.
Best Areas for Airbnb Investment in Rockford (2026)
Exploring the top neighborhoods for short-term rentals in Rockford? This section highlights key areas, outlining why they are attractive for hosts and guests, along with notable local attractions. Consider these locations based on your target guest profile and investment strategy.
| Neighborhood / Area | Why Host Here? (Target Guests & Appeal) | Key Attractions & Landmarks |
|---|---|---|
| Downtown Rockford | The heart of Rockford with proximity to restaurants, shops, and cultural attractions. Ideal for guests looking for convenience and urban amenities. | Burpee Museum of Natural History, Rockford City Market, The Coronado Performing Arts Center, Dinosaur Discovery Museum |
| Anderson Gardens | An oasis of tranquility in Rockford, known for its beautiful gardens and serene environment. Attracts tourists focused on relaxation and nature. | Anderson Japanese Gardens, Nicholas Conservatory & Gardens |
| Riverside Boulevard Area | Great residential neighborhood with access to parks and the Rock River, suitable for families and nature lovers looking for a peaceful retreat. | Rock River, Riverside Park, Ski Bronco, Rock Valley College |
| Swedish Historic District | Rich in history with beautiful architecture, this area attracts travelers interested in cultural heritage and local events. | Swedish Historical Society, The BMO Harris Bank Center, Dawson Lake |
| East State Street | A commercial hub with many shopping options and restaurants, appealing for guests looking for variety and convenience. | CherryVale Mall, Rockford Art Museum |
| West Side Neighborhood | A vibrant community area with local shops, eateries, and parks, suitable for guests wanting an authentic local experience. | Magic Waters Waterpark, Eagle Point Park, Klehm Arboretum & Botanic Garden |
| Loves Park | A suburban area with access to parks, suitable for families and those looking for a quieter setting near Rockford amenities. | Loves Park Sports Complex, Rock Cut State Park |
| Perryville Corridor | An area with many dining options and entertainment venues, perfect for guests wanting a lively atmosphere. | Star Cinema, Chrysler Village Shopping Center |
Understanding Airbnb License Requirements & STR Laws in Rockford (2026)
While Rockford, Illinois, United States currently shows low STR regulations, specific Airbnb license requirements might still exist or change. Always verify the latest short term rental regulations and Airbnb license requirements directly with local government authorities for Rockford to ensure full compliance before hosting.
(Source: AirROI data, 2026, based on 0% licensed listings)
Top Performing Airbnb Properties in Rockford (2026)
Benchmark your potential! Explore examples of top-performing Airbnb properties in Rockfordbased on Trailing Twelve Month (TTM) revenue. Analyze their characteristics, revenue, occupancy rate, and ADR to understand what drives success in this market.
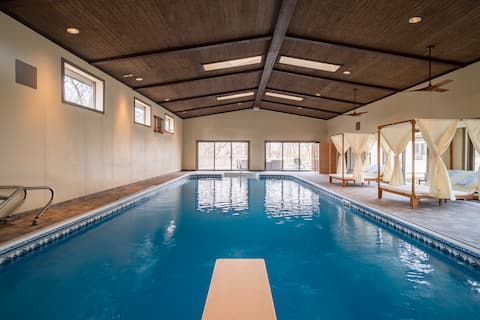
Cerro Vista Estate/Indoor Pool/Hot Tub/Game Room
Entire Place • 6 bedrooms
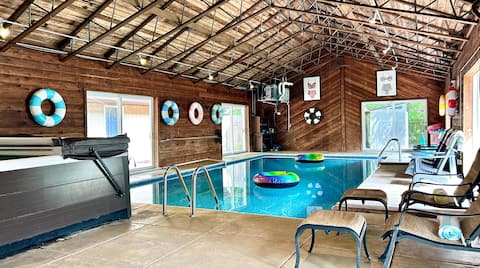
Entertainment Oasis Indoor Pool Spa Arcade Theatre
Entire Place • 5 bedrooms
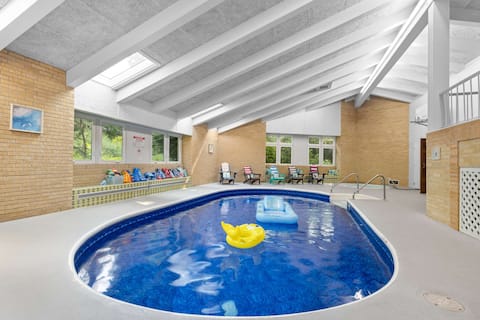
Rockford Retro Revival • Indoor Pool + Arcade Fun!
Entire Place • 5 bedrooms
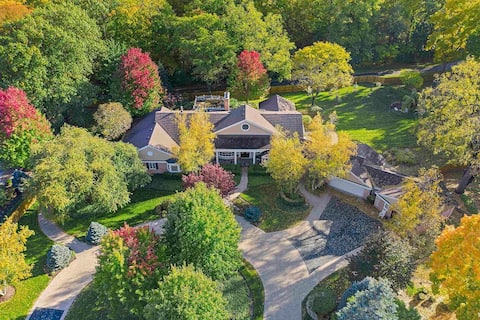
Mulford Complex Private Estate • Spa & Pool
Entire Place • 9 bedrooms

Wembley Estate | Indoor Pool • Hot Tub • Golf Sim
Entire Place • 6 bedrooms
Hot Tub|GameRoom|Theater|Gym|Lake Views
Entire Place • 6 bedrooms
Note: Performance varies based on location, size, amenities, seasonality, and management quality. Data reflects the past 12 months.
Top Performing Airbnb Hosts in Rockford (2026)
Learn from the best! This table showcases top-performing Airbnb hosts in Rockford based on the number of properties managed and estimated total revenue over the past year. Analyze their scale and performance metrics.
| Host Name | Properties | Grossing Revenue | Stay Reviews | Avg Rating |
|---|---|---|---|---|
| Felicia | 6 | $954,543 | 448 | 5.00/5.0 |
| Thomas | 1 | $374,493 | 109 | 4.98/5.0 |
| Devin | 1 | $197,377 | 50 | 4.94/5.0 |
| Stephanie | 1 | $161,568 | 65 | 4.89/5.0 |
| Nezmed | 18 | $140,079 | 370 | 4.64/5.0 |
| Brandi | 1 | $124,134 | 81 | 4.93/5.0 |
| Staci | 1 | $118,906 | 65 | 5.00/5.0 |
| Ron | 2 | $111,106 | 158 | 4.95/5.0 |
| Saul | 7 | $103,255 | 103 | 4.75/5.0 |
| Toni | 6 | $101,031 | 53 | 4.86/5.0 |
Analyzing the strategies of top hosts, such as their property selection, pricing, and guest communication, can offer valuable lessons for optimizing your own Airbnb operations in Rockford.
Dive Deeper: Advanced Rockford STR Market Data (2026)
Ready to unlock more insights? AirROI provides access to advanced metrics and comprehensive Airbnb data for Rockford. Explore detailed analytics beyond this report to refine your investment strategy, optimize pricing, and maximize your vacation rental profits.
Explore Advanced MetricsRockford Short-Term Rental Market Composition (2026): Property & Room Types
Room Type Distribution
Property Type Distribution
Market Composition Insights for Rockford
- The Rockford Airbnb market composition is heavily skewed towards Entire Home/Apt listings, which make up 91.9% of the 211 active rentals. This indicates strong guest preference for privacy and space.
- Looking at the property type distribution in Rockford, House properties are the most common (54.5%), reflecting the local real estate landscape.
- Houses represent a significant 54.5% portion, catering likely to families or larger groups.
- Smaller segments like others, hotel/boutique, outdoor/unique, unique stays (combined 4.2%) offer potential for unique stay experiences.
Rockford Airbnb Room Capacity Analysis (2026): Bedroom Distribution
Distribution of Listings by Number of Bedrooms
Room Capacity Insights for Rockford
- The dominant room capacity in Rockford is 1 bedroom listings, making up 35.5% of the market. This suggests a strong demand for properties suitable for couples or solo travelers.
- Together, 1 bedroom and 2 bedrooms properties represent 61.6% of the active Airbnb listings in Rockford, indicating a high concentration in these sizes.
- A significant 30.3% of listings offer 3+ bedrooms, catering to larger groups and families seeking more space in Rockford.
Rockford Vacation Rental Guest Capacity Trends (2026)
Distribution of Listings by Guest Capacity
Guest Capacity Insights for Rockford
- The most common guest capacity trend in Rockford vacation rentals is listings accommodating 2 guests (26.5%). This suggests the primary traveler segment is likely couples or solo travelers.
- Properties designed for 2 guests and 4 guests dominate the Rockford STR market, accounting for 50.2% of listings.
- 33.6% of properties accommodate 6+ guests, serving the market segment for larger families or group travel in Rockford.
- On average, properties in Rockford are equipped to host 4.3 guests.
Rockford Airbnb Booking Patterns (2026): Available vs. Booked Days
Available Days Distribution
Booked Days Distribution
Booking Pattern Insights for Rockford
- The most common availability pattern in Rockford falls within the 271-366 days range, representing 39.3% of listings. This suggests many properties have significant open periods on their calendars.
- Approximately 77.7% of listings show high availability (181+ days open annually), indicating potential for increased bookings or specific owner usage patterns.
- For booked days, the 91-180 days range is most frequent in Rockford (38.9%), reflecting common guest stay durations or potential owner blocking patterns.
- A notable 23.2% of properties secure long booking periods (181+ days booked per year), highlighting successful long-term rental strategies or significant owner usage.
Rockford Airbnb Minimum Stay Requirements Analysis
Distribution of Listings by Minimum Night Requirement
1 Night
42 listings
19.9% of total
2 Nights
39 listings
18.5% of total
3 Nights
16 listings
7.6% of total
4-6 Nights
22 listings
10.4% of total
7-29 Nights
41 listings
19.4% of total
30+ Nights
51 listings
24.2% of total
Key Insights
- The most prevalent minimum stay requirement in Rockford is 30+ Nights, adopted by 24.2% of listings. This highlights the market's preference for longer commitments.
- A significant segment (24.2%) caters to monthly stays (30+ nights) in Rockford, pointing to opportunities in the extended-stay market.
Recommendations
- Align with the market by considering a 30+ Nights minimum stay, as 24.2% of Rockford hosts use this setting.
- If feasible, allowing 1-night stays, especially midweek or during low season, could capture last-minute bookings, as only 19.9% currently do.
- Explore offering discounts for stays of 30+ nights to attract the 24.2% of the market seeking extended stays.
- Adjust minimum nights based on seasonality – potentially shorter during low season and longer during peak demand periods in Rockford.
Rockford Airbnb Cancellation Policy Trends Analysis (2026)
Super Strict 30 Days
4 listings
1.9% of total
Limited
1 listings
0.5% of total
Flexible
69 listings
32.7% of total
Moderate
58 listings
27.5% of total
Firm
41 listings
19.4% of total
Strict
38 listings
18% of total
Cancellation Policy Insights for Rockford
- The prevailing Airbnb cancellation policy trend in Rockford is Flexible, used by 32.7% of listings.
- There's a relatively balanced mix between guest-friendly (60.2%) and stricter (37.4%) policies, offering choices for different guest needs.
Recommendations for Hosts
- Consider adopting a Flexible policy to align with the 32.7% market standard in Rockford.
- Regularly review your cancellation policy against competitors and market demand shifts in Rockford.
Rockford STR Booking Lead Time Analysis (2026)
Average Booking Lead Time by Month
Booking Lead Time Insights for Rockford
- The overall average booking lead time for vacation rentals in Rockford is 29 days.
- Guests book furthest in advance for stays during June (average 80 days), likely coinciding with peak travel demand or local events.
- The shortest booking windows occur for stays in February (average 16 days), indicating more last-minute travel plans during this time.
- Seasonally, Summer (52 days avg.) sees the longest lead times, while Winter (21 days avg.) has the shortest, reflecting typical travel planning cycles.
Recommendations for Hosts
- Use the overall average lead time (29 days) as a baseline for your pricing and availability strategy in Rockford.
- For June stays, consider implementing length-of-stay discounts or slightly higher rates for bookings made less than 80 days out to capitalize on advance planning.
- Target marketing efforts for the Summer season well in advance (at least 52 days) to capture early planners.
- Monitor your own booking lead times against these Rockford averages to identify opportunities for dynamic pricing adjustments.
Popular & Essential Airbnb Amenities in Rockford (2026)
Amenity Prevalence
Amenity Insights for Rockford
- Essential amenities in Rockford that guests expect include: Wifi, Smoke alarm, Air conditioning, Carbon monoxide alarm, TV, Heating, Hot water. Lacking these (any) could significantly impact bookings.
- Popular amenities like Dishes and silverware, Kitchen, Cooking basics are common but not universal. Offering these can provide a competitive edge.
Recommendations for Hosts
- Ensure your listing includes all essential amenities for Rockford: Wifi, Smoke alarm, Air conditioning, Carbon monoxide alarm, TV, Heating, Hot water.
- Prioritize adding missing essentials: Wifi, Smoke alarm, Air conditioning, Carbon monoxide alarm, TV, Heating, Hot water.
- Consider adding popular differentiators like Dishes and silverware or Kitchen to increase appeal.
- Highlight unique or less common amenities you offer (e.g., hot tub, dedicated workspace, EV charger) in your listing description and photos.
- Regularly check competitor amenities in Rockford to stay competitive.
Rockford Airbnb Guest Demographics & Profile Analysis (2026)
Guest Profile Summary for Rockford
- The typical guest profile for Airbnb in Rockford consists of primarily domestic travelers (96%), often arriving from nearby Chicago, typically belonging to the Post-2000s (Gen Z/Alpha) group (50%), primarily speaking English or Spanish.
- Domestic travelers account for 95.8% of guests.
- Key international markets include United States (95.8%) and Canada (0.5%).
- Top languages spoken are English (70.2%) followed by Spanish (16.8%).
- A significant demographic segment is the Post-2000s (Gen Z/Alpha) group, representing 50% of guests.
Recommendations for Hosts
- Target domestic marketing efforts towards travelers from Chicago and Rockford.
- Tailor amenities and listing descriptions to appeal to the dominant Post-2000s (Gen Z/Alpha) demographic (e.g., highlight fast WiFi, smart home features, local guides).
- Highlight unique local experiences or amenities relevant to the primary guest profile.
- Consider seasonal promotions aligned with peak travel times for key origin markets.
Nearby Short-Term Rental Market Comparison
How does the Rockford Airbnb market stack up against its neighbors? Compare key performance metrics like average monthly revenue, ADR, and occupancy rates in surrounding areas to understand the broader regional STR landscape.
| Market | Active Properties | Monthly Revenue | Daily Rate | Avg. Occupancy |
|---|---|---|---|---|
| Town of Sugar Creek | 18 | $9,830 | $662.90 | 53% |
| Monona | 29 | $6,957 | $648.65 | 49% |
| Twin Lakes | 35 | $6,152 | $547.54 | 43% |
| Town of Germantown | 66 | $5,208 | $527.82 | 37% |
| Lake Geneva | 209 | $5,014 | $473.36 | 41% |
| Town of Geneva | 63 | $5,012 | $448.89 | 43% |
| McHenry | 32 | $4,982 | $463.12 | 44% |
| Town of Marion | 47 | $4,817 | $364.51 | 43% |
| Town of Greenfield | 14 | $4,740 | $355.57 | 42% |
| City of Pewaukee | 11 | $4,657 | $510.14 | 44% |