Normal Airbnb Market Analysis 2026: Short Term Rental Data & Vacation Rental Statistics in Illinois, United States
Is Airbnb profitable in Normal in 2026? Explore comprehensive Airbnb analytics for Normal, Illinois, United States to uncover income potential. This 2026 STR market report for Normal, based on AirROI data from February 2025 to January 2026, reveals key trends in the niche market of 65 active listings.
Whether you're considering an Airbnb investment in Normal, optimizing your existing vacation rental, or exploring rental arbitrage opportunities, understanding the Normal Airbnb data is crucial. Leveraging the low regulation environment is key to maximizing your short term rental income potential. Let's dive into the specifics.
Key Normal Airbnb Performance Metrics Overview
Monthly Airbnb Revenue Variations & Income Potential in Normal (2026)
Understanding the monthly revenue variations for Airbnb listings in Normal is key to maximizing your short term rental income potential. Seasonality significantly impacts earnings. Our analysis, based on data from the past 12 months, shows that the peak revenue month for STRs in Normal is typically August, while February often presents the lowest earnings, highlighting opportunities for strategic pricing adjustments during shoulder and low seasons. Explore the typical Airbnb income in Normal across different performance tiers:
- Best-in-class properties (Top 10%) achieve $5,588+ monthly, often utilizing dynamic pricing and superior guest experiences.
- Strong performing properties (Top 25%) earn $4,005 or more, indicating effective management and desirable locations/amenities.
- Typical properties (Median) generate around $2,172 per month, representing the average market performance.
- Entry-level properties (Bottom 25%) see earnings around $1,121, often with potential for optimization.
Average Monthly Airbnb Earnings Trend in Normal
Normal Airbnb Occupancy Rate Trends (2026)
Maximize your bookings by understanding the Normal STR occupancy trends. Seasonal demand shifts significantly influence how often properties are booked. Typically, Augustsees the highest demand (peak season occupancy), while February experiences the lowest (low season). Effective strategies, like adjusting minimum stays or offering promotions, can boost occupancy during slower periods. Here's how different property tiers perform in Normal:
- Best-in-class properties (Top 10%) achieve 86%+ occupancy, indicating high desirability and potentially optimized availability.
- Strong performing properties (Top 25%) maintain 74% or higher occupancy, suggesting good market fit and guest satisfaction.
- Typical properties (Median) have an occupancy rate around 56%.
- Entry-level properties (Bottom 25%) average 32% occupancy, potentially facing higher vacancy.
Average Monthly Occupancy Rate Trend in Normal
Average Daily Rate (ADR) Airbnb Trends in Normal (2026)
Effective short term rental pricing strategy in Normal involves understanding monthly ADR fluctuations. The Average Daily Rate (ADR) for Airbnb in Normal typically peaks in December and dips lowest during February. Leveraging Airbnb dynamic pricing tools or strategies based on this seasonality can significantly boost revenue. Here's a look at the typical nightly rates achieved:
- Best-in-class properties (Top 10%) command rates of $251+ per night, often due to premium features or locations.
- Strong performing properties (Top 25%) achieve nightly rates of $193 or more.
- Typical properties (Median) charge around $133 per night.
- Entry-level properties (Bottom 25%) earn around $71 per night.
Average Daily Rate (ADR) Trend by Month in Normal
Get Live Normal Market Intelligence 👇

Explore Real-time Analytics
Airbnb Seasonality Analysis & Trends in Normal (2026)
Peak Season (August, September, October)
- Revenue averages $3,402 per month
- Occupancy rates average 62.5%
- Daily rates average $146
Shoulder Season
- Revenue averages $2,799 per month
- Occupancy maintains around 53.3%
- Daily rates hold near $144
Low Season (February, March, April)
- Revenue drops to average $1,895 per month
- Occupancy decreases to average 46.0%
- Daily rates adjust to average $129
Seasonality Insights for Normal
- The Airbnb seasonality in Normal shows moderate seasonality with distinct peak and low periods. While the sections above show seasonal averages, it's also insightful to look at the extremes:
- During the high season, the absolute peak month showcases Normal's highest earning potential, with monthly revenues capable of climbing to $3,493, occupancy reaching a high of 67.5%, and ADRs peaking at $148.
- Conversely, the slowest single month of the year, typically falling within the low season, marks the market's lowest point. In this month, revenue might dip to $1,645, occupancy could drop to 39.9%, and ADRs may adjust down to $128.
- Understanding both the seasonal averages and these monthly peaks and troughs in revenue, occupancy, and ADR is crucial for maximizing your Airbnb profit potential in Normal.
Seasonal Strategies for Maximizing Profit
- Peak Season: Maximize revenue through premium pricing and potentially longer minimum stays. Ensure high availability.
- Low Season: Offer competitive pricing, special promotions (e.g., extended stay discounts), and flexible cancellation policies. Target off-season travelers like remote workers or budget-conscious guests.
- Shoulder Seasons: Implement dynamic pricing that balances peak and low rates. Target weekend travelers or specific events. Offer slightly more flexible terms than peak season.
- Regularly analyze your own performance against these Normal seasonality benchmarks and adjust your pricing and availability strategy accordingly.
Best Areas for Airbnb Investment in Normal (2026)
Exploring the top neighborhoods for short-term rentals in Normal? This section highlights key areas, outlining why they are attractive for hosts and guests, along with notable local attractions. Consider these locations based on your target guest profile and investment strategy.
| Neighborhood / Area | Why Host Here? (Target Guests & Appeal) | Key Attractions & Landmarks |
|---|---|---|
| Downtown Normal | This area is the vibrant heart of Normal, featuring a mix of business and cultural attractions. Perfect for visitors attending events, exploring local shops, and enjoying dining options. | Illinois State University, Normal Theater, The Children's Discovery Museum, Downtown shops and restaurants, Constitution Trail |
| The Uptown District | Known for its historic buildings and vibrant community events, Uptown Normal offers a unique atmosphere with plenty of dining and entertainment options. | Uptown Circle, Bloomington-Normal Public Transit, local boutiques, restaurants and cafes, the Normal Community Ice Arena |
| White Oak Park | A suburban area that offers a peaceful environment with access to parks and outdoor activities. Ideal for families and those looking for a quieter stay. | White Oak Park, children's playgrounds, sports fields, nature trails |
| Eastland Mall | A commercial hub providing easy access to shopping, dining, and entertainment. Great for short-term stays for shoppers and families. | Eastland Mall, multiple dining options, nearby hotels and motels, easy access to major roads |
| Ponds at Sand Creek | A scenic residential community with peaceful pond views and walking trails. Suitable for visitors looking to relax in a tranquil setting. | Sand Creek Pond, nature trails, wildlife observation, proximity to local parks |
| Normal Community Park | Offers a variety of recreational activities and events throughout the year, attracting families and active visitors. | Normal Community Park, sports facilities, playground, picnic areas |
| Twin Cities | The combined area of Bloomington and Normal, it's a vibrant urban center with rich cultural offerings and a variety of venues. | David Davis Mansion, Miller Park Zoo, Bloomington Center for the Performing Arts, various local festivals |
| Illinois State University | The campus itself is a popular destination for events, graduations, and conferences, ideal for hosting visiting scholars and families. | campus tours, Redbird Arena, Braden Auditorium, museum of natural history |
Understanding Airbnb License Requirements & STR Laws in Normal (2026)
While Normal, Illinois, United States currently shows low STR regulations, specific Airbnb license requirements might still exist or change. Always verify the latest short term rental regulations and Airbnb license requirements directly with local government authorities for Normal to ensure full compliance before hosting.
(Source: AirROI data, 2026, finding no licensed listings among those analyzed)
Top Performing Airbnb Properties in Normal (2026)
Benchmark your potential! Explore examples of top-performing Airbnb properties in Normalbased on Trailing Twelve Month (TTM) revenue. Analyze their characteristics, revenue, occupancy rate, and ADR to understand what drives success in this market.
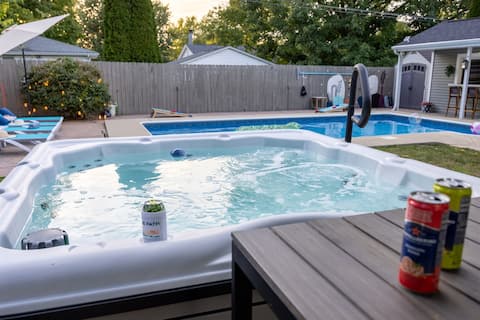
Central Location | Hot Tub | Digital Game Table
Entire Place • 2 bedrooms

Stylish Vacation Rental - Walk to ISU!
Entire Place • 3 bedrooms

Time Traveler - 3BR, hot tub - Near Rivian
Entire Place • 3 bedrooms

Cozy Home with LOTS of space -1 mile to ISU & IWU
Entire Place • 4 bedrooms
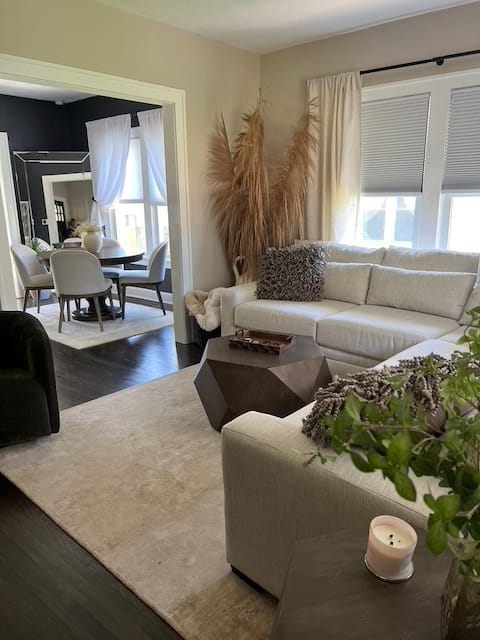
Timeless Charming Modern Home!
Entire Place • 4 bedrooms

Retro Retreat, Games, Firepit, 3BR, Location!
Entire Place • 3 bedrooms
Note: Performance varies based on location, size, amenities, seasonality, and management quality. Data reflects the past 12 months.
Top Performing Airbnb Hosts in Normal (2026)
Learn from the best! This table showcases top-performing Airbnb hosts in Normal based on the number of properties managed and estimated total revenue over the past year. Analyze their scale and performance metrics.
| Host Name | Properties | Grossing Revenue | Stay Reviews | Avg Rating |
|---|---|---|---|---|
| Tejas | 5 | $129,245 | 29 | 4.97/5.0 |
| Evolve | 3 | $129,024 | 78 | 4.73/5.0 |
| Andy & Marie | 2 | $122,635 | 247 | 4.94/5.0 |
| Donna | 2 | $119,978 | 384 | 4.89/5.0 |
| Alejandro | 8 | $110,890 | 390 | 4.83/5.0 |
| Vesta Real Estate | 9 | $95,399 | 87 | 4.58/5.0 |
| Kimberly | 1 | $82,698 | 68 | 5.00/5.0 |
| Amy | 2 | $75,981 | 296 | 4.99/5.0 |
| Lacey Shirk | 1 | $54,393 | 212 | 4.97/5.0 |
| Ryan | 1 | $52,860 | 34 | 4.94/5.0 |
Analyzing the strategies of top hosts, such as their property selection, pricing, and guest communication, can offer valuable lessons for optimizing your own Airbnb operations in Normal.
Dive Deeper: Advanced Normal STR Market Data (2026)
Ready to unlock more insights? AirROI provides access to advanced metrics and comprehensive Airbnb data for Normal. Explore detailed analytics beyond this report to refine your investment strategy, optimize pricing, and maximize your vacation rental profits.
Explore Advanced MetricsNormal Short-Term Rental Market Composition (2026): Property & Room Types
Room Type Distribution
Property Type Distribution
Market Composition Insights for Normal
- The Normal Airbnb market composition is heavily skewed towards Entire Home/Apt listings, which make up 87.7% of the 65 active rentals. This indicates strong guest preference for privacy and space.
- Looking at the property type distribution in Normal, House properties are the most common (61.5%), reflecting the local real estate landscape.
- Houses represent a significant 61.5% portion, catering likely to families or larger groups.
- Smaller segments like outdoor/unique, unique stays (combined 6.1%) offer potential for unique stay experiences.
Normal Airbnb Room Capacity Analysis (2026): Bedroom Distribution
Distribution of Listings by Number of Bedrooms
Room Capacity Insights for Normal
- The dominant room capacity in Normal is 3 bedrooms listings, making up 32.3% of the market. This suggests a strong demand for properties suitable for families or small groups.
- Together, 3 bedrooms and 2 bedrooms properties represent 56.9% of the active Airbnb listings in Normal, indicating a high concentration in these sizes.
- A significant 43.1% of listings offer 3+ bedrooms, catering to larger groups and families seeking more space in Normal.
Normal Vacation Rental Guest Capacity Trends (2026)
Distribution of Listings by Guest Capacity
Guest Capacity Insights for Normal
- The most common guest capacity trend in Normal vacation rentals is listings accommodating 8+ guests (20%). This suggests the primary traveler segment is likely larger groups.
- Properties designed for 8+ guests and 2 guests dominate the Normal STR market, accounting for 38.5% of listings.
- 46.2% of properties accommodate 6+ guests, serving the market segment for larger families or group travel in Normal.
- On average, properties in Normal are equipped to host 4.5 guests.
Normal Airbnb Booking Patterns (2026): Available vs. Booked Days
Available Days Distribution
Booked Days Distribution
Booking Pattern Insights for Normal
- The most common availability pattern in Normal falls within the 91-180 days range, representing 38.5% of listings. This suggests many properties have significant open periods on their calendars.
- Approximately 55.4% of listings show high availability (181+ days open annually), indicating potential for increased bookings or specific owner usage patterns.
- For booked days, the 181-270 days range is most frequent in Normal (38.5%), reflecting common guest stay durations or potential owner blocking patterns.
- A notable 44.7% of properties secure long booking periods (181+ days booked per year), highlighting successful long-term rental strategies or significant owner usage.
Normal Airbnb Minimum Stay Requirements Analysis
Distribution of Listings by Minimum Night Requirement
1 Night
20 listings
30.8% of total
2 Nights
15 listings
23.1% of total
4-6 Nights
3 listings
4.6% of total
7-29 Nights
12 listings
18.5% of total
30+ Nights
15 listings
23.1% of total
Key Insights
- The most prevalent minimum stay requirement in Normal is 1 Night, adopted by 30.8% of listings. This highlights the market's preference for shorter, flexible bookings.
- A significant segment (23.1%) caters to monthly stays (30+ nights) in Normal, pointing to opportunities in the extended-stay market.
Recommendations
- Align with the market by considering a 1 Night minimum stay, as 30.8% of Normal hosts use this setting.
- Explore offering discounts for stays of 30+ nights to attract the 23.1% of the market seeking extended stays.
- Adjust minimum nights based on seasonality – potentially shorter during low season and longer during peak demand periods in Normal.
Normal Airbnb Cancellation Policy Trends Analysis (2026)
Super Strict 30 Days
3 listings
4.6% of total
Limited
1 listings
1.5% of total
Flexible
19 listings
29.2% of total
Moderate
13 listings
20% of total
Firm
14 listings
21.5% of total
Strict
15 listings
23.1% of total
Cancellation Policy Insights for Normal
- The prevailing Airbnb cancellation policy trend in Normal is Flexible, used by 29.2% of listings.
- There's a relatively balanced mix between guest-friendly (49.2%) and stricter (44.6%) policies, offering choices for different guest needs.
Recommendations for Hosts
- Consider adopting a Flexible policy to align with the 29.2% market standard in Normal.
- Regularly review your cancellation policy against competitors and market demand shifts in Normal.
Normal STR Booking Lead Time Analysis (2026)
Average Booking Lead Time by Month
Booking Lead Time Insights for Normal
- The overall average booking lead time for vacation rentals in Normal is 43 days.
- Guests book furthest in advance for stays during May (average 68 days), likely coinciding with peak travel demand or local events.
- The shortest booking windows occur for stays in March (average 23 days), indicating more last-minute travel plans during this time.
- Seasonally, Summer (51 days avg.) sees the longest lead times, while Winter (28 days avg.) has the shortest, reflecting typical travel planning cycles.
Recommendations for Hosts
- Use the overall average lead time (43 days) as a baseline for your pricing and availability strategy in Normal.
- For May stays, consider implementing length-of-stay discounts or slightly higher rates for bookings made less than 68 days out to capitalize on advance planning.
- Target marketing efforts for the Summer season well in advance (at least 51 days) to capture early planners.
- Monitor your own booking lead times against these Normal averages to identify opportunities for dynamic pricing adjustments.
Popular & Essential Airbnb Amenities in Normal (2026)
Amenity Prevalence
Amenity Insights for Normal
- Essential amenities in Normal that guests expect include: Air conditioning, Wifi, TV, Free parking on premises. Lacking these (any) could significantly impact bookings.
- Popular amenities like Smoke alarm, Carbon monoxide alarm, Kitchen are common but not universal. Offering these can provide a competitive edge.
Recommendations for Hosts
- Ensure your listing includes all essential amenities for Normal: Air conditioning, Wifi, TV, Free parking on premises.
- Prioritize adding missing essentials: Air conditioning, Wifi, TV, Free parking on premises.
- Consider adding popular differentiators like Smoke alarm or Carbon monoxide alarm to increase appeal.
- Highlight unique or less common amenities you offer (e.g., hot tub, dedicated workspace, EV charger) in your listing description and photos.
- Regularly check competitor amenities in Normal to stay competitive.
Normal Airbnb Guest Demographics & Profile Analysis (2026)
Guest Profile Summary for Normal
- The typical guest profile for Airbnb in Normal consists of primarily domestic travelers (96%), often arriving from nearby Chicago, typically belonging to the Post-2000s (Gen Z/Alpha) group (50%), primarily speaking English or Spanish.
- Domestic travelers account for 96.1% of guests.
- Key international markets include United States (96.1%) and Mexico (0.5%).
- Top languages spoken are English (77.1%) followed by Spanish (12.1%).
- A significant demographic segment is the Post-2000s (Gen Z/Alpha) group, representing 50% of guests.
Recommendations for Hosts
- Target domestic marketing efforts towards travelers from Chicago and Plano.
- Tailor amenities and listing descriptions to appeal to the dominant Post-2000s (Gen Z/Alpha) demographic (e.g., highlight fast WiFi, smart home features, local guides).
- Highlight unique local experiences or amenities relevant to the primary guest profile.
- Consider seasonal promotions aligned with peak travel times for key origin markets.
Nearby Short-Term Rental Market Comparison
How does the Normal Airbnb market stack up against its neighbors? Compare key performance metrics like average monthly revenue, ADR, and occupancy rates in surrounding areas to understand the broader regional STR landscape.
| Market | Active Properties | Monthly Revenue | Daily Rate | Avg. Occupancy |
|---|---|---|---|---|
| Elmhurst | 16 | $4,469 | $355.09 | 49% |
| Addison Township | 19 | $4,214 | $362.67 | 42% |
| Glen Ellyn | 21 | $3,911 | $294.70 | 48% |
| Geneva | 32 | $3,591 | $237.71 | 50% |
| Morris | 15 | $3,246 | $235.07 | 50% |
| Roselle | 12 | $3,238 | $211.87 | 56% |
| St. Charles Township | 19 | $3,233 | $281.50 | 42% |
| Marshall | 12 | $3,135 | $264.69 | 39% |
| Chicago | 5,870 | $3,100 | $248.82 | 48% |
| Effingham | 22 | $3,085 | $277.14 | 44% |