McHenry Airbnb Market Analysis 2026: Short Term Rental Data & Vacation Rental Statistics in Illinois, United States
Is Airbnb profitable in McHenry in 2026? Explore comprehensive Airbnb analytics for McHenry, Illinois, United States to uncover income potential. This 2026 STR market report for McHenry, based on AirROI data from February 2025 to January 2026, reveals key trends in the niche market of 32 active listings.
Whether you're considering an Airbnb investment in McHenry, optimizing your existing vacation rental, or exploring rental arbitrage opportunities, understanding the McHenry Airbnb data is crucial. Leveraging the low regulation environment is key to maximizing your short term rental income potential. Let's dive into the specifics.
Key McHenry Airbnb Performance Metrics Overview
Monthly Airbnb Revenue Variations & Income Potential in McHenry (2026)
Understanding the monthly revenue variations for Airbnb listings in McHenry is key to maximizing your short term rental income potential. Seasonality significantly impacts earnings. Our analysis, based on data from the past 12 months, shows that the peak revenue month for STRs in McHenry is typically July, while April often presents the lowest earnings, highlighting opportunities for strategic pricing adjustments during shoulder and low seasons. Explore the typical Airbnb income in McHenry across different performance tiers:
- Best-in-class properties (Top 10%) achieve $14,745+ monthly, often utilizing dynamic pricing and superior guest experiences.
- Strong performing properties (Top 25%) earn $7,784 or more, indicating effective management and desirable locations/amenities.
- Typical properties (Median) generate around $3,485 per month, representing the average market performance.
- Entry-level properties (Bottom 25%) see earnings around $2,267, often with potential for optimization.
Average Monthly Airbnb Earnings Trend in McHenry
McHenry Airbnb Occupancy Rate Trends (2026)
Maximize your bookings by understanding the McHenry STR occupancy trends. Seasonal demand shifts significantly influence how often properties are booked. Typically, Julysees the highest demand (peak season occupancy), while April experiences the lowest (low season). Effective strategies, like adjusting minimum stays or offering promotions, can boost occupancy during slower periods. Here's how different property tiers perform in McHenry:
- Best-in-class properties (Top 10%) achieve 77%+ occupancy, indicating high desirability and potentially optimized availability.
- Strong performing properties (Top 25%) maintain 62% or higher occupancy, suggesting good market fit and guest satisfaction.
- Typical properties (Median) have an occupancy rate around 42%.
- Entry-level properties (Bottom 25%) average 23% occupancy, potentially facing higher vacancy.
Average Monthly Occupancy Rate Trend in McHenry
Average Daily Rate (ADR) Airbnb Trends in McHenry (2026)
Effective short term rental pricing strategy in McHenry involves understanding monthly ADR fluctuations. The Average Daily Rate (ADR) for Airbnb in McHenry typically peaks in June and dips lowest during January. Leveraging Airbnb dynamic pricing tools or strategies based on this seasonality can significantly boost revenue. Here's a look at the typical nightly rates achieved:
- Best-in-class properties (Top 10%) command rates of $1,013+ per night, often due to premium features or locations.
- Strong performing properties (Top 25%) achieve nightly rates of $604 or more.
- Typical properties (Median) charge around $337 per night.
- Entry-level properties (Bottom 25%) earn around $208 per night.
Average Daily Rate (ADR) Trend by Month in McHenry
Get Live McHenry Market Intelligence 👇

Explore Real-time Analytics
Airbnb Seasonality Analysis & Trends in McHenry (2026)
Peak Season (July, August, June)
- Revenue averages $9,717 per month
- Occupancy rates average 59.7%
- Daily rates average $490
Shoulder Season
- Revenue averages $5,763 per month
- Occupancy maintains around 42.8%
- Daily rates hold near $434
Low Season (February, March, April)
- Revenue drops to average $3,681 per month
- Occupancy decreases to average 32.4%
- Daily rates adjust to average $415
Seasonality Insights for McHenry
- The Airbnb seasonality in McHenry shows highly seasonal trends requiring careful strategy. While the sections above show seasonal averages, it's also insightful to look at the extremes:
- During the high season, the absolute peak month showcases McHenry's highest earning potential, with monthly revenues capable of climbing to $11,294, occupancy reaching a high of 66.6%, and ADRs peaking at $497.
- Conversely, the slowest single month of the year, typically falling within the low season, marks the market's lowest point. In this month, revenue might dip to $3,249, occupancy could drop to 30.3%, and ADRs may adjust down to $396.
- Understanding both the seasonal averages and these monthly peaks and troughs in revenue, occupancy, and ADR is crucial for maximizing your Airbnb profit potential in McHenry.
Seasonal Strategies for Maximizing Profit
- Peak Season: Maximize revenue through premium pricing and potentially longer minimum stays. Ensure high availability.
- Low Season: Offer competitive pricing, special promotions (e.g., extended stay discounts), and flexible cancellation policies. Target off-season travelers like remote workers or budget-conscious guests.
- Shoulder Seasons: Implement dynamic pricing that balances peak and low rates. Target weekend travelers or specific events. Offer slightly more flexible terms than peak season.
- Regularly analyze your own performance against these McHenry seasonality benchmarks and adjust your pricing and availability strategy accordingly.
Best Areas for Airbnb Investment in McHenry (2026)
Exploring the top neighborhoods for short-term rentals in McHenry? This section highlights key areas, outlining why they are attractive for hosts and guests, along with notable local attractions. Consider these locations based on your target guest profile and investment strategy.
| Neighborhood / Area | Why Host Here? (Target Guests & Appeal) | Key Attractions & Landmarks |
|---|---|---|
| Downtown McHenry | The heart of the city, Downtown McHenry is vibrant with shops, restaurants, and the scenic riverwalk. It's a popular spot for visitors looking to explore local culture and events. | McHenry Riverwalk, McHenry Museum, Local eateries, Festivals and events in the plaza |
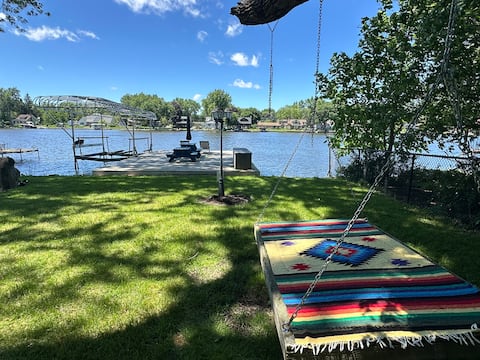
| McCullom Lake | A beautiful area known for its lakefront properties. Ideal for guests looking for a peaceful, nature-centric stay with access to fishing and boating. | McCullom Lake, Picnic areas, Fishing spots, Walking trails, Scenic views |
| Bull Valley | This area features large properties and a rural setting, attracting guests seeking tranquility and luxury. Great for retreats and family gatherings. | Bull Valley Golf Club, Nature trails, Community parks, Horse riding facilities |
| Fox River Grove | Located along the Fox River, this area is popular for its outdoor activities and natural beauty, making it perfect for outdoor enthusiasts. | Fox River, Bike trails, Parks, Kayaking and canoeing opportunities |
| Crystal Lake | A nearby city with a larger population and more amenities, making it an attractive spot for Airbnb hosting, especially for families and groups. | Crystal Lake Beach, Veterans Acres Park, Crystal Lake Historical Society, Shopping and dining options |
| Spring Grove | A quiet rural community with large lots and lakes, appealing to guests seeking peace and natural beauty. | Nippersink Lake, Spring Grove Forest Preserve, Horse trails, Community events |
| Lake in the Hills | Popular with families and travelers due to its recreational parks and lake, perfect for vacations and weekend getaways. | Lake in the Hills Airport, Parks and recreation, Fishing and boating, Family-friendly dining |
| Harvard | A small town with a charming downtown area, offering a quaint experience for visitors. Close to the rural areas and suitable for those wanting a getaway. | Harvard State Bank, Harvard Historical Society, Local shops, Outdoor events |
Understanding Airbnb License Requirements & STR Laws in McHenry (2026)
While McHenry, Illinois, United States currently shows low STR regulations, specific Airbnb license requirements might still exist or change. Always verify the latest short term rental regulations and Airbnb license requirements directly with local government authorities for McHenry to ensure full compliance before hosting.
(Source: AirROI data, 2026, finding no licensed listings among those analyzed)
Top Performing Airbnb Properties in McHenry (2026)
Benchmark your potential! Explore examples of top-performing Airbnb properties in McHenrybased on Trailing Twelve Month (TTM) revenue. Analyze their characteristics, revenue, occupancy rate, and ADR to understand what drives success in this market.
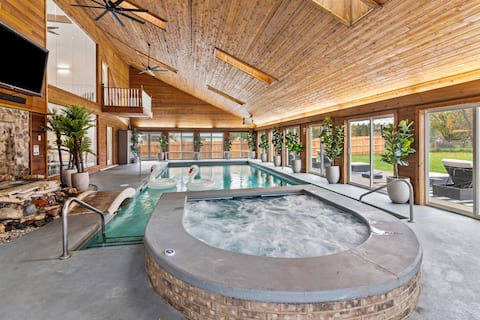
Highwood Haven/Indoor Pool/Hot Tub/Arcade
Entire Place • 5 bedrooms
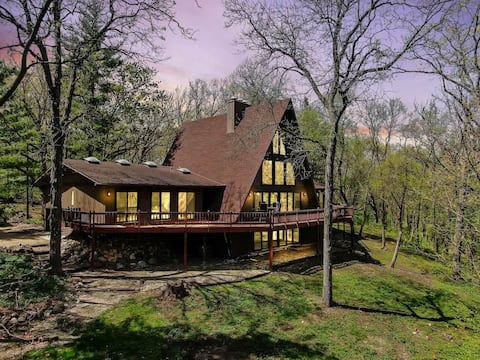
Private A-Frame - 5 Acres-Fishing Pond-Rock Wall
Entire Place • 7 bedrooms
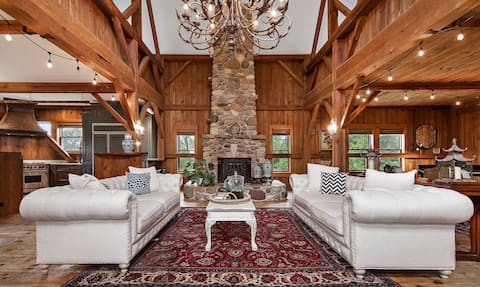
Upscale Barn Retreat: Hot Tub, Sauna, 14 Guests
Entire Place • 6 bedrooms

Fabulous Cabin
Entire Place • 4 bedrooms
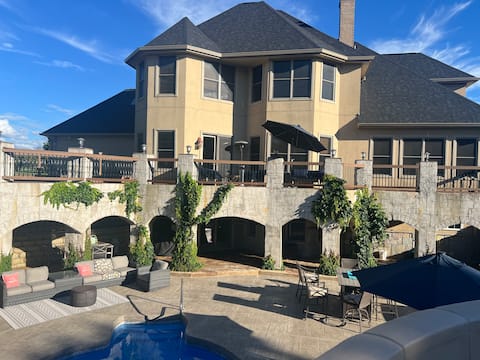
Paradiso Vacation
Entire Place • 6 bedrooms
Heart of the Fox Riverhouse
Entire Place • 3 bedrooms
Note: Performance varies based on location, size, amenities, seasonality, and management quality. Data reflects the past 12 months.
Top Performing Airbnb Hosts in McHenry (2026)
Learn from the best! This table showcases top-performing Airbnb hosts in McHenry based on the number of properties managed and estimated total revenue over the past year. Analyze their scale and performance metrics.
| Host Name | Properties | Grossing Revenue | Stay Reviews | Avg Rating |
|---|---|---|---|---|
| Thomas | 1 | $309,252 | 143 | 4.89/5.0 |
| Ryan | 2 | $252,519 | 115 | 4.84/5.0 |
| Melissa | 1 | $173,165 | 77 | 4.97/5.0 |
| Andriy | 1 | $121,860 | 35 | 4.91/5.0 |
| Denitza | 1 | $121,385 | 40 | 5.00/5.0 |
| Meghan | 1 | $119,813 | 78 | 4.91/5.0 |
| Savanie | 1 | $81,851 | 71 | 4.99/5.0 |
| Evolve | 1 | $57,530 | 12 | 4.83/5.0 |
| Heidi | 2 | $55,336 | 86 | 5.00/5.0 |
| Matt | 1 | $53,493 | 61 | 4.92/5.0 |
Analyzing the strategies of top hosts, such as their property selection, pricing, and guest communication, can offer valuable lessons for optimizing your own Airbnb operations in McHenry.
Dive Deeper: Advanced McHenry STR Market Data (2026)
Ready to unlock more insights? AirROI provides access to advanced metrics and comprehensive Airbnb data for McHenry. Explore detailed analytics beyond this report to refine your investment strategy, optimize pricing, and maximize your vacation rental profits.
Explore Advanced MetricsMcHenry Short-Term Rental Market Composition (2026): Property & Room Types
Room Type Distribution
Property Type Distribution
Market Composition Insights for McHenry
- The McHenry Airbnb market composition is heavily skewed towards Entire Home/Apt listings, which make up 96.9% of the 32 active rentals. This indicates strong guest preference for privacy and space.
- Looking at the property type distribution in McHenry, House properties are the most common (90.6%), reflecting the local real estate landscape.
- Houses represent a significant 90.6% portion, catering likely to families or larger groups.
- Smaller segments like hotel/boutique (combined 3.1%) offer potential for unique stay experiences.
McHenry Airbnb Room Capacity Analysis (2026): Bedroom Distribution
Distribution of Listings by Number of Bedrooms
Room Capacity Insights for McHenry
- The dominant room capacity in McHenry is 2 bedrooms listings, making up 31.3% of the market. This suggests a strong demand for properties suitable for couples or solo travelers.
- Together, 2 bedrooms and 3 bedrooms properties represent 56.3% of the active Airbnb listings in McHenry, indicating a high concentration in these sizes.
- A significant 62.5% of listings offer 3+ bedrooms, catering to larger groups and families seeking more space in McHenry.
McHenry Vacation Rental Guest Capacity Trends (2026)
Distribution of Listings by Guest Capacity
Guest Capacity Insights for McHenry
- The most common guest capacity trend in McHenry vacation rentals is listings accommodating 8+ guests (50%). This suggests the primary traveler segment is likely larger groups.
- Properties designed for 8+ guests and 4 guests dominate the McHenry STR market, accounting for 62.5% of listings.
- 71.9% of properties accommodate 6+ guests, serving the market segment for larger families or group travel in McHenry.
- On average, properties in McHenry are equipped to host 6.4 guests.
McHenry Airbnb Booking Patterns (2026): Available vs. Booked Days
Available Days Distribution
Booked Days Distribution
Booking Pattern Insights for McHenry
- The most common availability pattern in McHenry falls within the 181-270 days range, representing 40.6% of listings. This suggests many properties have significant open periods on their calendars.
- Approximately 75.0% of listings show high availability (181+ days open annually), indicating potential for increased bookings or specific owner usage patterns.
- For booked days, the 91-180 days range is most frequent in McHenry (43.8%), reflecting common guest stay durations or potential owner blocking patterns.
- A notable 25.1% of properties secure long booking periods (181+ days booked per year), highlighting successful long-term rental strategies or significant owner usage.
McHenry Airbnb Minimum Stay Requirements Analysis
Distribution of Listings by Minimum Night Requirement
1 Night
4 listings
12.5% of total
2 Nights
14 listings
43.8% of total
3 Nights
3 listings
9.4% of total
4-6 Nights
1 listings
3.1% of total
30+ Nights
10 listings
31.3% of total
Key Insights
- The most prevalent minimum stay requirement in McHenry is 2 Nights, adopted by 43.8% of listings. This highlights the market's preference for shorter, flexible bookings.
- A significant segment (31.3%) caters to monthly stays (30+ nights) in McHenry, pointing to opportunities in the extended-stay market.
Recommendations
- Align with the market by considering a 2 Nights minimum stay, as 43.8% of McHenry hosts use this setting.
- If feasible, allowing 1-night stays, especially midweek or during low season, could capture last-minute bookings, as only 12.5% currently do.
- A 2-night minimum appears standard (43.8%). Consider this for weekends or peak periods.
- Explore offering discounts for stays of 30+ nights to attract the 31.3% of the market seeking extended stays.
- Adjust minimum nights based on seasonality – potentially shorter during low season and longer during peak demand periods in McHenry.
McHenry Airbnb Cancellation Policy Trends Analysis (2026)
Super Strict 30 Days
1 listings
3.1% of total
Flexible
3 listings
9.4% of total
Moderate
11 listings
34.4% of total
Firm
14 listings
43.8% of total
Strict
3 listings
9.4% of total
Cancellation Policy Insights for McHenry
- The prevailing Airbnb cancellation policy trend in McHenry is Firm, used by 43.8% of listings.
- A majority (53.2%) of hosts in McHenry utilize Firm or Strict policies, indicating a market where hosts prioritize booking security.
- Strict cancellation policies are quite rare (9.4%), potentially making listings with this policy less competitive unless justified by high demand or property type.
Recommendations for Hosts
- Consider adopting a Firm policy to align with the 43.8% market standard in McHenry.
- Using a Strict policy might deter some guests, as only 9.4% of listings use it. Evaluate if potential revenue protection outweighs possible lower booking rates.
- Regularly review your cancellation policy against competitors and market demand shifts in McHenry.
McHenry STR Booking Lead Time Analysis (2026)
Average Booking Lead Time by Month
Booking Lead Time Insights for McHenry
- The overall average booking lead time for vacation rentals in McHenry is 49 days.
- Guests book furthest in advance for stays during July (average 75 days), likely coinciding with peak travel demand or local events.
- The shortest booking windows occur for stays in April (average 25 days), indicating more last-minute travel plans during this time.
- Seasonally, Summer (68 days avg.) sees the longest lead times, while Winter (35 days avg.) has the shortest, reflecting typical travel planning cycles.
Recommendations for Hosts
- Use the overall average lead time (49 days) as a baseline for your pricing and availability strategy in McHenry.
- For July stays, consider implementing length-of-stay discounts or slightly higher rates for bookings made less than 75 days out to capitalize on advance planning.
- Target marketing efforts for the Summer season well in advance (at least 68 days) to capture early planners.
- Monitor your own booking lead times against these McHenry averages to identify opportunities for dynamic pricing adjustments.
Popular & Essential Airbnb Amenities in McHenry (2026)
Amenity Prevalence
Amenity Insights for McHenry
- Essential amenities in McHenry that guests expect include: Kitchen, Air conditioning, Smoke alarm, Free parking on premises, TV, Wifi, Carbon monoxide alarm, Heating, Hot water, Dishes and silverware. Lacking these (any) could significantly impact bookings.
Recommendations for Hosts
- Ensure your listing includes all essential amenities for McHenry: Kitchen, Air conditioning, Smoke alarm, Free parking on premises, TV, Wifi, Carbon monoxide alarm, Heating, Hot water, Dishes and silverware.
- Prioritize adding missing essentials: Carbon monoxide alarm, Heating, Hot water, Dishes and silverware.
- Highlight unique or less common amenities you offer (e.g., hot tub, dedicated workspace, EV charger) in your listing description and photos.
- Regularly check competitor amenities in McHenry to stay competitive.
McHenry Airbnb Guest Demographics & Profile Analysis (2026)
Guest Profile Summary for McHenry
- The typical guest profile for Airbnb in McHenry consists of primarily domestic travelers (97%), often arriving from nearby Chicago, typically belonging to the Post-2000s (Gen Z/Alpha) group (50%), primarily speaking English or Spanish.
- Domestic travelers account for 97.1% of guests.
- Key international markets include United States (97.1%) and United Kingdom (1%).
- Top languages spoken are English (73.7%) followed by Spanish (10.2%).
- A significant demographic segment is the Post-2000s (Gen Z/Alpha) group, representing 50% of guests.
Recommendations for Hosts
- Target domestic marketing efforts towards travelers from Chicago and Milwaukee.
- Tailor amenities and listing descriptions to appeal to the dominant Post-2000s (Gen Z/Alpha) demographic (e.g., highlight fast WiFi, smart home features, local guides).
- Highlight unique local experiences or amenities relevant to the primary guest profile.
- Consider seasonal promotions aligned with peak travel times for key origin markets.
Nearby Short-Term Rental Market Comparison
How does the McHenry Airbnb market stack up against its neighbors? Compare key performance metrics like average monthly revenue, ADR, and occupancy rates in surrounding areas to understand the broader regional STR landscape.
| Market | Active Properties | Monthly Revenue | Daily Rate | Avg. Occupancy |
|---|---|---|---|---|
| Town of Sugar Creek | 18 | $9,830 | $662.90 | 53% |
| Monona | 29 | $6,957 | $648.65 | 49% |
| Twin Lakes | 35 | $6,152 | $547.55 | 43% |
| Lake Geneva | 209 | $5,014 | $473.36 | 41% |
| Town of Geneva | 63 | $5,012 | $448.89 | 43% |
| Town of Marion | 47 | $4,817 | $364.51 | 43% |
| Town of Greenfield | 14 | $4,740 | $355.57 | 42% |
| City of Pewaukee | 11 | $4,657 | $510.14 | 44% |
| Salem Lakes | 23 | $4,513 | $330.45 | 49% |
| Elmhurst | 16 | $4,469 | $355.09 | 49% |