Kankakee Airbnb Market Analysis 2026: Short Term Rental Data & Vacation Rental Statistics in Illinois, United States
Is Airbnb profitable in Kankakee in 2026? Explore comprehensive Airbnb analytics for Kankakee, Illinois, United States to uncover income potential. This 2026 STR market report for Kankakee, based on AirROI data from February 2025 to January 2026, reveals key trends in the niche market of 25 active listings.
Whether you're considering an Airbnb investment in Kankakee, optimizing your existing vacation rental, or exploring rental arbitrage opportunities, understanding the Kankakee Airbnb data is crucial. Leveraging the low regulation environment is key to maximizing your short term rental income potential. Let's dive into the specifics.
Key Kankakee Airbnb Performance Metrics Overview
Monthly Airbnb Revenue Variations & Income Potential in Kankakee (2026)
Understanding the monthly revenue variations for Airbnb listings in Kankakee is key to maximizing your short term rental income potential. Seasonality significantly impacts earnings. Our analysis, based on data from the past 12 months, shows that the peak revenue month for STRs in Kankakee is typically August, while February often presents the lowest earnings, highlighting opportunities for strategic pricing adjustments during shoulder and low seasons. Explore the typical Airbnb income in Kankakee across different performance tiers:
- Best-in-class properties (Top 10%) achieve $4,106+ monthly, often utilizing dynamic pricing and superior guest experiences.
- Strong performing properties (Top 25%) earn $2,893 or more, indicating effective management and desirable locations/amenities.
- Typical properties (Median) generate around $2,036 per month, representing the average market performance.
- Entry-level properties (Bottom 25%) see earnings around $1,103, often with potential for optimization.
Average Monthly Airbnb Earnings Trend in Kankakee
Kankakee Airbnb Occupancy Rate Trends (2026)
Maximize your bookings by understanding the Kankakee STR occupancy trends. Seasonal demand shifts significantly influence how often properties are booked. Typically, Aprilsees the highest demand (peak season occupancy), while November experiences the lowest (low season). Effective strategies, like adjusting minimum stays or offering promotions, can boost occupancy during slower periods. Here's how different property tiers perform in Kankakee:
- Best-in-class properties (Top 10%) achieve 78%+ occupancy, indicating high desirability and potentially optimized availability.
- Strong performing properties (Top 25%) maintain 66% or higher occupancy, suggesting good market fit and guest satisfaction.
- Typical properties (Median) have an occupancy rate around 50%.
- Entry-level properties (Bottom 25%) average 33% occupancy, potentially facing higher vacancy.
Average Monthly Occupancy Rate Trend in Kankakee
Average Daily Rate (ADR) Airbnb Trends in Kankakee (2026)
Effective short term rental pricing strategy in Kankakee involves understanding monthly ADR fluctuations. The Average Daily Rate (ADR) for Airbnb in Kankakee typically peaks in October and dips lowest during February. Leveraging Airbnb dynamic pricing tools or strategies based on this seasonality can significantly boost revenue. Here's a look at the typical nightly rates achieved:
- Best-in-class properties (Top 10%) command rates of $298+ per night, often due to premium features or locations.
- Strong performing properties (Top 25%) achieve nightly rates of $222 or more.
- Typical properties (Median) charge around $144 per night.
- Entry-level properties (Bottom 25%) earn around $107 per night.
Average Daily Rate (ADR) Trend by Month in Kankakee
Get Live Kankakee Market Intelligence 👇
Explore Real-time Analytics
Airbnb Seasonality Analysis & Trends in Kankakee (2026)
Peak Season (August, December, April)
- Revenue averages $2,941 per month
- Occupancy rates average 55.4%
- Daily rates average $174
Shoulder Season
- Revenue averages $2,427 per month
- Occupancy maintains around 49.2%
- Daily rates hold near $173
Low Season (January, February, November)
- Revenue drops to average $1,588 per month
- Occupancy decreases to average 42.6%
- Daily rates adjust to average $170
Seasonality Insights for Kankakee
- The Airbnb seasonality in Kankakee shows moderate seasonality with distinct peak and low periods. While the sections above show seasonal averages, it's also insightful to look at the extremes:
- During the high season, the absolute peak month showcases Kankakee's highest earning potential, with monthly revenues capable of climbing to $2,959, occupancy reaching a high of 60.3%, and ADRs peaking at $187.
- Conversely, the slowest single month of the year, typically falling within the low season, marks the market's lowest point. In this month, revenue might dip to $1,374, occupancy could drop to 39.5%, and ADRs may adjust down to $150.
- Understanding both the seasonal averages and these monthly peaks and troughs in revenue, occupancy, and ADR is crucial for maximizing your Airbnb profit potential in Kankakee.
Seasonal Strategies for Maximizing Profit
- Peak Season: Maximize revenue through premium pricing and potentially longer minimum stays. Ensure high availability.
- Low Season: Offer competitive pricing, special promotions (e.g., extended stay discounts), and flexible cancellation policies. Target off-season travelers like remote workers or budget-conscious guests.
- Shoulder Seasons: Implement dynamic pricing that balances peak and low rates. Target weekend travelers or specific events. Offer slightly more flexible terms than peak season.
- Regularly analyze your own performance against these Kankakee seasonality benchmarks and adjust your pricing and availability strategy accordingly.
Best Areas for Airbnb Investment in Kankakee (2026)
Exploring the top neighborhoods for short-term rentals in Kankakee? This section highlights key areas, outlining why they are attractive for hosts and guests, along with notable local attractions. Consider these locations based on your target guest profile and investment strategy.
| Neighborhood / Area | Why Host Here? (Target Guests & Appeal) | Key Attractions & Landmarks |
|---|---|---|
| Downtown Kankakee | The heart of Kankakee, featuring local shops, restaurants, and easy access to the riverfront. Attracts visitors looking for convenience and local culture. | Kankakee Riverwalk, Kankakee County Museum, Plaza Park, Riverfront Promenade |
| Kankakee River State Park | A natural oasis with outdoor activities such as hiking, fishing, and camping. Popular with nature lovers and families looking for a weekend getaway. | Hiking trails, Fishing spots, Picnic areas, Camping sites |
| The Historic District | A charming neighborhood with beautiful old homes and historic architecture. Attracts visitors interested in history and architecture. | Kankakee Historic District, The Kankakee County Courthouse, Old Court House Museum |
| Riverside Park | A scenic park area that offers recreational activities and festivals. Great for families and outdoor enthusiasts. | Playgrounds, Walking trails, The annual Kankakee River Festival |
| Kankakee Community College Area | A vibrant area known for its educational institutions, attracting students and short-term visitors to the college. | Kankakee Community College, Campus events, Student art shows |
| The South Side | Known for its diverse community and local eateries. Appeals to those looking for authentic local experiences and comfort food options. | Local diners, Cultural festivals, Community events |
| North Kankakee | A growing residential area with family-friendly amenities. Attracts families and longer-term visitors looking for more suburban experiences. | Parks and playgrounds, Community centers, Local schools |
| Manteno | Just a short drive from Kankakee, this suburb offers a quieter retreat with small-town charm, good for travelers seeking peace. | Manteno State Park, Local shops, Historic downtown |
Understanding Airbnb License Requirements & STR Laws in Kankakee (2026)
While Kankakee, Illinois, United States currently shows low STR regulations, specific Airbnb license requirements might still exist or change. Always verify the latest short term rental regulations and Airbnb license requirements directly with local government authorities for Kankakee to ensure full compliance before hosting.
(Source: AirROI data, 2026, finding no licensed listings among those analyzed)
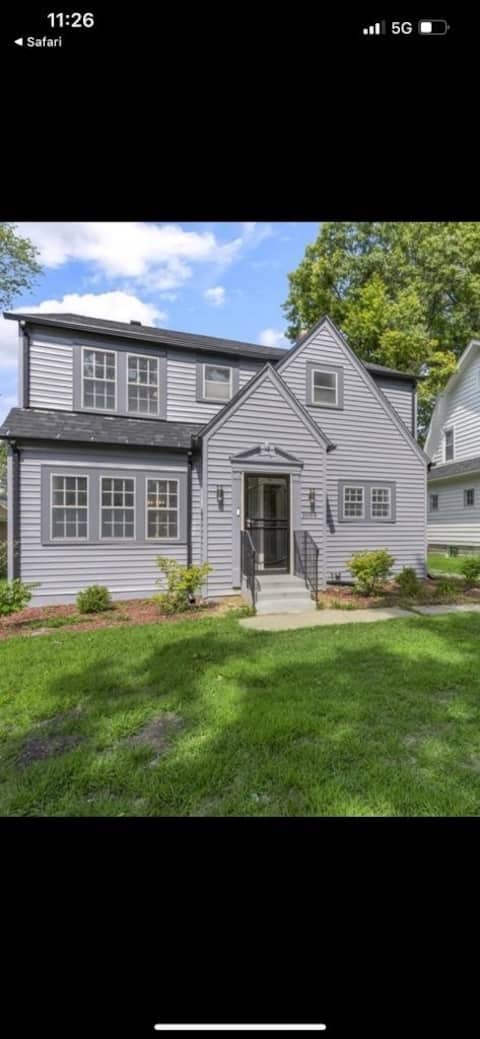
Top Performing Airbnb Properties in Kankakee (2026)
Benchmark your potential! Explore examples of top-performing Airbnb properties in Kankakeebased on Trailing Twelve Month (TTM) revenue. Analyze their characteristics, revenue, occupancy rate, and ADR to understand what drives success in this market.

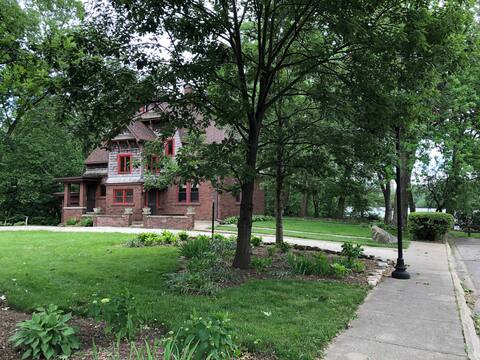
Château du Kankakee》Heritage in Historic Riverview
Entire Place • 3 bedrooms
Comfort and peace of mind.
Entire Place • 4 bedrooms
History and Luxury on the Kankakee River
Entire Place • 3 bedrooms
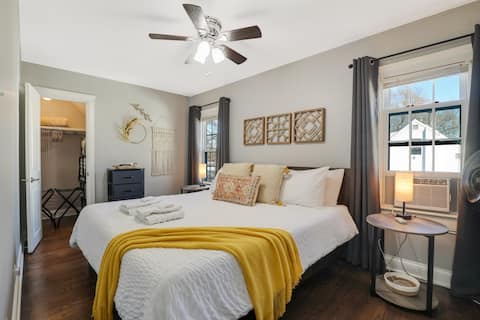
Tranquil Haven, 1 King Bed, Retreat by the River
Entire Place • 1 bedroom

Water Way on the Kankakee River
Entire Place • 3 bedrooms
Boho Haven • 2 King Beds • Washer/Dryer • Trails
Entire Place • 2 bedrooms
Note: Performance varies based on location, size, amenities, seasonality, and management quality. Data reflects the past 12 months.
Top Performing Airbnb Hosts in Kankakee (2026)
Learn from the best! This table showcases top-performing Airbnb hosts in Kankakee based on the number of properties managed and estimated total revenue over the past year. Analyze their scale and performance metrics.
| Host Name | Properties | Grossing Revenue | Stay Reviews | Avg Rating |
|---|---|---|---|---|
| Hollie | 4 | $103,111 | 551 | 4.91/5.0 |
| Dustin | 3 | $80,418 | 333 | 4.93/5.0 |
| Robert | 2 | $49,159 | 84 | 4.68/5.0 |
| Melvin | 1 | $37,052 | 5 | 5.00/5.0 |
| Shari | 1 | $33,747 | 85 | 5.00/5.0 |
| Mary | 1 | $31,535 | 11 | 5.00/5.0 |
| Glennette | 1 | $26,824 | 71 | 4.80/5.0 |
| Morgan | 1 | $26,132 | 24 | 4.92/5.0 |
| Terence | 1 | $24,551 | 2 | Not Rated |
| Jerry | 1 | $24,485 | 5 | 5.00/5.0 |
Analyzing the strategies of top hosts, such as their property selection, pricing, and guest communication, can offer valuable lessons for optimizing your own Airbnb operations in Kankakee.
Dive Deeper: Advanced Kankakee STR Market Data (2026)
Ready to unlock more insights? AirROI provides access to advanced metrics and comprehensive Airbnb data for Kankakee. Explore detailed analytics beyond this report to refine your investment strategy, optimize pricing, and maximize your vacation rental profits.
Explore Advanced MetricsKankakee Short-Term Rental Market Composition (2026): Property & Room Types
Room Type Distribution
Property Type Distribution
Market Composition Insights for Kankakee
- The Kankakee Airbnb market composition is heavily skewed towards Entire Home/Apt listings, which make up 84% of the 25 active rentals. This indicates strong guest preference for privacy and space.
- Looking at the property type distribution in Kankakee, House properties are the most common (56%), reflecting the local real estate landscape.
- Houses represent a significant 56% portion, catering likely to families or larger groups.
- Smaller segments like unique stays, others (combined 8.0%) offer potential for unique stay experiences.
Kankakee Airbnb Room Capacity Analysis (2026): Bedroom Distribution
Distribution of Listings by Number of Bedrooms
Room Capacity Insights for Kankakee
- The dominant room capacity in Kankakee is 2 bedrooms listings, making up 24% of the market. This suggests a strong demand for properties suitable for couples or solo travelers.
- Together, 2 bedrooms and 1 bedroom properties represent 44.0% of the active Airbnb listings in Kankakee, indicating a high concentration in these sizes.
- A significant 24.0% of listings offer 3+ bedrooms, catering to larger groups and families seeking more space in Kankakee.
Kankakee Vacation Rental Guest Capacity Trends (2026)
Distribution of Listings by Guest Capacity
Guest Capacity Insights for Kankakee
- The most common guest capacity trend in Kankakee vacation rentals is listings accommodating 6 guests (20%). This suggests the primary traveler segment is likely larger groups.
- Properties designed for 6 guests and 8+ guests dominate the Kankakee STR market, accounting for 40.0% of listings.
- 40.0% of properties accommodate 6+ guests, serving the market segment for larger families or group travel in Kankakee.
- On average, properties in Kankakee are equipped to host 4.2 guests.
Kankakee Airbnb Booking Patterns (2026): Available vs. Booked Days
Available Days Distribution
Booked Days Distribution
Booking Pattern Insights for Kankakee
- The most common availability pattern in Kankakee falls within the 181-270 days range, representing 64% of listings. This suggests many properties have significant open periods on their calendars.
- Approximately 80.0% of listings show high availability (181+ days open annually), indicating potential for increased bookings or specific owner usage patterns.
- For booked days, the 91-180 days range is most frequent in Kankakee (68%), reflecting common guest stay durations or potential owner blocking patterns.
- A notable 20.0% of properties secure long booking periods (181+ days booked per year), highlighting successful long-term rental strategies or significant owner usage.
Kankakee Airbnb Minimum Stay Requirements Analysis
Distribution of Listings by Minimum Night Requirement
1 Night
17 listings
68% of total
2 Nights
3 listings
12% of total
3 Nights
2 listings
8% of total
7-29 Nights
1 listings
4% of total
30+ Nights
2 listings
8% of total
Key Insights
- The most prevalent minimum stay requirement in Kankakee is 1 Night, adopted by 68% of listings. This highlights the market's preference for shorter, flexible bookings.
- A strong majority (80.0%) of the Kankakee Airbnb data shows acceptance of very short stays (1-2 nights), indicating a dynamic, high-turnover market.
Recommendations
- Align with the market by considering a 1 Night minimum stay, as 68% of Kankakee hosts use this setting.
- Explore offering discounts for stays of 30+ nights to attract the 8% of the market seeking extended stays.
- Adjust minimum nights based on seasonality – potentially shorter during low season and longer during peak demand periods in Kankakee.
Kankakee Airbnb Cancellation Policy Trends Analysis (2026)
Flexible
10 listings
40% of total
Moderate
12 listings
48% of total
Firm
2 listings
8% of total
Strict
1 listings
4% of total
Cancellation Policy Insights for Kankakee
- The prevailing Airbnb cancellation policy trend in Kankakee is Moderate, used by 48% of listings.
- The market strongly favors guest-friendly terms, with 88.0% of listings offering Flexible or Moderate policies. This suggests guests in Kankakee may expect booking flexibility.
- Strict cancellation policies are quite rare (4%), potentially making listings with this policy less competitive unless justified by high demand or property type.
Recommendations for Hosts
- Consider adopting a Moderate policy to align with the 48% market standard in Kankakee.
- Using a Strict policy might deter some guests, as only 4% of listings use it. Evaluate if potential revenue protection outweighs possible lower booking rates.
- Regularly review your cancellation policy against competitors and market demand shifts in Kankakee.
Kankakee STR Booking Lead Time Analysis (2026)
Average Booking Lead Time by Month
Booking Lead Time Insights for Kankakee
- The overall average booking lead time for vacation rentals in Kankakee is 28 days.
- Guests book furthest in advance for stays during July (average 46 days), likely coinciding with peak travel demand or local events.
- The shortest booking windows occur for stays in March (average 12 days), indicating more last-minute travel plans during this time.
- Seasonally, Summer (35 days avg.) sees the longest lead times, while Winter (18 days avg.) has the shortest, reflecting typical travel planning cycles.
Recommendations for Hosts
- Use the overall average lead time (28 days) as a baseline for your pricing and availability strategy in Kankakee.
- For July stays, consider implementing length-of-stay discounts or slightly higher rates for bookings made less than 46 days out to capitalize on advance planning.
- During March, focus on last-minute booking availability and promotions, as guests book with very short notice (12 days avg.).
- Target marketing efforts for the Summer season well in advance (at least 35 days) to capture early planners.
- Monitor your own booking lead times against these Kankakee averages to identify opportunities for dynamic pricing adjustments.
Popular & Essential Airbnb Amenities in Kankakee (2026)
Amenity Prevalence
Amenity Insights for Kankakee
- Essential amenities in Kankakee that guests expect include: Kitchen, TV, Carbon monoxide alarm, Wifi, Smoke alarm, Heating, Air conditioning, Refrigerator, Coffee maker, Microwave. Lacking these (any) could significantly impact bookings.
Recommendations for Hosts
- Ensure your listing includes all essential amenities for Kankakee: Kitchen, TV, Carbon monoxide alarm, Wifi, Smoke alarm, Heating, Air conditioning, Refrigerator, Coffee maker, Microwave.
- Prioritize adding missing essentials: Heating, Air conditioning, Refrigerator, Coffee maker, Microwave.
- Highlight unique or less common amenities you offer (e.g., hot tub, dedicated workspace, EV charger) in your listing description and photos.
- Regularly check competitor amenities in Kankakee to stay competitive.
Kankakee Airbnb Guest Demographics & Profile Analysis (2026)
Guest Profile Summary for Kankakee
- The typical guest profile for Airbnb in Kankakee consists of primarily domestic travelers (95%), often arriving from nearby Chicago, typically belonging to the Post-2000s (Gen Z/Alpha) group (50%), primarily speaking English or Spanish.
- Domestic travelers account for 94.9% of guests.
- Key international markets include United States (94.9%) and Mexico (2.3%).
- Top languages spoken are English (73.8%) followed by Spanish (17.2%).
- A significant demographic segment is the Post-2000s (Gen Z/Alpha) group, representing 50% of guests.
Recommendations for Hosts
- Target domestic marketing efforts towards travelers from Chicago and Chihuahua.
- Tailor amenities and listing descriptions to appeal to the dominant Post-2000s (Gen Z/Alpha) demographic (e.g., highlight fast WiFi, smart home features, local guides).
- Highlight unique local experiences or amenities relevant to the primary guest profile.
- Consider seasonal promotions aligned with peak travel times for key origin markets.
Nearby Short-Term Rental Market Comparison
How does the Kankakee Airbnb market stack up against its neighbors? Compare key performance metrics like average monthly revenue, ADR, and occupancy rates in surrounding areas to understand the broader regional STR landscape.
| Market | Active Properties | Monthly Revenue | Daily Rate | Avg. Occupancy |
|---|---|---|---|---|
| Town of Sugar Creek | 18 | $9,830 | $662.90 | 53% |
| Twin Lakes | 35 | $6,152 | $547.54 | 43% |
| Laketown Township | 59 | $6,112 | $529.59 | 44% |
| Port Sheldon Township | 26 | $6,015 | $566.98 | 47% |
| Ganges Township | 69 | $5,687 | $636.25 | 38% |
| Saugatuck Township | 141 | $5,627 | $508.58 | 43% |
| New Buffalo Township | 260 | $5,145 | $633.18 | 36% |
| Lake Geneva | 209 | $5,014 | $473.36 | 41% |
| Town of Geneva | 63 | $5,012 | $448.89 | 43% |
| Bertrand Township | 22 | $5,011 | $365.69 | 40% |