Grafton Airbnb Market Analysis 2026: Short Term Rental Data & Vacation Rental Statistics in Illinois, United States
Is Airbnb profitable in Grafton in 2026? Explore comprehensive Airbnb analytics for Grafton, Illinois, United States to uncover income potential. This 2026 STR market report for Grafton, based on AirROI data from February 2025 to January 2026, reveals key trends in the niche market of 61 active listings.
Whether you're considering an Airbnb investment in Grafton, optimizing your existing vacation rental, or exploring rental arbitrage opportunities, understanding the Grafton Airbnb data is crucial. Leveraging the low regulation environment is key to maximizing your short term rental income potential. Let's dive into the specifics.
Key Grafton Airbnb Performance Metrics Overview
Monthly Airbnb Revenue Variations & Income Potential in Grafton (2026)
Understanding the monthly revenue variations for Airbnb listings in Grafton is key to maximizing your short term rental income potential. Seasonality significantly impacts earnings. Our analysis, based on data from the past 12 months, shows that the peak revenue month for STRs in Grafton is typically July, while February often presents the lowest earnings, highlighting opportunities for strategic pricing adjustments during shoulder and low seasons. Explore the typical Airbnb income in Grafton across different performance tiers:
- Best-in-class properties (Top 10%) achieve $5,126+ monthly, often utilizing dynamic pricing and superior guest experiences.
- Strong performing properties (Top 25%) earn $3,408 or more, indicating effective management and desirable locations/amenities.
- Typical properties (Median) generate around $1,895 per month, representing the average market performance.
- Entry-level properties (Bottom 25%) see earnings around $975, often with potential for optimization.
Average Monthly Airbnb Earnings Trend in Grafton
Grafton Airbnb Occupancy Rate Trends (2026)
Maximize your bookings by understanding the Grafton STR occupancy trends. Seasonal demand shifts significantly influence how often properties are booked. Typically, Julysees the highest demand (peak season occupancy), while January experiences the lowest (low season). Effective strategies, like adjusting minimum stays or offering promotions, can boost occupancy during slower periods. Here's how different property tiers perform in Grafton:
- Best-in-class properties (Top 10%) achieve 56%+ occupancy, indicating high desirability and potentially optimized availability.
- Strong performing properties (Top 25%) maintain 43% or higher occupancy, suggesting good market fit and guest satisfaction.
- Typical properties (Median) have an occupancy rate around 27%.
- Entry-level properties (Bottom 25%) average 14% occupancy, potentially facing higher vacancy.
Average Monthly Occupancy Rate Trend in Grafton
Average Daily Rate (ADR) Airbnb Trends in Grafton (2026)
Effective short term rental pricing strategy in Grafton involves understanding monthly ADR fluctuations. The Average Daily Rate (ADR) for Airbnb in Grafton typically peaks in October and dips lowest during March. Leveraging Airbnb dynamic pricing tools or strategies based on this seasonality can significantly boost revenue. Here's a look at the typical nightly rates achieved:
- Best-in-class properties (Top 10%) command rates of $502+ per night, often due to premium features or locations.
- Strong performing properties (Top 25%) achieve nightly rates of $317 or more.
- Typical properties (Median) charge around $210 per night.
- Entry-level properties (Bottom 25%) earn around $168 per night.
Average Daily Rate (ADR) Trend by Month in Grafton
Get Live Grafton Market Intelligence 👇

Explore Real-time Analytics
Airbnb Seasonality Analysis & Trends in Grafton (2026)
Peak Season (July, August, June)
- Revenue averages $3,291 per month
- Occupancy rates average 36.5%
- Daily rates average $280
Shoulder Season
- Revenue averages $2,550 per month
- Occupancy maintains around 30.9%
- Daily rates hold near $281
Low Season (January, February, April)
- Revenue drops to average $1,532 per month
- Occupancy decreases to average 21.6%
- Daily rates adjust to average $264
Seasonality Insights for Grafton
- The Airbnb seasonality in Grafton shows highly seasonal trends requiring careful strategy. While the sections above show seasonal averages, it's also insightful to look at the extremes:
- During the high season, the absolute peak month showcases Grafton's highest earning potential, with monthly revenues capable of climbing to $3,582, occupancy reaching a high of 39.3%, and ADRs peaking at $295.
- Conversely, the slowest single month of the year, typically falling within the low season, marks the market's lowest point. In this month, revenue might dip to $1,309, occupancy could drop to 18.7%, and ADRs may adjust down to $255.
- Understanding both the seasonal averages and these monthly peaks and troughs in revenue, occupancy, and ADR is crucial for maximizing your Airbnb profit potential in Grafton.
Seasonal Strategies for Maximizing Profit
- Peak Season: Maximize revenue through premium pricing and potentially longer minimum stays. Ensure high availability.
- Low Season: Offer competitive pricing, special promotions (e.g., extended stay discounts), and flexible cancellation policies. Target off-season travelers like remote workers or budget-conscious guests.
- Shoulder Seasons: Implement dynamic pricing that balances peak and low rates. Target weekend travelers or specific events. Offer slightly more flexible terms than peak season.
- Regularly analyze your own performance against these Grafton seasonality benchmarks and adjust your pricing and availability strategy accordingly.
Best Areas for Airbnb Investment in Grafton (2026)
Exploring the top neighborhoods for short-term rentals in Grafton? This section highlights key areas, outlining why they are attractive for hosts and guests, along with notable local attractions. Consider these locations based on your target guest profile and investment strategy.
| Neighborhood / Area | Why Host Here? (Target Guests & Appeal) | Key Attractions & Landmarks |
|---|---|---|
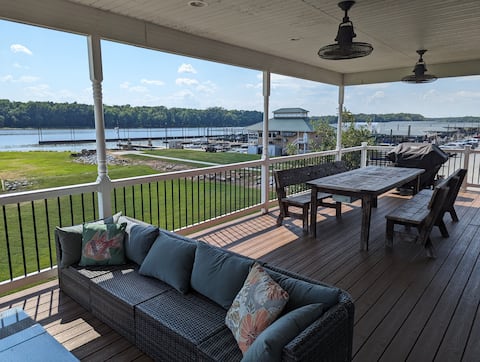
| Grafton Riverfront | Picturesque riverfront area that attracts tourists for its beautiful views and outdoor recreational activities. Ideal for guests seeking nature-related experiences and relaxation by the river. | Mississippi River, Pere Marquette State Park, Grafton Zipline Adventures, Beaver Dam State Park, Grafton Winery and Brewhaus |
| Nauvoo | Historic town known for its religious significance and well-preserved historical buildings. A draw for history enthusiasts and visitors interested in religious tourism. | Nauvoo Historic District, Nauvoo Temple, Joseph Smith Historic Site, Nauvoo Pageant, Old Nauvoo |
| Alton | Charming river town with rich history and beautiful architecture. Offers a variety of activities and attractions that appeal to families and couples alike. | Historic Alton Ghost Tours, Riverlands Migratory Bird Sanctuary, Alton Museum of History & Art, Pere Marquette State Park, Mississippi River Tours |
| Pere Marquette State Park | Large state park known for outdoor activities such as hiking, camping, and wildlife viewing. Perfect for those looking to connect with nature during their stay. | Scenic Overlooks, Hiking Trails, Wildlife Viewing, Fishing, Campgrounds |
| Jerseyville | Peaceful small town with a mix of history and nature. Great for families and individuals looking for a quiet getaway close to Grafton. | Jersey County Historical Society, Woods Ranch, Treehouse Wildlife Center, Myrtledale Farm, Historic Route 66 |
| Wood River | Residential area with convenient access to nearby attractions and amenities. Suitable for guests visiting the surrounding region or working in the area. | Wood River Nature Center, Bunker Hill Historic Museum, Hayner Public Library, Parks and Recreation areas, Local eateries and shops |
| Bradley | Affordable destination with a friendly atmosphere, attracting visitors who want to experience local culture and hospitality in a small-town setting. | Bradley Bourbonnais Historical Society, Local Parks, Community Events, Shopping District, Dining Options |
| East Alton | Developing area with various attractions and activities, suitable for guests interested in exploring the nearby metro region and its offerings. | East Alton Historical Society, Local parks and recreation areas, Shopping and dining options, Access to major highways, Cultivated community events |
Understanding Airbnb License Requirements & STR Laws in Grafton (2026)
While Grafton, Illinois, United States currently shows low STR regulations, specific Airbnb license requirements might still exist or change. Always verify the latest short term rental regulations and Airbnb license requirements directly with local government authorities for Grafton to ensure full compliance before hosting.
(Source: AirROI data, 2026, finding no licensed listings among those analyzed)
Top Performing Airbnb Properties in Grafton (2026)
Benchmark your potential! Explore examples of top-performing Airbnb properties in Graftonbased on Trailing Twelve Month (TTM) revenue. Analyze their characteristics, revenue, occupancy rate, and ADR to understand what drives success in this market.
River's Paradise
Entire Place • 4 bedrooms

3 Houses-Sleep 18+On Main+ Riverview
Entire Place • 9 bedrooms

Hot Tub+Private Courtyard+Sleeps 10
Entire Place • 5 bedrooms

Grafton Getaway@Riverhouse (a waterfront property)
Entire Place • 4 bedrooms
Main Street+River View+3 Bedrooms
Entire Place • 3 bedrooms

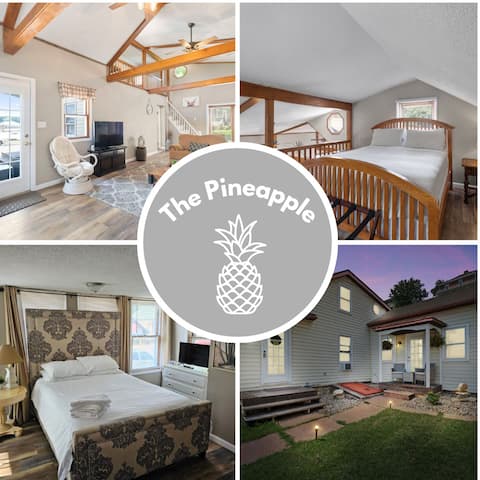
Stay In A Piece Of History
Entire Place • 4 bedrooms
Note: Performance varies based on location, size, amenities, seasonality, and management quality. Data reflects the past 12 months.
Top Performing Airbnb Hosts in Grafton (2026)
Learn from the best! This table showcases top-performing Airbnb hosts in Grafton based on the number of properties managed and estimated total revenue over the past year. Analyze their scale and performance metrics.
| Host Name | Properties | Grossing Revenue | Stay Reviews | Avg Rating |
|---|---|---|---|---|
| Jacqi | 8 | $352,787 | 359 | 4.91/5.0 |
| Richard | 1 | $114,991 | 55 | 4.98/5.0 |
| Brandon | 2 | $101,562 | 469 | 4.97/5.0 |
| Tony | 2 | $79,659 | 53 | 4.96/5.0 |
| Bill | 5 | $66,289 | 300 | 4.92/5.0 |
| Louvier | 5 | $60,183 | 226 | 4.91/5.0 |
| Jeff | 3 | $54,085 | 20 | 4.64/5.0 |
| Caroline | 1 | $51,418 | 41 | 4.98/5.0 |
| Kim | 2 | $48,633 | 324 | 4.91/5.0 |
| Patricia | 1 | $47,568 | 99 | 5.00/5.0 |
Analyzing the strategies of top hosts, such as their property selection, pricing, and guest communication, can offer valuable lessons for optimizing your own Airbnb operations in Grafton.
Dive Deeper: Advanced Grafton STR Market Data (2026)
Ready to unlock more insights? AirROI provides access to advanced metrics and comprehensive Airbnb data for Grafton. Explore detailed analytics beyond this report to refine your investment strategy, optimize pricing, and maximize your vacation rental profits.
Explore Advanced MetricsGrafton Short-Term Rental Market Composition (2026): Property & Room Types
Room Type Distribution
Property Type Distribution
Market Composition Insights for Grafton
- The Grafton Airbnb market composition is heavily skewed towards Entire Home/Apt listings, which make up 77% of the 61 active rentals. This indicates strong guest preference for privacy and space.
- Looking at the property type distribution in Grafton, House properties are the most common (47.5%), reflecting the local real estate landscape.
- Houses represent a significant 47.5% portion, catering likely to families or larger groups.
- The presence of 24.6% Hotel/Boutique listings indicates integration with traditional hospitality.
- Smaller segments like outdoor/unique, others (combined 9.8%) offer potential for unique stay experiences.
Grafton Airbnb Room Capacity Analysis (2026): Bedroom Distribution
Distribution of Listings by Number of Bedrooms
Room Capacity Insights for Grafton
- The dominant room capacity in Grafton is 1 bedroom listings, making up 31.1% of the market. This suggests a strong demand for properties suitable for couples or solo travelers.
- Together, 1 bedroom and 3 bedrooms properties represent 54.1% of the active Airbnb listings in Grafton, indicating a high concentration in these sizes.
- A significant 39.4% of listings offer 3+ bedrooms, catering to larger groups and families seeking more space in Grafton.
Grafton Vacation Rental Guest Capacity Trends (2026)
Distribution of Listings by Guest Capacity
Guest Capacity Insights for Grafton
- The most common guest capacity trend in Grafton vacation rentals is listings accommodating 4 guests (32.8%). This suggests the primary traveler segment is likely small families or groups.
- Properties designed for 4 guests and 8+ guests dominate the Grafton STR market, accounting for 57.4% of listings.
- 45.9% of properties accommodate 6+ guests, serving the market segment for larger families or group travel in Grafton.
- On average, properties in Grafton are equipped to host 5.0 guests.
Grafton Airbnb Booking Patterns (2026): Available vs. Booked Days
Available Days Distribution
Booked Days Distribution
Booking Pattern Insights for Grafton
- The most common availability pattern in Grafton falls within the 271-366 days range, representing 55.7% of listings. This suggests many properties have significant open periods on their calendars.
- Approximately 90.1% of listings show high availability (181+ days open annually), indicating potential for increased bookings or specific owner usage patterns.
- For booked days, the 31-90 days range is most frequent in Grafton (44.3%), reflecting common guest stay durations or potential owner blocking patterns.
- A notable 11.5% of properties secure long booking periods (181+ days booked per year), highlighting successful long-term rental strategies or significant owner usage.
Grafton Airbnb Minimum Stay Requirements Analysis
Distribution of Listings by Minimum Night Requirement
1 Night
30 listings
49.2% of total
2 Nights
22 listings
36.1% of total
30+ Nights
9 listings
14.8% of total
Key Insights
- The most prevalent minimum stay requirement in Grafton is 1 Night, adopted by 49.2% of listings. This highlights the market's preference for shorter, flexible bookings.
- A strong majority (85.3%) of the Grafton Airbnb data shows acceptance of very short stays (1-2 nights), indicating a dynamic, high-turnover market.
- A significant segment (14.8%) caters to monthly stays (30+ nights) in Grafton, pointing to opportunities in the extended-stay market.
Recommendations
- Align with the market by considering a 1 Night minimum stay, as 49.2% of Grafton hosts use this setting.
- Explore offering discounts for stays of 30+ nights to attract the 14.8% of the market seeking extended stays.
- Adjust minimum nights based on seasonality – potentially shorter during low season and longer during peak demand periods in Grafton.
Grafton Airbnb Cancellation Policy Trends Analysis (2026)
Flexible
4 listings
6.6% of total
Moderate
19 listings
31.1% of total
Firm
25 listings
41% of total
Strict
13 listings
21.3% of total
Cancellation Policy Insights for Grafton
- The prevailing Airbnb cancellation policy trend in Grafton is Firm, used by 41% of listings.
- A majority (62.3%) of hosts in Grafton utilize Firm or Strict policies, indicating a market where hosts prioritize booking security.
Recommendations for Hosts
- Consider adopting a Firm policy to align with the 41% market standard in Grafton.
- Regularly review your cancellation policy against competitors and market demand shifts in Grafton.
Grafton STR Booking Lead Time Analysis (2026)
Average Booking Lead Time by Month
Booking Lead Time Insights for Grafton
- The overall average booking lead time for vacation rentals in Grafton is 54 days.
- Guests book furthest in advance for stays during October (average 79 days), likely coinciding with peak travel demand or local events.
- The shortest booking windows occur for stays in December (average 30 days), indicating more last-minute travel plans during this time.
- Seasonally, Fall (63 days avg.) sees the longest lead times, while Winter (32 days avg.) has the shortest, reflecting typical travel planning cycles.
Recommendations for Hosts
- Use the overall average lead time (54 days) as a baseline for your pricing and availability strategy in Grafton.
- For October stays, consider implementing length-of-stay discounts or slightly higher rates for bookings made less than 79 days out to capitalize on advance planning.
- Target marketing efforts for the Fall season well in advance (at least 63 days) to capture early planners.
- Monitor your own booking lead times against these Grafton averages to identify opportunities for dynamic pricing adjustments.
Popular & Essential Airbnb Amenities in Grafton (2026)
Amenity Prevalence
Amenity Insights for Grafton
- Essential amenities in Grafton that guests expect include: Air conditioning, Heating, Smoke alarm, Free parking on premises, TV. Lacking these (any) could significantly impact bookings.
- Popular amenities like Dishes and silverware, Hot water, Coffee maker are common but not universal. Offering these can provide a competitive edge.
- Warning: Wifi is not universally provided but is considered essential globally. Ensure reliable Wifi is offered.
Recommendations for Hosts
- Ensure your listing includes all essential amenities for Grafton: Air conditioning, Heating, Smoke alarm, Free parking on premises, TV.
- Prioritize adding missing essentials: Smoke alarm, Free parking on premises, TV.
- Consider adding popular differentiators like Dishes and silverware or Hot water to increase appeal.
- Highlight unique or less common amenities you offer (e.g., hot tub, dedicated workspace, EV charger) in your listing description and photos.
- Regularly check competitor amenities in Grafton to stay competitive.
Grafton Airbnb Guest Demographics & Profile Analysis (2026)
Guest Profile Summary for Grafton
- The typical guest profile for Airbnb in Grafton consists of primarily domestic travelers (100%), often arriving from nearby St. Louis, typically belonging to the Post-2000s (Gen Z/Alpha) group (50%), primarily speaking English or Spanish.
- Domestic travelers account for 99.6% of guests.
- Key international markets include United States (99.6%) and Germany (0.2%).
- Top languages spoken are English (92.5%) followed by Spanish (4.1%).
- A significant demographic segment is the Post-2000s (Gen Z/Alpha) group, representing 50% of guests.
Recommendations for Hosts
- Target domestic marketing efforts towards travelers from St. Louis and Springfield.
- Tailor amenities and listing descriptions to appeal to the dominant Post-2000s (Gen Z/Alpha) demographic (e.g., highlight fast WiFi, smart home features, local guides).
- Highlight unique local experiences or amenities relevant to the primary guest profile.
- Consider seasonal promotions aligned with peak travel times for key origin markets.
Nearby Short-Term Rental Market Comparison
How does the Grafton Airbnb market stack up against its neighbors? Compare key performance metrics like average monthly revenue, ADR, and occupancy rates in surrounding areas to understand the broader regional STR landscape.
| Market | Active Properties | Monthly Revenue | Daily Rate | Avg. Occupancy |
|---|---|---|---|---|
| Wright City | 13 | $4,135 | $455.44 | 37% |
| Innsbrook | 199 | $4,100 | $422.60 | 35% |
| Ste. Genevieve | 13 | $3,781 | $375.74 | 36% |
| Creve Coeur | 10 | $3,420 | $282.01 | 42% |
| Makanda | 19 | $3,145 | $247.99 | 51% |
| Godfrey | 10 | $3,077 | $217.89 | 50% |
| Maryland Heights | 19 | $2,989 | $219.63 | 55% |
| Wentzville | 19 | $2,964 | $195.63 | 51% |
| Saint Charles | 159 | $2,907 | $214.21 | 50% |
| O’Fallon | 38 | $2,897 | $225.47 | 51% |