Bloomington Airbnb Market Analysis 2026: Short Term Rental Data & Vacation Rental Statistics in Illinois, United States
Is Airbnb profitable in Bloomington in 2026? Explore comprehensive Airbnb analytics for Bloomington, Illinois, United States to uncover income potential. This 2026 STR market report for Bloomington, based on AirROI data from February 2025 to January 2026, reveals key trends in the niche market of 129 active listings.
Whether you're considering an Airbnb investment in Bloomington, optimizing your existing vacation rental, or exploring rental arbitrage opportunities, understanding the Bloomington Airbnb data is crucial. Leveraging the low regulation environment is key to maximizing your short term rental income potential. Let's dive into the specifics.
Key Bloomington Airbnb Performance Metrics Overview
Monthly Airbnb Revenue Variations & Income Potential in Bloomington (2026)
Understanding the monthly revenue variations for Airbnb listings in Bloomington is key to maximizing your short term rental income potential. Seasonality significantly impacts earnings. Our analysis, based on data from the past 12 months, shows that the peak revenue month for STRs in Bloomington is typically August, while February often presents the lowest earnings, highlighting opportunities for strategic pricing adjustments during shoulder and low seasons. Explore the typical Airbnb income in Bloomington across different performance tiers:
- Best-in-class properties (Top 10%) achieve $5,300+ monthly, often utilizing dynamic pricing and superior guest experiences.
- Strong performing properties (Top 25%) earn $3,411 or more, indicating effective management and desirable locations/amenities.
- Typical properties (Median) generate around $2,143 per month, representing the average market performance.
- Entry-level properties (Bottom 25%) see earnings around $1,114, often with potential for optimization.
Average Monthly Airbnb Earnings Trend in Bloomington
Bloomington Airbnb Occupancy Rate Trends (2026)
Maximize your bookings by understanding the Bloomington STR occupancy trends. Seasonal demand shifts significantly influence how often properties are booked. Typically, Septembersees the highest demand (peak season occupancy), while January experiences the lowest (low season). Effective strategies, like adjusting minimum stays or offering promotions, can boost occupancy during slower periods. Here's how different property tiers perform in Bloomington:
- Best-in-class properties (Top 10%) achieve 86%+ occupancy, indicating high desirability and potentially optimized availability.
- Strong performing properties (Top 25%) maintain 72% or higher occupancy, suggesting good market fit and guest satisfaction.
- Typical properties (Median) have an occupancy rate around 53%.
- Entry-level properties (Bottom 25%) average 31% occupancy, potentially facing higher vacancy.
Average Monthly Occupancy Rate Trend in Bloomington
Average Daily Rate (ADR) Airbnb Trends in Bloomington (2026)
Effective short term rental pricing strategy in Bloomington involves understanding monthly ADR fluctuations. The Average Daily Rate (ADR) for Airbnb in Bloomington typically peaks in December and dips lowest during February. Leveraging Airbnb dynamic pricing tools or strategies based on this seasonality can significantly boost revenue. Here's a look at the typical nightly rates achieved:
- Best-in-class properties (Top 10%) command rates of $259+ per night, often due to premium features or locations.
- Strong performing properties (Top 25%) achieve nightly rates of $174 or more.
- Typical properties (Median) charge around $118 per night.
- Entry-level properties (Bottom 25%) earn around $81 per night.
Average Daily Rate (ADR) Trend by Month in Bloomington
Get Live Bloomington Market Intelligence 👇

Explore Real-time Analytics
Airbnb Seasonality Analysis & Trends in Bloomington (2026)
Peak Season (August, October, September)
- Revenue averages $3,340 per month
- Occupancy rates average 60.1%
- Daily rates average $162
Shoulder Season
- Revenue averages $2,762 per month
- Occupancy maintains around 51.7%
- Daily rates hold near $156
Low Season (January, February, April)
- Revenue drops to average $1,922 per month
- Occupancy decreases to average 42.2%
- Daily rates adjust to average $144
Seasonality Insights for Bloomington
- The Airbnb seasonality in Bloomington shows moderate seasonality with distinct peak and low periods. While the sections above show seasonal averages, it's also insightful to look at the extremes:
- During the high season, the absolute peak month showcases Bloomington's highest earning potential, with monthly revenues capable of climbing to $3,397, occupancy reaching a high of 64.0%, and ADRs peaking at $171.
- Conversely, the slowest single month of the year, typically falling within the low season, marks the market's lowest point. In this month, revenue might dip to $1,694, occupancy could drop to 38.5%, and ADRs may adjust down to $133.
- Understanding both the seasonal averages and these monthly peaks and troughs in revenue, occupancy, and ADR is crucial for maximizing your Airbnb profit potential in Bloomington.
Seasonal Strategies for Maximizing Profit
- Peak Season: Maximize revenue through premium pricing and potentially longer minimum stays. Ensure high availability.
- Low Season: Offer competitive pricing, special promotions (e.g., extended stay discounts), and flexible cancellation policies. Target off-season travelers like remote workers or budget-conscious guests.
- Shoulder Seasons: Implement dynamic pricing that balances peak and low rates. Target weekend travelers or specific events. Offer slightly more flexible terms than peak season.
- Regularly analyze your own performance against these Bloomington seasonality benchmarks and adjust your pricing and availability strategy accordingly.
Best Areas for Airbnb Investment in Bloomington (2026)
Exploring the top neighborhoods for short-term rentals in Bloomington? This section highlights key areas, outlining why they are attractive for hosts and guests, along with notable local attractions. Consider these locations based on your target guest profile and investment strategy.
| Neighborhood / Area | Why Host Here? (Target Guests & Appeal) | Key Attractions & Landmarks |
|---|---|---|
| Downtown Bloomington | The heart of the city, known for its vibrant culture, dining, and entertainment options. Ideal for both business travelers and tourists seeking the local experience. | Illinois State University, Bloomington Center for the Performing Arts, Constitution Trail, Millennium Plaza, McLean County Museum of History |
| Normal | Adjacent to Bloomington, home to Illinois State University. This area attracts students, families, and university visitors throughout the year. | Illinois State University, The Children's Discovery Museum, Constitution Trail, Eastland Mall, ISU's Redbird Arena |
| West Bloomington | A family-friendly area with parks and community events, making it appealing for family travelers and those looking for a quieter stay. | Ewing Park, Miller Park Zoo, Grady's Family Fun Park, Trails at White Oak Park, Eastview Christian Church |
| East Bloomington | Offers a mix of residential charm and convenience with shopping and restaurants, favored by guests who want easy access to amenities. | Eastland Mall, The Shoppes at College Hills, Walmart Supercenter, Bloomington Public Library, Miller Park |
| North Bloomington | A suburban setting with green spaces and family attractions, perfect for longer-term rentals and family vacations. | Minnehan Park, Cedar Ridge Park, The Great Pumpkin Patch, Dawson Lake, North Park |
| Historic Old Town | A charming neighborhood known for its historic homes and proximity to downtown, appealing for guests interested in history and local culture. | Historic Downtown, The Normal Theater, David Davis Mansion, The Children's Discovery Museum, McLean County Museum of History |
| Lake Bloomington | A scenic area popular for outdoor activities. Great for nature lovers and those looking for a peaceful getaway. | Lake Bloomington, Parks with boating and fishing access, Camping areas, Nature trails, Picnic sites |
| South Bloomington | A growing area with new developments and shopping centers, attracting visitors looking for convenience and modern amenities. | Kirkland Fine Arts Center, Chamber of Commerce, Shopping centers, Community parks, Local dining options |
Understanding Airbnb License Requirements & STR Laws in Bloomington (2026)
While Bloomington, Illinois, United States currently shows low STR regulations, specific Airbnb license requirements might still exist or change. Always verify the latest short term rental regulations and Airbnb license requirements directly with local government authorities for Bloomington to ensure full compliance before hosting.
(Source: AirROI data, 2026, finding no licensed listings among those analyzed)
Top Performing Airbnb Properties in Bloomington (2026)
Benchmark your potential! Explore examples of top-performing Airbnb properties in Bloomingtonbased on Trailing Twelve Month (TTM) revenue. Analyze their characteristics, revenue, occupancy rate, and ADR to understand what drives success in this market.
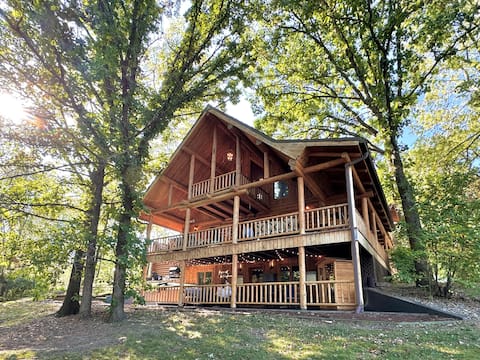
Stunning XL Rustic Modern Escape w/ Gaming & Spa!
Entire Place • 3 bedrooms

Bloomington Estate
Entire Place • 5 bedrooms

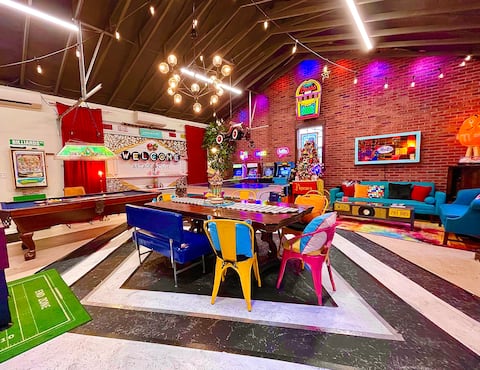
Special - House of Games - Play, Relax, Unwind!
Entire Place • 3 bedrooms

Royale Cinema Retreat - Theater, Games, Lounge
Entire Place • 4 bedrooms
Music & Movies Arcade House, Hot Tub
Entire Place • 3 bedrooms
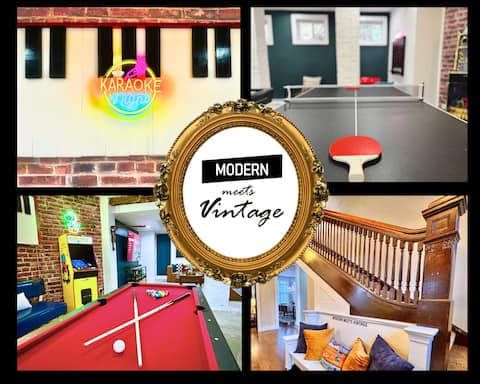
Modern Meets Vintage - 5 BRs - Pools Nearby!
Entire Place • 5 bedrooms
Note: Performance varies based on location, size, amenities, seasonality, and management quality. Data reflects the past 12 months.
Top Performing Airbnb Hosts in Bloomington (2026)
Learn from the best! This table showcases top-performing Airbnb hosts in Bloomington based on the number of properties managed and estimated total revenue over the past year. Analyze their scale and performance metrics.
| Host Name | Properties | Grossing Revenue | Stay Reviews | Avg Rating |
|---|---|---|---|---|
| Andy & Marie | 2 | $177,662 | 747 | 5.00/5.0 |
| Vesta Real Estate | 17 | $164,606 | 217 | 4.68/5.0 |
| Kristin | 1 | $152,526 | 111 | 4.99/5.0 |
| Elizabeth | 1 | $146,651 | 42 | 4.86/5.0 |
| Ryan | 2 | $117,588 | 193 | 4.90/5.0 |
| Josanne | 9 | $108,768 | 191 | 4.77/5.0 |
| Robert | 1 | $98,244 | 43 | 4.93/5.0 |
| Amanda | 2 | $84,435 | 149 | 4.97/5.0 |
| Pam | 5 | $81,321 | 20 | 4.96/5.0 |
| Best M&W | 2 | $74,564 | 50 | 4.95/5.0 |
Analyzing the strategies of top hosts, such as their property selection, pricing, and guest communication, can offer valuable lessons for optimizing your own Airbnb operations in Bloomington.
Dive Deeper: Advanced Bloomington STR Market Data (2026)
Ready to unlock more insights? AirROI provides access to advanced metrics and comprehensive Airbnb data for Bloomington. Explore detailed analytics beyond this report to refine your investment strategy, optimize pricing, and maximize your vacation rental profits.
Explore Advanced MetricsBloomington Short-Term Rental Market Composition (2026): Property & Room Types
Room Type Distribution
Property Type Distribution
Market Composition Insights for Bloomington
- The Bloomington Airbnb market composition is heavily skewed towards Entire Home/Apt listings, which make up 82.9% of the 129 active rentals. This indicates strong guest preference for privacy and space.
- Looking at the property type distribution in Bloomington, House properties are the most common (48.8%), reflecting the local real estate landscape.
- Houses represent a significant 48.8% portion, catering likely to families or larger groups.
- The presence of 7.8% Hotel/Boutique listings indicates integration with traditional hospitality.
- Smaller segments like outdoor/unique, others (combined 3.1%) offer potential for unique stay experiences.
Bloomington Airbnb Room Capacity Analysis (2026): Bedroom Distribution
Distribution of Listings by Number of Bedrooms
Room Capacity Insights for Bloomington
- The dominant room capacity in Bloomington is 1 bedroom listings, making up 27.9% of the market. This suggests a strong demand for properties suitable for couples or solo travelers.
- Together, 1 bedroom and 2 bedrooms properties represent 53.5% of the active Airbnb listings in Bloomington, indicating a high concentration in these sizes.
- A significant 31.8% of listings offer 3+ bedrooms, catering to larger groups and families seeking more space in Bloomington.
Bloomington Vacation Rental Guest Capacity Trends (2026)
Distribution of Listings by Guest Capacity
Guest Capacity Insights for Bloomington
- The most common guest capacity trend in Bloomington vacation rentals is listings accommodating 4 guests (24.8%). This suggests the primary traveler segment is likely small families or groups.
- Properties designed for 4 guests and 2 guests dominate the Bloomington STR market, accounting for 45.0% of listings.
- 31.8% of properties accommodate 6+ guests, serving the market segment for larger families or group travel in Bloomington.
- On average, properties in Bloomington are equipped to host 4.0 guests.
Bloomington Airbnb Booking Patterns (2026): Available vs. Booked Days
Available Days Distribution
Booked Days Distribution
Booking Pattern Insights for Bloomington
- The most common availability pattern in Bloomington falls within the 91-180 days range, representing 33.3% of listings. This suggests many properties have significant open periods on their calendars.
- Approximately 63.5% of listings show high availability (181+ days open annually), indicating potential for increased bookings or specific owner usage patterns.
- For booked days, the 181-270 days range is most frequent in Bloomington (35.7%), reflecting common guest stay durations or potential owner blocking patterns.
- A notable 38.8% of properties secure long booking periods (181+ days booked per year), highlighting successful long-term rental strategies or significant owner usage.
Bloomington Airbnb Minimum Stay Requirements Analysis
Distribution of Listings by Minimum Night Requirement
1 Night
25 listings
19.4% of total
2 Nights
28 listings
21.7% of total
3 Nights
9 listings
7% of total
4-6 Nights
8 listings
6.2% of total
7-29 Nights
32 listings
24.8% of total
30+ Nights
27 listings
20.9% of total
Key Insights
- The most prevalent minimum stay requirement in Bloomington is 7-29 Nights, adopted by 24.8% of listings. This highlights the market's preference for shorter, flexible bookings.
- A significant segment (20.9%) caters to monthly stays (30+ nights) in Bloomington, pointing to opportunities in the extended-stay market.
Recommendations
- Align with the market by considering a 7-29 Nights minimum stay, as 24.8% of Bloomington hosts use this setting.
- If feasible, allowing 1-night stays, especially midweek or during low season, could capture last-minute bookings, as only 19.4% currently do.
- Explore offering discounts for stays of 30+ nights to attract the 20.9% of the market seeking extended stays.
- Adjust minimum nights based on seasonality – potentially shorter during low season and longer during peak demand periods in Bloomington.
Bloomington Airbnb Cancellation Policy Trends Analysis (2026)
Super Strict 30 Days
1 listings
0.8% of total
Limited
3 listings
2.3% of total
Super Strict 60 Days
1 listings
0.8% of total
Flexible
28 listings
21.7% of total
Moderate
39 listings
30.2% of total
Firm
29 listings
22.5% of total
Strict
28 listings
21.7% of total
Cancellation Policy Insights for Bloomington
- The prevailing Airbnb cancellation policy trend in Bloomington is Moderate, used by 30.2% of listings.
- There's a relatively balanced mix between guest-friendly (51.9%) and stricter (44.2%) policies, offering choices for different guest needs.
Recommendations for Hosts
- Consider adopting a Moderate policy to align with the 30.2% market standard in Bloomington.
- Regularly review your cancellation policy against competitors and market demand shifts in Bloomington.
Bloomington STR Booking Lead Time Analysis (2026)
Average Booking Lead Time by Month
Booking Lead Time Insights for Bloomington
- The overall average booking lead time for vacation rentals in Bloomington is 35 days.
- Guests book furthest in advance for stays during September (average 56 days), likely coinciding with peak travel demand or local events.
- The shortest booking windows occur for stays in February (average 19 days), indicating more last-minute travel plans during this time.
- Seasonally, Fall (50 days avg.) sees the longest lead times, while Winter (25 days avg.) has the shortest, reflecting typical travel planning cycles.
Recommendations for Hosts
- Use the overall average lead time (35 days) as a baseline for your pricing and availability strategy in Bloomington.
- For September stays, consider implementing length-of-stay discounts or slightly higher rates for bookings made less than 56 days out to capitalize on advance planning.
- Target marketing efforts for the Fall season well in advance (at least 50 days) to capture early planners.
- Monitor your own booking lead times against these Bloomington averages to identify opportunities for dynamic pricing adjustments.
Popular & Essential Airbnb Amenities in Bloomington (2026)
Amenity Prevalence
Amenity Insights for Bloomington
- Essential amenities in Bloomington that guests expect include: Air conditioning, Wifi, Free parking on premises, Smoke alarm. Lacking these (any) could significantly impact bookings.
- Popular amenities like TV, Kitchen, Heating are common but not universal. Offering these can provide a competitive edge.
Recommendations for Hosts
- Ensure your listing includes all essential amenities for Bloomington: Air conditioning, Wifi, Free parking on premises, Smoke alarm.
- Prioritize adding missing essentials: Free parking on premises, Smoke alarm.
- Consider adding popular differentiators like TV or Kitchen to increase appeal.
- Highlight unique or less common amenities you offer (e.g., hot tub, dedicated workspace, EV charger) in your listing description and photos.
- Regularly check competitor amenities in Bloomington to stay competitive.
Bloomington Airbnb Guest Demographics & Profile Analysis (2026)
Guest Profile Summary for Bloomington
- The typical guest profile for Airbnb in Bloomington consists of primarily domestic travelers (96%), often arriving from nearby Chicago, typically belonging to the Post-2000s (Gen Z/Alpha) group (50%), primarily speaking English or Spanish.
- Domestic travelers account for 95.9% of guests.
- Key international markets include United States (95.9%) and Mexico (0.8%).
- Top languages spoken are English (72.7%) followed by Spanish (11.2%).
- A significant demographic segment is the Post-2000s (Gen Z/Alpha) group, representing 50% of guests.
Recommendations for Hosts
- Target domestic marketing efforts towards travelers from Chicago and Bloomington.
- Tailor amenities and listing descriptions to appeal to the dominant Post-2000s (Gen Z/Alpha) demographic (e.g., highlight fast WiFi, smart home features, local guides).
- Highlight unique local experiences or amenities relevant to the primary guest profile.
- Consider seasonal promotions aligned with peak travel times for key origin markets.
Nearby Short-Term Rental Market Comparison
How does the Bloomington Airbnb market stack up against its neighbors? Compare key performance metrics like average monthly revenue, ADR, and occupancy rates in surrounding areas to understand the broader regional STR landscape.
| Market | Active Properties | Monthly Revenue | Daily Rate | Avg. Occupancy |
|---|---|---|---|---|
| Elmhurst | 16 | $4,469 | $355.09 | 49% |
| Addison Township | 19 | $4,214 | $362.67 | 42% |
| Glen Ellyn | 21 | $3,911 | $294.70 | 48% |
| Geneva | 32 | $3,591 | $237.71 | 50% |
| Morris | 15 | $3,246 | $235.07 | 50% |
| Roselle | 12 | $3,238 | $211.87 | 56% |
| St. Charles Township | 19 | $3,233 | $281.50 | 42% |
| Marshall | 12 | $3,135 | $264.69 | 39% |
| Chicago | 5,870 | $3,100 | $248.82 | 48% |
| Effingham | 22 | $3,085 | $277.14 | 44% |