Victor Airbnb Market Analysis 2026: Short Term Rental Data & Vacation Rental Statistics in Idaho, United States
Is Airbnb profitable in Victor in 2026? Explore comprehensive Airbnb analytics for Victor, Idaho, United States to uncover income potential. This 2026 STR market report for Victor, based on AirROI data from February 2025 to January 2026, reveals key trends in the market of 338 active listings.
Whether you're considering an Airbnb investment in Victor, optimizing your existing vacation rental, or exploring rental arbitrage opportunities, understanding the Victor Airbnb data is crucial. Leveraging the low regulation environment is key to maximizing your short term rental income potential. Let's dive into the specifics.
Key Victor Airbnb Performance Metrics Overview
Monthly Airbnb Revenue Variations & Income Potential in Victor (2026)
Understanding the monthly revenue variations for Airbnb listings in Victor is key to maximizing your short term rental income potential. Seasonality significantly impacts earnings. Our analysis, based on data from the past 12 months, shows that the peak revenue month for STRs in Victor is typically July, while April often presents the lowest earnings, highlighting opportunities for strategic pricing adjustments during shoulder and low seasons. Explore the typical Airbnb income in Victor across different performance tiers:
- Best-in-class properties (Top 10%) achieve $9,601+ monthly, often utilizing dynamic pricing and superior guest experiences.
- Strong performing properties (Top 25%) earn $5,844 or more, indicating effective management and desirable locations/amenities.
- Typical properties (Median) generate around $3,643 per month, representing the average market performance.
- Entry-level properties (Bottom 25%) see earnings around $2,201, often with potential for optimization.
Average Monthly Airbnb Earnings Trend in Victor
Victor Airbnb Occupancy Rate Trends (2026)
Maximize your bookings by understanding the Victor STR occupancy trends. Seasonal demand shifts significantly influence how often properties are booked. Typically, Julysees the highest demand (peak season occupancy), while January experiences the lowest (low season). Effective strategies, like adjusting minimum stays or offering promotions, can boost occupancy during slower periods. Here's how different property tiers perform in Victor:
- Best-in-class properties (Top 10%) achieve 80%+ occupancy, indicating high desirability and potentially optimized availability.
- Strong performing properties (Top 25%) maintain 66% or higher occupancy, suggesting good market fit and guest satisfaction.
- Typical properties (Median) have an occupancy rate around 46%.
- Entry-level properties (Bottom 25%) average 28% occupancy, potentially facing higher vacancy.
Average Monthly Occupancy Rate Trend in Victor
Average Daily Rate (ADR) Airbnb Trends in Victor (2026)
Effective short term rental pricing strategy in Victor involves understanding monthly ADR fluctuations. The Average Daily Rate (ADR) for Airbnb in Victor typically peaks in September and dips lowest during April. Leveraging Airbnb dynamic pricing tools or strategies based on this seasonality can significantly boost revenue. Here's a look at the typical nightly rates achieved:
- Best-in-class properties (Top 10%) command rates of $647+ per night, often due to premium features or locations.
- Strong performing properties (Top 25%) achieve nightly rates of $397 or more.
- Typical properties (Median) charge around $258 per night.
- Entry-level properties (Bottom 25%) earn around $179 per night.
Average Daily Rate (ADR) Trend by Month in Victor
Get Live Victor Market Intelligence 👇

Explore Real-time Analytics
Airbnb Seasonality Analysis & Trends in Victor (2026)
Peak Season (July, August, June)
- Revenue averages $7,696 per month
- Occupancy rates average 69.0%
- Daily rates average $366
Shoulder Season
- Revenue averages $4,203 per month
- Occupancy maintains around 44.5%
- Daily rates hold near $329
Low Season (April, November, December)
- Revenue drops to average $2,829 per month
- Occupancy decreases to average 31.0%
- Daily rates adjust to average $318
Seasonality Insights for Victor
- The Airbnb seasonality in Victor shows highly seasonal trends requiring careful strategy. While the sections above show seasonal averages, it's also insightful to look at the extremes:
- During the high season, the absolute peak month showcases Victor's highest earning potential, with monthly revenues capable of climbing to $8,588, occupancy reaching a high of 74.1%, and ADRs peaking at $376.
- Conversely, the slowest single month of the year, typically falling within the low season, marks the market's lowest point. In this month, revenue might dip to $2,609, occupancy could drop to 26.4%, and ADRs may adjust down to $282.
- Understanding both the seasonal averages and these monthly peaks and troughs in revenue, occupancy, and ADR is crucial for maximizing your Airbnb profit potential in Victor.
Seasonal Strategies for Maximizing Profit
- Peak Season: Maximize revenue through premium pricing and potentially longer minimum stays. Ensure high availability.
- Low Season: Offer competitive pricing, special promotions (e.g., extended stay discounts), and flexible cancellation policies. Target off-season travelers like remote workers or budget-conscious guests.
- Shoulder Seasons: Implement dynamic pricing that balances peak and low rates. Target weekend travelers or specific events. Offer slightly more flexible terms than peak season.
- Regularly analyze your own performance against these Victor seasonality benchmarks and adjust your pricing and availability strategy accordingly.
Best Areas for Airbnb Investment in Victor (2026)
Exploring the top neighborhoods for short-term rentals in Victor? This section highlights key areas, outlining why they are attractive for hosts and guests, along with notable local attractions. Consider these locations based on your target guest profile and investment strategy.
| Neighborhood / Area | Why Host Here? (Target Guests & Appeal) | Key Attractions & Landmarks |
|---|---|---|
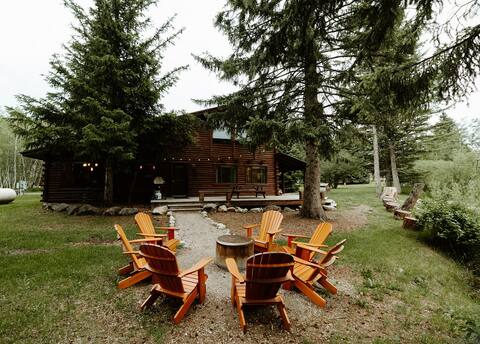
| Downtown Victor | The heart of Victor, offering a mix of locally-owned businesses, restaurants, and cultural experiences. Attracts visitors looking to explore the charm of small-town Idaho with easy access to outdoor activities. | Victor City Park, Victor Valley Market, Local galleries, The Knotty Pine, Summer concerts in the park |
| Teton Springs | A luxury resort community adjacent to the Teton National Forest, known for its beautiful landscapes and outdoor recreational opportunities. Ideal for travelers seeking a high-end getaway in nature. | Teton Springs Golf Course, Spa and wellness center, World-class fishing, Hiking trails, Wildlife viewing |
| Driggs | Just a short drive from Victor, Driggs is known for its small-town charm and proximity to Teton Pass. Popular for visitors seeking outdoor adventures like skiing, hiking, and mountain biking. | Grand Targhee Ski Resort, Driggs City Center, Teton Valley Historical Museum, Farmers market, Teton Valley Lodge |
| Teton Valley | A beautiful region that encompasses multiple small towns, offering a perfect base for exploring the Teton Range. Great for nature lovers and adventure seekers. | Teton National Park, Jackson Hole, Hot air balloon rides, Wildflower festival, Northeast corner of the valley |
| Victor Idaho Falls Road | A scenic route that connects Victor to Idaho Falls, featuring beautiful landscapes and easy access to the National Forest. Perfect for road trippers and nature enthusiasts. | National Forest trails, Fishing spots, Picnic areas, Scenic overlooks, Stargazing |
| Star Valley | Known for its expansive scenic views and outdoor activities, Star Valley offers a rural escape that's close to the Tetons. Appeals to families and nature enthusiasts. | Star Valley Ranch, Snowmobiling, Horseback riding, Wildlife watching, Fishing in local lakes |
| Wilmot Woods | A quiet and secluded area that provides a tranquil setting for guests looking to escape the hustle and bustle. Ideal for those seeking peace and connection with nature. | Hiking trails, Wildlife habitat, Photography spots, Private cabins, Nature retreats |
| Swan Valley | Located along the Snake River, Swan Valley is known for its picturesque scenery and outdoor activities. Attracts fishing and rafting enthusiasts. | River rafting, Fishing spots, Hiking trails, Scenic drives, Local dining options |
Understanding Airbnb License Requirements & STR Laws in Victor (2026)
While Victor, Idaho, United States currently shows low STR regulations, specific Airbnb license requirements might still exist or change. Always verify the latest short term rental regulations and Airbnb license requirements directly with local government authorities for Victor to ensure full compliance before hosting.
(Source: AirROI data, 2026, finding no licensed listings among those analyzed)
Top Performing Airbnb Properties in Victor (2026)
Benchmark your potential! Explore examples of top-performing Airbnb properties in Victorbased on Trailing Twelve Month (TTM) revenue. Analyze their characteristics, revenue, occupancy rate, and ADR to understand what drives success in this market.

Fairway to the Tetons
Entire Place • 6 bedrooms
MCR: Cozy Log Ranch House
Entire Place • 5 bedrooms
Mountain Modern Retreat w/Hot Tub
Entire Place • 4 bedrooms

Dunn Cabin at Bronze Buffalo Ranch
Entire Place • 5 bedrooms

Teton Meadow House - Wheelchair accessible home
Entire Place • 3 bedrooms
Fennario Cabin at Bronze Buffalo Ranch
Entire Place • 5 bedrooms
Note: Performance varies based on location, size, amenities, seasonality, and management quality. Data reflects the past 12 months.
Top Performing Airbnb Hosts in Victor (2026)
Learn from the best! This table showcases top-performing Airbnb hosts in Victor based on the number of properties managed and estimated total revenue over the past year. Analyze their scale and performance metrics.
| Host Name | Properties | Grossing Revenue | Stay Reviews | Avg Rating |
|---|---|---|---|---|
| BJ @ Teton Homestead | 17 | $1,003,920 | 796 | 4.92/5.0 |
| Western Property Management | 16 | $938,575 | 251 | 4.91/5.0 |
| Bronze Buffalo | 18 | $772,697 | 138 | 4.96/5.0 |
| Jim | 9 | $645,038 | 630 | 4.95/5.0 |
| Matt | 7 | $505,876 | 356 | 4.95/5.0 |
| Teton Valley Property Manageme | 11 | $437,726 | 310 | 4.89/5.0 |
| Thomas | 7 | $435,282 | 710 | 4.91/5.0 |
| Karleen | 1 | $291,735 | 16 | 4.94/5.0 |
| Lauranna | 3 | $273,979 | 217 | 5.00/5.0 |
| Desta | 2 | $258,472 | 92 | 5.00/5.0 |
Analyzing the strategies of top hosts, such as their property selection, pricing, and guest communication, can offer valuable lessons for optimizing your own Airbnb operations in Victor.
Dive Deeper: Advanced Victor STR Market Data (2026)
Ready to unlock more insights? AirROI provides access to advanced metrics and comprehensive Airbnb data for Victor. Explore detailed analytics beyond this report to refine your investment strategy, optimize pricing, and maximize your vacation rental profits.
Explore Advanced MetricsVictor Short-Term Rental Market Composition (2026): Property & Room Types
Room Type Distribution
Property Type Distribution
Market Composition Insights for Victor
- The Victor Airbnb market composition is heavily skewed towards Entire Home/Apt listings, which make up 93.8% of the 338 active rentals. This indicates strong guest preference for privacy and space.
- Looking at the property type distribution in Victor, House properties are the most common (52.1%), reflecting the local real estate landscape.
- Houses represent a significant 52.1% portion, catering likely to families or larger groups.
- Smaller segments like hotel/boutique, unique stays (combined 4.4%) offer potential for unique stay experiences.
Victor Airbnb Room Capacity Analysis (2026): Bedroom Distribution
Distribution of Listings by Number of Bedrooms
Room Capacity Insights for Victor
- The dominant room capacity in Victor is 2 bedrooms listings, making up 27.2% of the market. This suggests a strong demand for properties suitable for couples or solo travelers.
- Together, 2 bedrooms and 3 bedrooms properties represent 48.5% of the active Airbnb listings in Victor, indicating a high concentration in these sizes.
- A significant 44.1% of listings offer 3+ bedrooms, catering to larger groups and families seeking more space in Victor.
Victor Vacation Rental Guest Capacity Trends (2026)
Distribution of Listings by Guest Capacity
Guest Capacity Insights for Victor
- The most common guest capacity trend in Victor vacation rentals is listings accommodating 8+ guests (30.5%). This suggests the primary traveler segment is likely larger groups.
- Properties designed for 8+ guests and 4 guests dominate the Victor STR market, accounting for 55.1% of listings.
- 53.0% of properties accommodate 6+ guests, serving the market segment for larger families or group travel in Victor.
- On average, properties in Victor are equipped to host 5.3 guests.
Victor Airbnb Booking Patterns (2026): Available vs. Booked Days
Available Days Distribution
Booked Days Distribution
Booking Pattern Insights for Victor
- The most common availability pattern in Victor falls within the 181-270 days range, representing 44.4% of listings. This suggests many properties have significant open periods on their calendars.
- Approximately 76.9% of listings show high availability (181+ days open annually), indicating potential for increased bookings or specific owner usage patterns.
- For booked days, the 91-180 days range is most frequent in Victor (45%), reflecting common guest stay durations or potential owner blocking patterns.
- A notable 25.5% of properties secure long booking periods (181+ days booked per year), highlighting successful long-term rental strategies or significant owner usage.
Victor Airbnb Minimum Stay Requirements Analysis
Distribution of Listings by Minimum Night Requirement
1 Night
61 listings
18.1% of total
2 Nights
54 listings
16% of total
3 Nights
29 listings
8.6% of total
4-6 Nights
23 listings
6.8% of total
7-29 Nights
13 listings
3.9% of total
30+ Nights
157 listings
46.6% of total
Key Insights
- The most prevalent minimum stay requirement in Victor is 30+ Nights, adopted by 46.6% of listings. This highlights the market's preference for longer commitments.
- A significant segment (46.6%) caters to monthly stays (30+ nights) in Victor, pointing to opportunities in the extended-stay market.
Recommendations
- Align with the market by considering a 30+ Nights minimum stay, as 46.6% of Victor hosts use this setting.
- If feasible, allowing 1-night stays, especially midweek or during low season, could capture last-minute bookings, as only 18.1% currently do.
- Explore offering discounts for stays of 30+ nights to attract the 46.6% of the market seeking extended stays.
- Adjust minimum nights based on seasonality – potentially shorter during low season and longer during peak demand periods in Victor.
Victor Airbnb Cancellation Policy Trends Analysis (2026)
Super Strict 30 Days
2 listings
0.6% of total
Super Strict 60 Days
1 listings
0.3% of total
Limited
12 listings
3.6% of total
Flexible
26 listings
7.7% of total
Moderate
98 listings
29.1% of total
Firm
155 listings
46% of total
Strict
43 listings
12.8% of total
Cancellation Policy Insights for Victor
- The prevailing Airbnb cancellation policy trend in Victor is Firm, used by 46% of listings.
- A majority (58.8%) of hosts in Victor utilize Firm or Strict policies, indicating a market where hosts prioritize booking security.
Recommendations for Hosts
- Consider adopting a Firm policy to align with the 46% market standard in Victor.
- Using a Strict policy might deter some guests, as only 12.8% of listings use it. Evaluate if potential revenue protection outweighs possible lower booking rates.
- Regularly review your cancellation policy against competitors and market demand shifts in Victor.
Victor STR Booking Lead Time Analysis (2026)
Average Booking Lead Time by Month
Booking Lead Time Insights for Victor
- The overall average booking lead time for vacation rentals in Victor is 80 days.
- Guests book furthest in advance for stays during June (average 102 days), likely coinciding with peak travel demand or local events.
- The shortest booking windows occur for stays in January (average 55 days), indicating more last-minute travel plans during this time.
- Seasonally, Summer (98 days avg.) sees the longest lead times, while Winter (60 days avg.) has the shortest, reflecting typical travel planning cycles.
Recommendations for Hosts
- Use the overall average lead time (80 days) as a baseline for your pricing and availability strategy in Victor.
- For June stays, consider implementing length-of-stay discounts or slightly higher rates for bookings made less than 102 days out to capitalize on advance planning.
- Target marketing efforts for the Summer season well in advance (at least 98 days) to capture early planners.
- Monitor your own booking lead times against these Victor averages to identify opportunities for dynamic pricing adjustments.
Popular & Essential Airbnb Amenities in Victor (2026)
Amenity Prevalence
Amenity Insights for Victor
- Essential amenities in Victor that guests expect include: Free parking on premises, Wifi, Smoke alarm, Heating. Lacking these (any) could significantly impact bookings.
- Popular amenities like Hot water, Coffee maker, TV are common but not universal. Offering these can provide a competitive edge.
Recommendations for Hosts
- Ensure your listing includes all essential amenities for Victor: Free parking on premises, Wifi, Smoke alarm, Heating.
- Prioritize adding missing essentials: Free parking on premises, Wifi, Smoke alarm, Heating.
- Consider adding popular differentiators like Hot water or Coffee maker to increase appeal.
- Highlight unique or less common amenities you offer (e.g., hot tub, dedicated workspace, EV charger) in your listing description and photos.
- Regularly check competitor amenities in Victor to stay competitive.
Victor Airbnb Guest Demographics & Profile Analysis (2026)
Guest Profile Summary for Victor
- The typical guest profile for Airbnb in Victor consists of primarily domestic travelers (92%), often arriving from nearby Salt Lake City, typically belonging to the Post-2000s (Gen Z/Alpha) group (50%), primarily speaking English or Spanish.
- Domestic travelers account for 92.3% of guests.
- Key international markets include United States (92.3%) and United Kingdom (1.2%).
- Top languages spoken are English (69.5%) followed by Spanish (9.4%).
- A significant demographic segment is the Post-2000s (Gen Z/Alpha) group, representing 50% of guests.
Recommendations for Hosts
- Target domestic marketing efforts towards travelers from Salt Lake City and New York.
- Tailor amenities and listing descriptions to appeal to the dominant Post-2000s (Gen Z/Alpha) demographic (e.g., highlight fast WiFi, smart home features, local guides).
- Highlight unique local experiences or amenities relevant to the primary guest profile.
- Consider seasonal promotions aligned with peak travel times for key origin markets.
Nearby Short-Term Rental Market Comparison
How does the Victor Airbnb market stack up against its neighbors? Compare key performance metrics like average monthly revenue, ADR, and occupancy rates in surrounding areas to understand the broader regional STR landscape.
| Market | Active Properties | Monthly Revenue | Daily Rate | Avg. Occupancy |
|---|---|---|---|---|
| Teton Village | 283 | $8,166 | $913.82 | 43% |
| Jackson | 349 | $6,568 | $588.79 | 47% |
| Fish Haven | 61 | $6,044 | $855.41 | 33% |
| Wilson | 259 | $4,662 | $481.18 | 48% |
| Island Park | 1,029 | $4,306 | $436.45 | 47% |
| Driggs | 374 | $3,923 | $330.77 | 49% |
| Tetonia | 113 | $3,918 | $334.73 | 47% |
| West Yellowstone | 293 | $3,896 | $390.58 | 45% |
| Alpine | 48 | $3,421 | $369.84 | 43% |
| Ashton | 99 | $3,082 | $364.25 | 43% |