Mullan Airbnb Market Analysis 2026: Short Term Rental Data & Vacation Rental Statistics in Idaho, United States
Is Airbnb profitable in Mullan in 2026? Explore comprehensive Airbnb analytics for Mullan, Idaho, United States to uncover income potential. This 2026 STR market report for Mullan, based on AirROI data from February 2025 to January 2026, reveals key trends in the niche market of 20 active listings.
Whether you're considering an Airbnb investment in Mullan, optimizing your existing vacation rental, or exploring rental arbitrage opportunities, understanding the Mullan Airbnb data is crucial. Leveraging the low regulation environment is key to maximizing your short term rental income potential. Let's dive into the specifics.
Key Mullan Airbnb Performance Metrics Overview
Monthly Airbnb Revenue Variations & Income Potential in Mullan (2026)
Understanding the monthly revenue variations for Airbnb listings in Mullan is key to maximizing your short term rental income potential. Seasonality significantly impacts earnings. Our analysis, based on data from the past 12 months, shows that the peak revenue month for STRs in Mullan is typically August, while May often presents the lowest earnings, highlighting opportunities for strategic pricing adjustments during shoulder and low seasons. Explore the typical Airbnb income in Mullan across different performance tiers:
- Best-in-class properties (Top 10%) achieve $4,363+ monthly, often utilizing dynamic pricing and superior guest experiences.
- Strong performing properties (Top 25%) earn $2,812 or more, indicating effective management and desirable locations/amenities.
- Typical properties (Median) generate around $1,759 per month, representing the average market performance.
- Entry-level properties (Bottom 25%) see earnings around $1,015, often with potential for optimization.
Average Monthly Airbnb Earnings Trend in Mullan
Mullan Airbnb Occupancy Rate Trends (2026)
Maximize your bookings by understanding the Mullan STR occupancy trends. Seasonal demand shifts significantly influence how often properties are booked. Typically, Junesees the highest demand (peak season occupancy), while May experiences the lowest (low season). Effective strategies, like adjusting minimum stays or offering promotions, can boost occupancy during slower periods. Here's how different property tiers perform in Mullan:
- Best-in-class properties (Top 10%) achieve 63%+ occupancy, indicating high desirability and potentially optimized availability.
- Strong performing properties (Top 25%) maintain 48% or higher occupancy, suggesting good market fit and guest satisfaction.
- Typical properties (Median) have an occupancy rate around 34%.
- Entry-level properties (Bottom 25%) average 20% occupancy, potentially facing higher vacancy.
Average Monthly Occupancy Rate Trend in Mullan
Average Daily Rate (ADR) Airbnb Trends in Mullan (2026)
Effective short term rental pricing strategy in Mullan involves understanding monthly ADR fluctuations. The Average Daily Rate (ADR) for Airbnb in Mullan typically peaks in June and dips lowest during March. Leveraging Airbnb dynamic pricing tools or strategies based on this seasonality can significantly boost revenue. Here's a look at the typical nightly rates achieved:
- Best-in-class properties (Top 10%) command rates of $291+ per night, often due to premium features or locations.
- Strong performing properties (Top 25%) achieve nightly rates of $203 or more.
- Typical properties (Median) charge around $153 per night.
- Entry-level properties (Bottom 25%) earn around $127 per night.
Average Daily Rate (ADR) Trend by Month in Mullan
Get Live Mullan Market Intelligence 👇

Explore Real-time Analytics
Airbnb Seasonality Analysis & Trends in Mullan (2026)
Peak Season (August, June, July)
- Revenue averages $3,200 per month
- Occupancy rates average 45.8%
- Daily rates average $191
Shoulder Season
- Revenue averages $2,066 per month
- Occupancy maintains around 34.7%
- Daily rates hold near $183
Low Season (April, May, October)
- Revenue drops to average $1,550 per month
- Occupancy decreases to average 28.7%
- Daily rates adjust to average $182
Seasonality Insights for Mullan
- The Airbnb seasonality in Mullan shows highly seasonal trends requiring careful strategy. While the sections above show seasonal averages, it's also insightful to look at the extremes:
- During the high season, the absolute peak month showcases Mullan's highest earning potential, with monthly revenues capable of climbing to $3,484, occupancy reaching a high of 51.0%, and ADRs peaking at $196.
- Conversely, the slowest single month of the year, typically falling within the low season, marks the market's lowest point. In this month, revenue might dip to $1,441, occupancy could drop to 28.0%, and ADRs may adjust down to $171.
- Understanding both the seasonal averages and these monthly peaks and troughs in revenue, occupancy, and ADR is crucial for maximizing your Airbnb profit potential in Mullan.
Seasonal Strategies for Maximizing Profit
- Peak Season: Maximize revenue through premium pricing and potentially longer minimum stays. Ensure high availability.
- Low Season: Offer competitive pricing, special promotions (e.g., extended stay discounts), and flexible cancellation policies. Target off-season travelers like remote workers or budget-conscious guests.
- Shoulder Seasons: Implement dynamic pricing that balances peak and low rates. Target weekend travelers or specific events. Offer slightly more flexible terms than peak season.
- Regularly analyze your own performance against these Mullan seasonality benchmarks and adjust your pricing and availability strategy accordingly.
Best Areas for Airbnb Investment in Mullan (2026)
Exploring the top neighborhoods for short-term rentals in Mullan? This section highlights key areas, outlining why they are attractive for hosts and guests, along with notable local attractions. Consider these locations based on your target guest profile and investment strategy.
| Neighborhood / Area | Why Host Here? (Target Guests & Appeal) | Key Attractions & Landmarks |
|---|---|---|
| Cabin Creek | Secluded and serene, Cabin Creek offers a unique opportunity for those looking to escape the hustle of urban living. This area is perfect for nature lovers and those seeking a peaceful getaway. | Cabin Creek Falls, Hiking Trails, Fishing Spots, Wildlife Viewing |
| Wallace | A historic gem in the heart of the Silver Valley, Wallace attracts visitors interested in mining history and outdoor activities. Known for its charming downtown and nearby ski resorts. | Silverton Historic District, The Mining Museum, Lookout Pass Ski Area, Pioneer Park |
| Park City | With its renowned ski resorts and vibrant arts scene, Park City is a popular destination year-round, attracting tourists for both winter sports and summer activities. | Park City Mountain, Deer Valley Resort, Main Street, Sundance Film Festival |
| Coeur d'Alene | Famous for its stunning lake and outdoor recreational opportunities, Coeur d'Alene is a sought-after location for tourists looking to enjoy watersports and hiking. | Coeur d'Alene Lake, Tubbs Hill, McEuen Park, The Coeur d'Alene Resort Spa |
| Sandpoint | Nestled by Lake Pend Oreille, Sandpoint is ideal for those seeking a picturesque town with outdoor adventures, arts, and culture. | Lake Pend Oreille, Schweitzer Mountain Resort, Sandpoint City Beach, Festival at Sandpoint |
| Spokane | As the largest city in the region, Spokane offers a combination of urban amenities and access to outdoor activities, catering to a wide range of travelers. | Riverfront Park, Northwest Museum of Arts and Culture, Spokane Falls, Manito Park |
| Priest Lake | A beautiful destination for water enthusiasts and nature lovers, Priest Lake's serene atmosphere makes it ideal for relaxation and adventure. | Priest Lake State Park, Lower Priest Lake, Fishing and Boating, Hiking Trails |
| Idaho Panhandle National Forests | This vast area offers incredible opportunities for camping, hiking, and enjoying nature, catering to those who want to immerse themselves in the great outdoors. | Hundred of Miles of Trails, Camping Sites, Wildlife Watching, Scenic Views |
Understanding Airbnb License Requirements & STR Laws in Mullan (2026)
While Mullan, Idaho, United States currently shows low STR regulations, specific Airbnb license requirements might still exist or change. Always verify the latest short term rental regulations and Airbnb license requirements directly with local government authorities for Mullan to ensure full compliance before hosting.
(Source: AirROI data, 2026, finding no licensed listings among those analyzed)
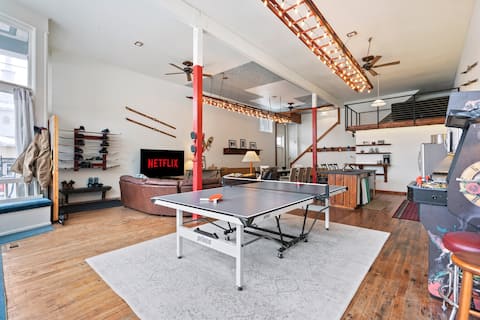
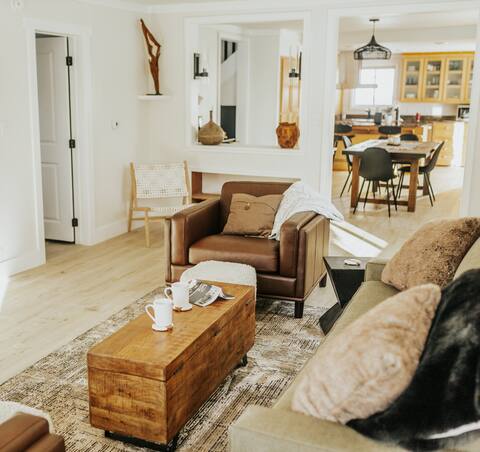
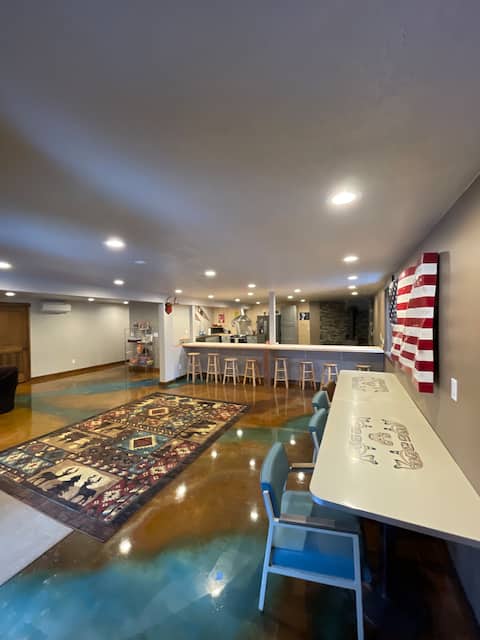
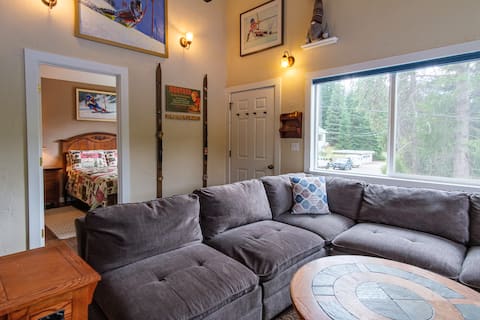
Top Performing Airbnb Properties in Mullan (2026)
Benchmark your potential! Explore examples of top-performing Airbnb properties in Mullanbased on Trailing Twelve Month (TTM) revenue. Analyze their characteristics, revenue, occupancy rate, and ADR to understand what drives success in this market.
Harwood Building - BEST Family - SKI - BIKE
Entire Place • 4 bedrooms
Mullan Mountain Lodge
Entire Place • 2 bedrooms

Mullan SKI Lodge-Closest to Lookout! Pet n’ Patio
Entire Place • 4 bedrooms
Scän Haus
Entire Place • 4 bedrooms

Rustic Private Cottage Close to Skiing
Entire Place • 2 bedrooms
The Hiawatha Hideaway *recommend 4WD/AWD in winter
Entire Place • 3 bedrooms
Note: Performance varies based on location, size, amenities, seasonality, and management quality. Data reflects the past 12 months.
Top Performing Airbnb Hosts in Mullan (2026)
Learn from the best! This table showcases top-performing Airbnb hosts in Mullan based on the number of properties managed and estimated total revenue over the past year. Analyze their scale and performance metrics.
| Host Name | Properties | Grossing Revenue | Stay Reviews | Avg Rating |
|---|---|---|---|---|
| Jake | 4 | $148,579 | 391 | 4.93/5.0 |
| Mary | 1 | $35,952 | 33 | 5.00/5.0 |
| Nathan | 1 | $29,650 | 13 | 5.00/5.0 |
| Jayme | 1 | $29,083 | 177 | 4.78/5.0 |
| Josh | 1 | $28,081 | 38 | 4.97/5.0 |
| Ericka | 1 | $25,020 | 55 | 4.71/5.0 |
| Heidi | 3 | $22,397 | 29 | 4.97/5.0 |
| Michael | 1 | $18,904 | 24 | 4.67/5.0 |
| Liz | 1 | $18,480 | 25 | 4.96/5.0 |
| Victor | 1 | $12,987 | 23 | 4.78/5.0 |
Analyzing the strategies of top hosts, such as their property selection, pricing, and guest communication, can offer valuable lessons for optimizing your own Airbnb operations in Mullan.
Dive Deeper: Advanced Mullan STR Market Data (2026)
Ready to unlock more insights? AirROI provides access to advanced metrics and comprehensive Airbnb data for Mullan. Explore detailed analytics beyond this report to refine your investment strategy, optimize pricing, and maximize your vacation rental profits.
Explore Advanced MetricsMullan Short-Term Rental Market Composition (2026): Property & Room Types
Room Type Distribution
Property Type Distribution
Market Composition Insights for Mullan
- The Mullan Airbnb market composition is heavily skewed towards Entire Home/Apt listings, which make up 90% of the 20 active rentals. This indicates strong guest preference for privacy and space.
- Looking at the property type distribution in Mullan, House properties are the most common (60%), reflecting the local real estate landscape.
- Houses represent a significant 60% portion, catering likely to families or larger groups.
- The presence of 10% Hotel/Boutique listings indicates integration with traditional hospitality.
Mullan Airbnb Room Capacity Analysis (2026): Bedroom Distribution
Distribution of Listings by Number of Bedrooms
Room Capacity Insights for Mullan
- The dominant room capacity in Mullan is 2 bedrooms listings, making up 35% of the market. This suggests a strong demand for properties suitable for couples or solo travelers.
- Together, 2 bedrooms and 1 bedroom properties represent 60.0% of the active Airbnb listings in Mullan, indicating a high concentration in these sizes.
- A significant 40.0% of listings offer 3+ bedrooms, catering to larger groups and families seeking more space in Mullan.
Mullan Vacation Rental Guest Capacity Trends (2026)
Distribution of Listings by Guest Capacity
Guest Capacity Insights for Mullan
- The most common guest capacity trend in Mullan vacation rentals is listings accommodating 8+ guests (35%). This suggests the primary traveler segment is likely larger groups.
- Properties designed for 8+ guests and 4 guests dominate the Mullan STR market, accounting for 60.0% of listings.
- 50.0% of properties accommodate 6+ guests, serving the market segment for larger families or group travel in Mullan.
- On average, properties in Mullan are equipped to host 5.5 guests.
Mullan Airbnb Booking Patterns (2026): Available vs. Booked Days
Available Days Distribution
Booked Days Distribution
Booking Pattern Insights for Mullan
- The most common availability pattern in Mullan falls within the 271-366 days range, representing 50% of listings. This suggests many properties have significant open periods on their calendars.
- Approximately 90.0% of listings show high availability (181+ days open annually), indicating potential for increased bookings or specific owner usage patterns.
- For booked days, the 91-180 days range is most frequent in Mullan (45%), reflecting common guest stay durations or potential owner blocking patterns.
- A notable 10.0% of properties secure long booking periods (181+ days booked per year), highlighting successful long-term rental strategies or significant owner usage.
Mullan Airbnb Minimum Stay Requirements Analysis
Distribution of Listings by Minimum Night Requirement
1 Night
7 listings
35% of total
2 Nights
8 listings
40% of total
30+ Nights
5 listings
25% of total
Key Insights
- The most prevalent minimum stay requirement in Mullan is 2 Nights, adopted by 40% of listings. This highlights the market's preference for shorter, flexible bookings.
- A strong majority (75.0%) of the Mullan Airbnb data shows acceptance of very short stays (1-2 nights), indicating a dynamic, high-turnover market.
- A significant segment (25%) caters to monthly stays (30+ nights) in Mullan, pointing to opportunities in the extended-stay market.
Recommendations
- Align with the market by considering a 2 Nights minimum stay, as 40% of Mullan hosts use this setting.
- Explore offering discounts for stays of 30+ nights to attract the 25% of the market seeking extended stays.
- Adjust minimum nights based on seasonality – potentially shorter during low season and longer during peak demand periods in Mullan.
Mullan Airbnb Cancellation Policy Trends Analysis (2026)
Flexible
2 listings
10% of total
Moderate
6 listings
30% of total
Firm
12 listings
60% of total
Cancellation Policy Insights for Mullan
- The prevailing Airbnb cancellation policy trend in Mullan is Firm, used by 60% of listings.
- A majority (60.0%) of hosts in Mullan utilize Firm or Strict policies, indicating a market where hosts prioritize booking security.
Recommendations for Hosts
- Consider adopting a Firm policy to align with the 60% market standard in Mullan.
- Regularly review your cancellation policy against competitors and market demand shifts in Mullan.
Mullan STR Booking Lead Time Analysis (2026)
Average Booking Lead Time by Month
Booking Lead Time Insights for Mullan
- The overall average booking lead time for vacation rentals in Mullan is 51 days.
- Guests book furthest in advance for stays during January (average 89 days), likely coinciding with peak travel demand or local events.
- The shortest booking windows occur for stays in May (average 24 days), indicating more last-minute travel plans during this time.
- Seasonally, Winter (68 days avg.) sees the longest lead times, while Fall (35 days avg.) has the shortest, reflecting typical travel planning cycles.
Recommendations for Hosts
- Use the overall average lead time (51 days) as a baseline for your pricing and availability strategy in Mullan.
- For January stays, consider implementing length-of-stay discounts or slightly higher rates for bookings made less than 89 days out to capitalize on advance planning.
- Target marketing efforts for the Winter season well in advance (at least 68 days) to capture early planners.
- Monitor your own booking lead times against these Mullan averages to identify opportunities for dynamic pricing adjustments.
Popular & Essential Airbnb Amenities in Mullan (2026)
Amenity Prevalence
Amenity Insights for Mullan
- Essential amenities in Mullan that guests expect include: Smoke alarm, TV, Wifi, Refrigerator, Heating, Hot water, Free parking on premises, Shampoo, Essentials, Coffee maker. Lacking these (any) could significantly impact bookings.
Recommendations for Hosts
- Ensure your listing includes all essential amenities for Mullan: Smoke alarm, TV, Wifi, Refrigerator, Heating, Hot water, Free parking on premises, Shampoo, Essentials, Coffee maker.
- Prioritize adding missing essentials: Refrigerator, Heating, Hot water, Free parking on premises, Shampoo, Essentials, Coffee maker.
- Highlight unique or less common amenities you offer (e.g., hot tub, dedicated workspace, EV charger) in your listing description and photos.
- Regularly check competitor amenities in Mullan to stay competitive.
Mullan Airbnb Guest Demographics & Profile Analysis (2026)
Guest Profile Summary for Mullan
- The typical guest profile for Airbnb in Mullan consists of primarily domestic travelers (99%), often arriving from nearby Spokane, typically belonging to the Post-2000s (Gen Z/Alpha) group (50%), primarily speaking English or French.
- Domestic travelers account for 98.7% of guests.
- Key international markets include United States (98.7%) and Czechia (0.7%).
- Top languages spoken are English (82.3%) followed by French (3.2%).
- A significant demographic segment is the Post-2000s (Gen Z/Alpha) group, representing 50% of guests.
Recommendations for Hosts
- Target domestic marketing efforts towards travelers from Spokane and Bozeman.
- Tailor amenities and listing descriptions to appeal to the dominant Post-2000s (Gen Z/Alpha) demographic (e.g., highlight fast WiFi, smart home features, local guides).
- Highlight unique local experiences or amenities relevant to the primary guest profile.
- Consider seasonal promotions aligned with peak travel times for key origin markets.
Nearby Short-Term Rental Market Comparison
How does the Mullan Airbnb market stack up against its neighbors? Compare key performance metrics like average monthly revenue, ADR, and occupancy rates in surrounding areas to understand the broader regional STR landscape.
| Market | Active Properties | Monthly Revenue | Daily Rate | Avg. Occupancy |
|---|---|---|---|---|
| Whitefish | 1,037 | $3,994 | $450.24 | 40% |
| Sagle | 111 | $3,870 | $433.41 | 39% |
| Hayden Lake | 11 | $3,720 | $454.25 | 43% |
| Somers | 77 | $3,484 | $405.79 | 46% |
| Hayden | 111 | $3,397 | $400.15 | 45% |
| Lakeside | 141 | $3,201 | $416.76 | 40% |
| Cocolalla | 14 | $3,170 | $377.97 | 40% |
| Post Falls | 93 | $3,106 | $326.91 | 46% |
| Dayton | 14 | $3,049 | $418.01 | 44% |
| Columbia Falls | 569 | $3,030 | $317.64 | 50% |