Mountain Home Airbnb Market Analysis 2026: Short Term Rental Data & Vacation Rental Statistics in Idaho, United States
Is Airbnb profitable in Mountain Home in 2026? Explore comprehensive Airbnb analytics for Mountain Home, Idaho, United States to uncover income potential. This 2026 STR market report for Mountain Home, based on AirROI data from February 2025 to January 2026, reveals key trends in the niche market of 38 active listings.
Whether you're considering an Airbnb investment in Mountain Home, optimizing your existing vacation rental, or exploring rental arbitrage opportunities, understanding the Mountain Home Airbnb data is crucial. Leveraging the low regulation environment is key to maximizing your short term rental income potential. Let's dive into the specifics.
Key Mountain Home Airbnb Performance Metrics Overview
Monthly Airbnb Revenue Variations & Income Potential in Mountain Home (2026)
Understanding the monthly revenue variations for Airbnb listings in Mountain Home is key to maximizing your short term rental income potential. Seasonality significantly impacts earnings. Our analysis, based on data from the past 12 months, shows that the peak revenue month for STRs in Mountain Home is typically July, while January often presents the lowest earnings, highlighting opportunities for strategic pricing adjustments during shoulder and low seasons. Explore the typical Airbnb income in Mountain Home across different performance tiers:
- Best-in-class properties (Top 10%) achieve $4,360+ monthly, often utilizing dynamic pricing and superior guest experiences.
- Strong performing properties (Top 25%) earn $3,295 or more, indicating effective management and desirable locations/amenities.
- Typical properties (Median) generate around $2,190 per month, representing the average market performance.
- Entry-level properties (Bottom 25%) see earnings around $896, often with potential for optimization.
Average Monthly Airbnb Earnings Trend in Mountain Home
Mountain Home Airbnb Occupancy Rate Trends (2026)
Maximize your bookings by understanding the Mountain Home STR occupancy trends. Seasonal demand shifts significantly influence how often properties are booked. Typically, Augustsees the highest demand (peak season occupancy), while January experiences the lowest (low season). Effective strategies, like adjusting minimum stays or offering promotions, can boost occupancy during slower periods. Here's how different property tiers perform in Mountain Home:
- Best-in-class properties (Top 10%) achieve 79%+ occupancy, indicating high desirability and potentially optimized availability.
- Strong performing properties (Top 25%) maintain 64% or higher occupancy, suggesting good market fit and guest satisfaction.
- Typical properties (Median) have an occupancy rate around 47%.
- Entry-level properties (Bottom 25%) average 28% occupancy, potentially facing higher vacancy.
Average Monthly Occupancy Rate Trend in Mountain Home
Average Daily Rate (ADR) Airbnb Trends in Mountain Home (2026)
Effective short term rental pricing strategy in Mountain Home involves understanding monthly ADR fluctuations. The Average Daily Rate (ADR) for Airbnb in Mountain Home typically peaks in October and dips lowest during February. Leveraging Airbnb dynamic pricing tools or strategies based on this seasonality can significantly boost revenue. Here's a look at the typical nightly rates achieved:
- Best-in-class properties (Top 10%) command rates of $291+ per night, often due to premium features or locations.
- Strong performing properties (Top 25%) achieve nightly rates of $187 or more.
- Typical properties (Median) charge around $141 per night.
- Entry-level properties (Bottom 25%) earn around $97 per night.
Average Daily Rate (ADR) Trend by Month in Mountain Home
Get Live Mountain Home Market Intelligence 👇

Explore Real-time Analytics
Airbnb Seasonality Analysis & Trends in Mountain Home (2026)
Peak Season (July, August, October)
- Revenue averages $3,213 per month
- Occupancy rates average 56.6%
- Daily rates average $181
Shoulder Season
- Revenue averages $2,353 per month
- Occupancy maintains around 47.3%
- Daily rates hold near $178
Low Season (January, February, March)
- Revenue drops to average $1,543 per month
- Occupancy decreases to average 35.5%
- Daily rates adjust to average $164
Seasonality Insights for Mountain Home
- The Airbnb seasonality in Mountain Home shows highly seasonal trends requiring careful strategy. While the sections above show seasonal averages, it's also insightful to look at the extremes:
- During the high season, the absolute peak month showcases Mountain Home's highest earning potential, with monthly revenues capable of climbing to $3,404, occupancy reaching a high of 59.9%, and ADRs peaking at $189.
- Conversely, the slowest single month of the year, typically falling within the low season, marks the market's lowest point. In this month, revenue might dip to $1,180, occupancy could drop to 25.7%, and ADRs may adjust down to $154.
- Understanding both the seasonal averages and these monthly peaks and troughs in revenue, occupancy, and ADR is crucial for maximizing your Airbnb profit potential in Mountain Home.
Seasonal Strategies for Maximizing Profit
- Peak Season: Maximize revenue through premium pricing and potentially longer minimum stays. Ensure high availability.
- Low Season: Offer competitive pricing, special promotions (e.g., extended stay discounts), and flexible cancellation policies. Target off-season travelers like remote workers or budget-conscious guests.
- Shoulder Seasons: Implement dynamic pricing that balances peak and low rates. Target weekend travelers or specific events. Offer slightly more flexible terms than peak season.
- Regularly analyze your own performance against these Mountain Home seasonality benchmarks and adjust your pricing and availability strategy accordingly.
Best Areas for Airbnb Investment in Mountain Home (2026)
Exploring the top neighborhoods for short-term rentals in Mountain Home? This section highlights key areas, outlining why they are attractive for hosts and guests, along with notable local attractions. Consider these locations based on your target guest profile and investment strategy.
| Neighborhood / Area | Why Host Here? (Target Guests & Appeal) | Key Attractions & Landmarks |
|---|---|---|
| Downtown Mountain Home | The central hub of activity with a variety of shops, restaurants, and business amenities. Ideal for travelers looking for convenience and local flavor. | Mountain Home City Park, Elmore County Historical Museum, Desert Canyon Golf Course, Riverside Park, Mountain Home Air Force Base |
| Mtn. Home AFB | Near the Mountain Home Air Force Base, attracting military families and personnel stationed in the area. Ideal location for longer stays and family visits. | Mountain Home Air Force Base, Saylor Creek Training Range, Fish Creek Reservoir |
| Camas County | Surrounding areas with beautiful landscapes, perfect for those seeking outdoor adventures like hiking and fishing. Appeals to nature lovers and retreat seekers. | Camas Prairie, Sawtooth National Forest, Salmon River, Camas Lake |
| Bruneau | A small community known for its dramatic landscapes and outdoor activities. Great for guests looking to explore the nearby Bruneau Dunes State Park. | Bruneau Dunes State Park, Bruneau River, Bruneau Canyon |
| Featherville | A scenic mountain town offering a peaceful retreat in nature, perfect for adventurous travelers looking for cabin stays and outdoor activities. | Featherville Campground, South Fork of the Boise River, Cycling and hiking trails |
| Horseshoe Bend | An increasingly popular area with beautiful views and access to the Payette River for outdoor recreation activities - great for summer visitors. | Payette River, Horseshoe Bend Overlook, Local biking trails |
| Sun Valley | A renowned resort area that attracts tourists year-round for skiing, mountain biking, and luxury holiday experiences. High rental demand. | Sun Valley Resort, Bald Mountain, Ketchum, Hiking trails |
| Stanley | Known for its breathtaking scenery and adventure tourism, particularly for those wanting to explore the Sawtooth Wilderness. | Sawtooth National Recreation Area, Redfish Lake, Stanley Lake |
Understanding Airbnb License Requirements & STR Laws in Mountain Home (2026)
While Mountain Home, Idaho, United States currently shows low STR regulations, specific Airbnb license requirements might still exist or change. Always verify the latest short term rental regulations and Airbnb license requirements directly with local government authorities for Mountain Home to ensure full compliance before hosting.
(Source: AirROI data, 2026, finding no licensed listings among those analyzed)
Top Performing Airbnb Properties in Mountain Home (2026)
Benchmark your potential! Explore examples of top-performing Airbnb properties in Mountain Homebased on Trailing Twelve Month (TTM) revenue. Analyze their characteristics, revenue, occupancy rate, and ADR to understand what drives success in this market.
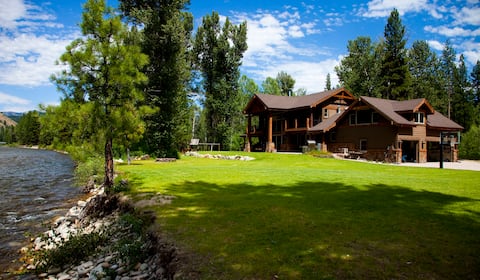
Boise River Retreat
Entire Place • 4 bedrooms

•SelfieHouse•Hot Tub•Arcade! Monthly discount!
Entire Place • 4 bedrooms
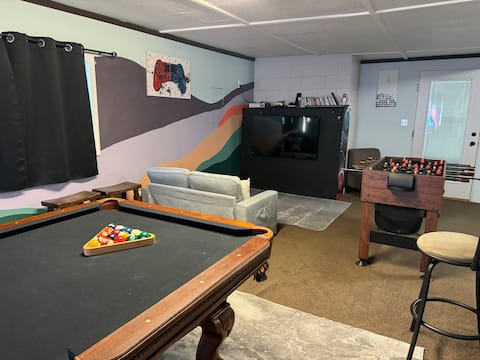
FamilyRetreat*HotTub*KingBed*GameRoom IndoorOasis*
Entire Place • 3 bedrooms
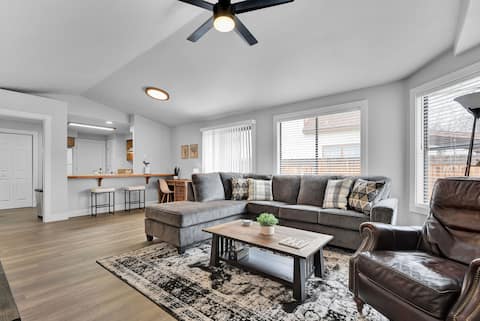
Entire 2 Bedroom 2 Bathroom House
Entire Place • 2 bedrooms

Mountain IdaHome *King Bed*Fire Pit*Back Patio*
Entire Place • 2 bedrooms

Home away from Home
Entire Place • 3 bedrooms
Note: Performance varies based on location, size, amenities, seasonality, and management quality. Data reflects the past 12 months.
Top Performing Airbnb Hosts in Mountain Home (2026)
Learn from the best! This table showcases top-performing Airbnb hosts in Mountain Home based on the number of properties managed and estimated total revenue over the past year. Analyze their scale and performance metrics.
| Host Name | Properties | Grossing Revenue | Stay Reviews | Avg Rating |
|---|---|---|---|---|
| Sheri | 1 | $72,631 | 17 | 5.00/5.0 |
| Robbie | 3 | $69,379 | 200 | 4.99/5.0 |
| Natalie | 3 | $64,033 | 92 | 4.83/5.0 |
| Michael | 2 | $54,610 | 93 | 4.70/5.0 |
| Janie | 1 | $52,529 | 152 | 4.99/5.0 |
| Mic | 1 | $45,196 | 90 | 4.97/5.0 |
| Connie | 1 | $37,495 | 99 | 4.98/5.0 |
| Amber | 1 | $37,113 | 199 | 4.94/5.0 |
| Jeff And Billie | 1 | $36,005 | 35 | 4.94/5.0 |
| Alyssa | 1 | $34,652 | 50 | 4.94/5.0 |
Analyzing the strategies of top hosts, such as their property selection, pricing, and guest communication, can offer valuable lessons for optimizing your own Airbnb operations in Mountain Home.
Dive Deeper: Advanced Mountain Home STR Market Data (2026)
Ready to unlock more insights? AirROI provides access to advanced metrics and comprehensive Airbnb data for Mountain Home. Explore detailed analytics beyond this report to refine your investment strategy, optimize pricing, and maximize your vacation rental profits.
Explore Advanced MetricsMountain Home Short-Term Rental Market Composition (2026): Property & Room Types
Room Type Distribution
Property Type Distribution
Market Composition Insights for Mountain Home
- The Mountain Home Airbnb market composition is heavily skewed towards Entire Home/Apt listings, which make up 78.9% of the 38 active rentals. This indicates strong guest preference for privacy and space.
- Looking at the property type distribution in Mountain Home, House properties are the most common (71.1%), reflecting the local real estate landscape.
- Houses represent a significant 71.1% portion, catering likely to families or larger groups.
- The presence of 13.2% Hotel/Boutique listings indicates integration with traditional hospitality.
Mountain Home Airbnb Room Capacity Analysis (2026): Bedroom Distribution
Distribution of Listings by Number of Bedrooms
Room Capacity Insights for Mountain Home
- The dominant room capacity in Mountain Home is 3 bedrooms listings, making up 26.3% of the market. This suggests a strong demand for properties suitable for families or small groups.
- Together, 3 bedrooms and 1 bedroom properties represent 47.4% of the active Airbnb listings in Mountain Home, indicating a high concentration in these sizes.
- A significant 52.7% of listings offer 3+ bedrooms, catering to larger groups and families seeking more space in Mountain Home.
Mountain Home Vacation Rental Guest Capacity Trends (2026)
Distribution of Listings by Guest Capacity
Guest Capacity Insights for Mountain Home
- The most common guest capacity trend in Mountain Home vacation rentals is listings accommodating 8+ guests (31.6%). This suggests the primary traveler segment is likely larger groups.
- Properties designed for 8+ guests and 6 guests dominate the Mountain Home STR market, accounting for 52.7% of listings.
- 55.3% of properties accommodate 6+ guests, serving the market segment for larger families or group travel in Mountain Home.
- On average, properties in Mountain Home are equipped to host 5.1 guests.
Mountain Home Airbnb Booking Patterns (2026): Available vs. Booked Days
Available Days Distribution
Booked Days Distribution
Booking Pattern Insights for Mountain Home
- The most common availability pattern in Mountain Home falls within the 91-180 days range, representing 36.8% of listings. This suggests many properties have significant open periods on their calendars.
- Approximately 63.2% of listings show high availability (181+ days open annually), indicating potential for increased bookings or specific owner usage patterns.
- For booked days, the 181-270 days range is most frequent in Mountain Home (34.2%), reflecting common guest stay durations or potential owner blocking patterns.
- A notable 36.8% of properties secure long booking periods (181+ days booked per year), highlighting successful long-term rental strategies or significant owner usage.
Mountain Home Airbnb Minimum Stay Requirements Analysis
Distribution of Listings by Minimum Night Requirement
1 Night
15 listings
39.5% of total
2 Nights
10 listings
26.3% of total
3 Nights
3 listings
7.9% of total
7-29 Nights
1 listings
2.6% of total
30+ Nights
9 listings
23.7% of total
Key Insights
- The most prevalent minimum stay requirement in Mountain Home is 1 Night, adopted by 39.5% of listings. This highlights the market's preference for shorter, flexible bookings.
- A strong majority (65.8%) of the Mountain Home Airbnb data shows acceptance of very short stays (1-2 nights), indicating a dynamic, high-turnover market.
- A significant segment (23.7%) caters to monthly stays (30+ nights) in Mountain Home, pointing to opportunities in the extended-stay market.
Recommendations
- Align with the market by considering a 1 Night minimum stay, as 39.5% of Mountain Home hosts use this setting.
- Explore offering discounts for stays of 30+ nights to attract the 23.7% of the market seeking extended stays.
- Adjust minimum nights based on seasonality – potentially shorter during low season and longer during peak demand periods in Mountain Home.
Mountain Home Airbnb Cancellation Policy Trends Analysis (2026)
Limited
1 listings
2.6% of total
Flexible
10 listings
26.3% of total
Moderate
10 listings
26.3% of total
Firm
16 listings
42.1% of total
Strict
1 listings
2.6% of total
Cancellation Policy Insights for Mountain Home
- The prevailing Airbnb cancellation policy trend in Mountain Home is Firm, used by 42.1% of listings.
- There's a relatively balanced mix between guest-friendly (52.6%) and stricter (44.7%) policies, offering choices for different guest needs.
- Strict cancellation policies are quite rare (2.6%), potentially making listings with this policy less competitive unless justified by high demand or property type.
Recommendations for Hosts
- Consider adopting a Firm policy to align with the 42.1% market standard in Mountain Home.
- Using a Strict policy might deter some guests, as only 2.6% of listings use it. Evaluate if potential revenue protection outweighs possible lower booking rates.
- Regularly review your cancellation policy against competitors and market demand shifts in Mountain Home.
Mountain Home STR Booking Lead Time Analysis (2026)
Average Booking Lead Time by Month
Booking Lead Time Insights for Mountain Home
- The overall average booking lead time for vacation rentals in Mountain Home is 37 days.
- Guests book furthest in advance for stays during October (average 53 days), likely coinciding with peak travel demand or local events.
- The shortest booking windows occur for stays in March (average 15 days), indicating more last-minute travel plans during this time.
- Seasonally, Fall (43 days avg.) sees the longest lead times, while Winter (28 days avg.) has the shortest, reflecting typical travel planning cycles.
Recommendations for Hosts
- Use the overall average lead time (37 days) as a baseline for your pricing and availability strategy in Mountain Home.
- For October stays, consider implementing length-of-stay discounts or slightly higher rates for bookings made less than 53 days out to capitalize on advance planning.
- Target marketing efforts for the Fall season well in advance (at least 43 days) to capture early planners.
- Monitor your own booking lead times against these Mountain Home averages to identify opportunities for dynamic pricing adjustments.
Popular & Essential Airbnb Amenities in Mountain Home (2026)
Amenity Prevalence
Amenity Insights for Mountain Home
- Essential amenities in Mountain Home that guests expect include: TV, Air conditioning, Smoke alarm, Wifi, Kitchen. Lacking these (any) could significantly impact bookings.
- Popular amenities like Free parking on premises, Heating, Hot water are common but not universal. Offering these can provide a competitive edge.
Recommendations for Hosts
- Ensure your listing includes all essential amenities for Mountain Home: TV, Air conditioning, Smoke alarm, Wifi, Kitchen.
- Prioritize adding missing essentials: Air conditioning, Smoke alarm, Wifi, Kitchen.
- Consider adding popular differentiators like Free parking on premises or Heating to increase appeal.
- Highlight unique or less common amenities you offer (e.g., hot tub, dedicated workspace, EV charger) in your listing description and photos.
- Regularly check competitor amenities in Mountain Home to stay competitive.
Mountain Home Airbnb Guest Demographics & Profile Analysis (2026)
Guest Profile Summary for Mountain Home
- The typical guest profile for Airbnb in Mountain Home consists of primarily domestic travelers (96%), often arriving from nearby Mountain Home, typically belonging to the Post-2000s (Gen Z/Alpha) group (50%), primarily speaking English or Spanish.
- Domestic travelers account for 96.4% of guests.
- Key international markets include United States (96.4%) and Singapore (1.1%).
- Top languages spoken are English (68.1%) followed by Spanish (10.1%).
- A significant demographic segment is the Post-2000s (Gen Z/Alpha) group, representing 50% of guests.
Recommendations for Hosts
- Target domestic marketing efforts towards travelers from Mountain Home and Boise.
- Tailor amenities and listing descriptions to appeal to the dominant Post-2000s (Gen Z/Alpha) demographic (e.g., highlight fast WiFi, smart home features, local guides).
- Highlight unique local experiences or amenities relevant to the primary guest profile.
- Consider seasonal promotions aligned with peak travel times for key origin markets.
Nearby Short-Term Rental Market Comparison
How does the Mountain Home Airbnb market stack up against its neighbors? Compare key performance metrics like average monthly revenue, ADR, and occupancy rates in surrounding areas to understand the broader regional STR landscape.
| Market | Active Properties | Monthly Revenue | Daily Rate | Avg. Occupancy |
|---|---|---|---|---|
| Filer | 12 | $3,885 | $258.16 | 50% |
| Ketchum | 403 | $3,587 | $549.88 | 36% |
| Hailey | 93 | $3,338 | $339.86 | 45% |
| Donnelly | 227 | $3,160 | $372.53 | 35% |
| Eagle | 82 | $2,745 | $210.92 | 48% |
| Garden Valley | 142 | $2,688 | $273.05 | 36% |
| Sun Valley | 315 | $2,684 | $463.57 | 31% |
| Meridian | 315 | $2,664 | $208.32 | 52% |
| McCall | 527 | $2,663 | $332.11 | 35% |
| Stanley | 96 | $2,653 | $298.19 | 45% |