Donnelly Airbnb Market Analysis 2026: Short Term Rental Data & Vacation Rental Statistics in Idaho, United States
Is Airbnb profitable in Donnelly in 2026? Explore comprehensive Airbnb analytics for Donnelly, Idaho, United States to uncover income potential. This 2026 STR market report for Donnelly, based on AirROI data from February 2025 to January 2026, reveals key trends in the market of 227 active listings.
Whether you're considering an Airbnb investment in Donnelly, optimizing your existing vacation rental, or exploring rental arbitrage opportunities, understanding the Donnelly Airbnb data is crucial. Leveraging the low regulation environment is key to maximizing your short term rental income potential. Let's dive into the specifics.
Key Donnelly Airbnb Performance Metrics Overview
Monthly Airbnb Revenue Variations & Income Potential in Donnelly (2026)
Understanding the monthly revenue variations for Airbnb listings in Donnelly is key to maximizing your short term rental income potential. Seasonality significantly impacts earnings. Our analysis, based on data from the past 12 months, shows that the peak revenue month for STRs in Donnelly is typically July, while April often presents the lowest earnings, highlighting opportunities for strategic pricing adjustments during shoulder and low seasons. Explore the typical Airbnb income in Donnelly across different performance tiers:
- Best-in-class properties (Top 10%) achieve $7,895+ monthly, often utilizing dynamic pricing and superior guest experiences.
- Strong performing properties (Top 25%) earn $4,898 or more, indicating effective management and desirable locations/amenities.
- Typical properties (Median) generate around $2,928 per month, representing the average market performance.
- Entry-level properties (Bottom 25%) see earnings around $1,602, often with potential for optimization.
Average Monthly Airbnb Earnings Trend in Donnelly
Donnelly Airbnb Occupancy Rate Trends (2026)
Maximize your bookings by understanding the Donnelly STR occupancy trends. Seasonal demand shifts significantly influence how often properties are booked. Typically, Julysees the highest demand (peak season occupancy), while April experiences the lowest (low season). Effective strategies, like adjusting minimum stays or offering promotions, can boost occupancy during slower periods. Here's how different property tiers perform in Donnelly:
- Best-in-class properties (Top 10%) achieve 66%+ occupancy, indicating high desirability and potentially optimized availability.
- Strong performing properties (Top 25%) maintain 49% or higher occupancy, suggesting good market fit and guest satisfaction.
- Typical properties (Median) have an occupancy rate around 31%.
- Entry-level properties (Bottom 25%) average 18% occupancy, potentially facing higher vacancy.
Average Monthly Occupancy Rate Trend in Donnelly
Average Daily Rate (ADR) Airbnb Trends in Donnelly (2026)
Effective short term rental pricing strategy in Donnelly involves understanding monthly ADR fluctuations. The Average Daily Rate (ADR) for Airbnb in Donnelly typically peaks in December and dips lowest during April. Leveraging Airbnb dynamic pricing tools or strategies based on this seasonality can significantly boost revenue. Here's a look at the typical nightly rates achieved:
- Best-in-class properties (Top 10%) command rates of $626+ per night, often due to premium features or locations.
- Strong performing properties (Top 25%) achieve nightly rates of $433 or more.
- Typical properties (Median) charge around $295 per night.
- Entry-level properties (Bottom 25%) earn around $214 per night.
Average Daily Rate (ADR) Trend by Month in Donnelly
Get Live Donnelly Market Intelligence 👇

Explore Real-time Analytics
Airbnb Seasonality Analysis & Trends in Donnelly (2026)
Peak Season (July, August, February)
- Revenue averages $5,922 per month
- Occupancy rates average 48.2%
- Daily rates average $388
Shoulder Season
- Revenue averages $3,949 per month
- Occupancy maintains around 32.9%
- Daily rates hold near $385
Low Season (April, May, October)
- Revenue drops to average $2,376 per month
- Occupancy decreases to average 25.6%
- Daily rates adjust to average $333
Seasonality Insights for Donnelly
- The Airbnb seasonality in Donnelly shows highly seasonal trends requiring careful strategy. While the sections above show seasonal averages, it's also insightful to look at the extremes:
- During the high season, the absolute peak month showcases Donnelly's highest earning potential, with monthly revenues capable of climbing to $7,184, occupancy reaching a high of 52.8%, and ADRs peaking at $439.
- Conversely, the slowest single month of the year, typically falling within the low season, marks the market's lowest point. In this month, revenue might dip to $1,761, occupancy could drop to 20.4%, and ADRs may adjust down to $315.
- Understanding both the seasonal averages and these monthly peaks and troughs in revenue, occupancy, and ADR is crucial for maximizing your Airbnb profit potential in Donnelly.
Seasonal Strategies for Maximizing Profit
- Peak Season: Maximize revenue through premium pricing and potentially longer minimum stays. Ensure high availability.
- Low Season: Offer competitive pricing, special promotions (e.g., extended stay discounts), and flexible cancellation policies. Target off-season travelers like remote workers or budget-conscious guests.
- Shoulder Seasons: Implement dynamic pricing that balances peak and low rates. Target weekend travelers or specific events. Offer slightly more flexible terms than peak season.
- Regularly analyze your own performance against these Donnelly seasonality benchmarks and adjust your pricing and availability strategy accordingly.
Best Areas for Airbnb Investment in Donnelly (2026)
Exploring the top neighborhoods for short-term rentals in Donnelly? This section highlights key areas, outlining why they are attractive for hosts and guests, along with notable local attractions. Consider these locations based on your target guest profile and investment strategy.
| Neighborhood / Area | Why Host Here? (Target Guests & Appeal) | Key Attractions & Landmarks |
|---|---|---|
| Lake Cascade | This stunning lake offers beautiful views and a variety of water activities, making it a perfect destination for families and outdoor enthusiasts looking to escape to nature. | Lake Cascade State Park, Cascade Raft and Kayak Tours, Fishing and boating, Nature trails, Scenic camping spots |
| Donnelly City Center | The heart of Donnelly with easy access to local shops, cafes, and restaurants, appealing to travelers who enjoy a small-town yet vibrant atmosphere. | Local boutiques, Coffee shops, Restaurants, Community events, Close to ski resorts |
| Tamarack Resort | A popular ski resort area that attracts visitors year-round for skiing, mountain biking, and hiking, perfect for those who seek adventure and luxury in one location. | Skiing and snowboarding, Mountain biking trails, Golfing in summer, Zipline tours, Spa facilities |
| Nordman | A serene area that offers a mix of tranquility and access to outdoor activities, ideal for travelers wanting a peaceful retreat amid nature. | Outdoor hiking trails, Wildlife viewing, Lake access, Quiet camping spots, Fishing spots |
| Warm Lake | A hidden gem for those looking to escape into nature with options for swimming, hiking, and fishing, drawing visitors seeking peace and scenic views. | Warm Lake Resort, Swimming and fishing, Hiking trails, Campgrounds, Wildlife viewing |
| Beach Access Areas | Areas near the beach provide direct access to water activities and relaxation, making it attractive to those who enjoy lakefront living and recreation. | Beach picnicking, Kayaking, Fishing, Scenic walks along the shore, Sunset views |
| Snowmobile Trails | Donnelly's vast snowmobile trail systems attract winter sports enthusiasts and adventure seekers, catering to an active lifestyle during winter months. | Snowmobiling, Winter hiking, Ice fishing, Winter wildlife viewing, Scenic winter landscapes |
| Cascades Scenic Byway | This scenic highway offers breathtaking views and numerous outdoor activities, drawing tourists for its stunning landscapes and accessibility to various recreational spots. | Scenic viewpoints, Hiking trails, Camping spots, Photography opportunities, Wildflower viewing in spring |
Understanding Airbnb License Requirements & STR Laws in Donnelly (2026)
While Donnelly, Idaho, United States currently shows low STR regulations, specific Airbnb license requirements might still exist or change. Always verify the latest short term rental regulations and Airbnb license requirements directly with local government authorities for Donnelly to ensure full compliance before hosting.
(Source: AirROI data, 2026, based on 1% licensed listings)
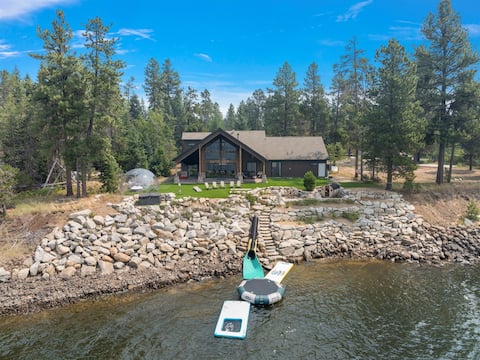
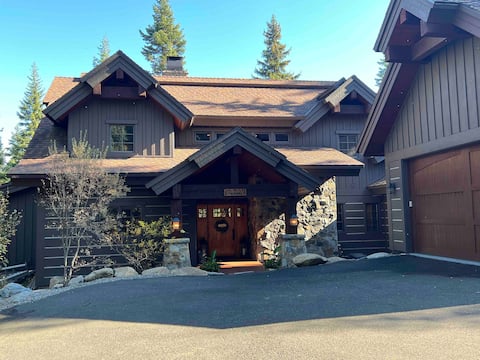
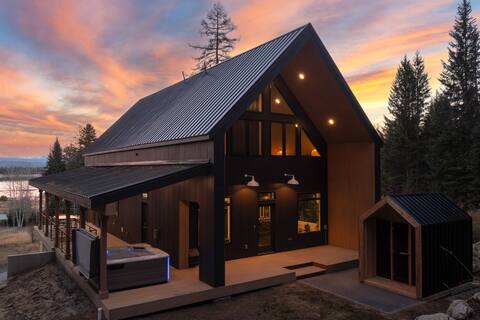
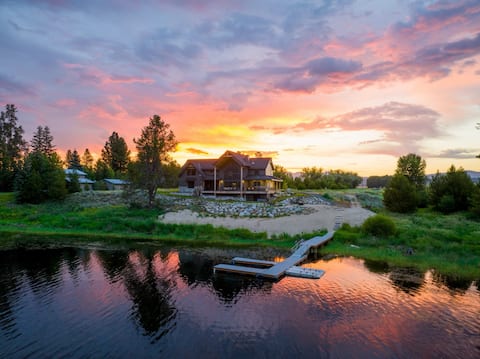
Top Performing Airbnb Properties in Donnelly (2026)
Benchmark your potential! Explore examples of top-performing Airbnb properties in Donnellybased on Trailing Twelve Month (TTM) revenue. Analyze their characteristics, revenue, occupancy rate, and ADR to understand what drives success in this market.

Private Dock-Sauna-Hot Tub-Fire Place-PatioHeaters
Entire Place • 5 bedrooms
-Lakehouse Trampoline-Hot Tub-Sauna-Climbing Wall
Entire Place • 6 bedrooms

Pinnacle Peak Estate Tamarack |6BR Retreat Pet OK
Entire Place • 6 bedrooms
Tamarack Creekside Lodge
Entire Place • 5 bedrooms
Luxe Cabin w/ Sauna, HotTub, Heated Driveway, View
Entire Place • 4 bedrooms
Large Lakeside 7 Bedroom Cabin, Private Boat Dock
Entire Place • 7 bedrooms
Note: Performance varies based on location, size, amenities, seasonality, and management quality. Data reflects the past 12 months.
Top Performing Airbnb Hosts in Donnelly (2026)
Learn from the best! This table showcases top-performing Airbnb hosts in Donnelly based on the number of properties managed and estimated total revenue over the past year. Analyze their scale and performance metrics.
| Host Name | Properties | Grossing Revenue | Stay Reviews | Avg Rating |
|---|---|---|---|---|
| Jon | 52 | $2,014,155 | 2519 | 4.77/5.0 |
| Bespoke Properties | 16 | $951,802 | 315 | 4.96/5.0 |
| Tamarack Resort | 27 | $728,657 | 40 | 4.17/5.0 |
| DoneRight Vacation Rentals | 13 | $499,312 | 183 | 4.74/5.0 |
| Matthew | 3 | $454,891 | 185 | 4.97/5.0 |
| Evolve | 10 | $274,469 | 344 | 4.84/5.0 |
| Yverse | 1 | $210,836 | 79 | 4.80/5.0 |
| Cynthia | 1 | $182,220 | 12 | 5.00/5.0 |
| Jesse | 1 | $165,359 | 113 | 4.96/5.0 |
| FrostCabins | 4 | $162,044 | 22 | 4.57/5.0 |
Analyzing the strategies of top hosts, such as their property selection, pricing, and guest communication, can offer valuable lessons for optimizing your own Airbnb operations in Donnelly.
Dive Deeper: Advanced Donnelly STR Market Data (2026)
Ready to unlock more insights? AirROI provides access to advanced metrics and comprehensive Airbnb data for Donnelly. Explore detailed analytics beyond this report to refine your investment strategy, optimize pricing, and maximize your vacation rental profits.
Explore Advanced MetricsDonnelly Short-Term Rental Market Composition (2026): Property & Room Types
Room Type Distribution
Property Type Distribution
Market Composition Insights for Donnelly
- The Donnelly Airbnb market composition is heavily skewed towards Entire Home/Apt listings, which make up 99.6% of the 227 active rentals. This indicates strong guest preference for privacy and space.
- Looking at the property type distribution in Donnelly, House properties are the most common (52%), reflecting the local real estate landscape.
- Houses represent a significant 52% portion, catering likely to families or larger groups.
- Smaller segments like unique stays (combined 0.4%) offer potential for unique stay experiences.
Donnelly Airbnb Room Capacity Analysis (2026): Bedroom Distribution
Distribution of Listings by Number of Bedrooms
Room Capacity Insights for Donnelly
- The dominant room capacity in Donnelly is 3 bedrooms listings, making up 40.1% of the market. This suggests a strong demand for properties suitable for families or small groups.
- Together, 3 bedrooms and 4 bedrooms properties represent 58.2% of the active Airbnb listings in Donnelly, indicating a high concentration in these sizes.
- A significant 72.3% of listings offer 3+ bedrooms, catering to larger groups and families seeking more space in Donnelly.
Donnelly Vacation Rental Guest Capacity Trends (2026)
Distribution of Listings by Guest Capacity
Guest Capacity Insights for Donnelly
- The most common guest capacity trend in Donnelly vacation rentals is listings accommodating 8+ guests (64.8%). This suggests the primary traveler segment is likely larger groups.
- Properties designed for 8+ guests and 6 guests dominate the Donnelly STR market, accounting for 80.7% of listings.
- 83.3% of properties accommodate 6+ guests, serving the market segment for larger families or group travel in Donnelly.
- On average, properties in Donnelly are equipped to host 6.9 guests.
Donnelly Airbnb Booking Patterns (2026): Available vs. Booked Days
Available Days Distribution
Booked Days Distribution
Booking Pattern Insights for Donnelly
- The most common availability pattern in Donnelly falls within the 271-366 days range, representing 52.9% of listings. This suggests many properties have significant open periods on their calendars.
- Approximately 89.5% of listings show high availability (181+ days open annually), indicating potential for increased bookings or specific owner usage patterns.
- For booked days, the 31-90 days range is most frequent in Donnelly (39.6%), reflecting common guest stay durations or potential owner blocking patterns.
- A notable 11.9% of properties secure long booking periods (181+ days booked per year), highlighting successful long-term rental strategies or significant owner usage.
Donnelly Airbnb Minimum Stay Requirements Analysis
Distribution of Listings by Minimum Night Requirement
1 Night
13 listings
5.8% of total
2 Nights
142 listings
62.8% of total
3 Nights
4 listings
1.8% of total
4-6 Nights
2 listings
0.9% of total
7-29 Nights
3 listings
1.3% of total
30+ Nights
62 listings
27.4% of total
Key Insights
- The most prevalent minimum stay requirement in Donnelly is 2 Nights, adopted by 62.8% of listings. This highlights the market's preference for shorter, flexible bookings.
- A strong majority (68.6%) of the Donnelly Airbnb data shows acceptance of very short stays (1-2 nights), indicating a dynamic, high-turnover market.
- A significant segment (27.4%) caters to monthly stays (30+ nights) in Donnelly, pointing to opportunities in the extended-stay market.
Recommendations
- Align with the market by considering a 2 Nights minimum stay, as 62.8% of Donnelly hosts use this setting.
- If feasible, allowing 1-night stays, especially midweek or during low season, could capture last-minute bookings, as only 5.8% currently do.
- A 2-night minimum appears standard (62.8%). Consider this for weekends or peak periods.
- Explore offering discounts for stays of 30+ nights to attract the 27.4% of the market seeking extended stays.
- Adjust minimum nights based on seasonality – potentially shorter during low season and longer during peak demand periods in Donnelly.
Donnelly Airbnb Cancellation Policy Trends Analysis (2026)
Limited
2 listings
0.9% of total
Super Strict 30 Days
61 listings
27% of total
Super Strict 60 Days
1 listings
0.4% of total
Flexible
8 listings
3.5% of total
Moderate
29 listings
12.8% of total
Firm
97 listings
42.9% of total
Strict
28 listings
12.4% of total
Cancellation Policy Insights for Donnelly
- The prevailing Airbnb cancellation policy trend in Donnelly is Firm, used by 42.9% of listings.
- A majority (55.3%) of hosts in Donnelly utilize Firm or Strict policies, indicating a market where hosts prioritize booking security.
Recommendations for Hosts
- Consider adopting a Firm policy to align with the 42.9% market standard in Donnelly.
- Using a Strict policy might deter some guests, as only 12.4% of listings use it. Evaluate if potential revenue protection outweighs possible lower booking rates.
- Regularly review your cancellation policy against competitors and market demand shifts in Donnelly.
Donnelly STR Booking Lead Time Analysis (2026)
Average Booking Lead Time by Month
Booking Lead Time Insights for Donnelly
- The overall average booking lead time for vacation rentals in Donnelly is 53 days.
- Guests book furthest in advance for stays during December (average 85 days), likely coinciding with peak travel demand or local events.
- The shortest booking windows occur for stays in April (average 26 days), indicating more last-minute travel plans during this time.
- Seasonally, Winter (68 days avg.) sees the longest lead times, while Spring (35 days avg.) has the shortest, reflecting typical travel planning cycles.
Recommendations for Hosts
- Use the overall average lead time (53 days) as a baseline for your pricing and availability strategy in Donnelly.
- For December stays, consider implementing length-of-stay discounts or slightly higher rates for bookings made less than 85 days out to capitalize on advance planning.
- Target marketing efforts for the Winter season well in advance (at least 68 days) to capture early planners.
- Monitor your own booking lead times against these Donnelly averages to identify opportunities for dynamic pricing adjustments.
Popular & Essential Airbnb Amenities in Donnelly (2026)
Amenity Prevalence
Amenity Insights for Donnelly
- Essential amenities in Donnelly that guests expect include: Free parking on premises, Smoke alarm, Heating, Hot water, Wifi, Dishes and silverware, TV, Refrigerator, Coffee maker. Lacking these (any) could significantly impact bookings.
- Popular amenities like Kitchen are common but not universal. Offering these can provide a competitive edge.
Recommendations for Hosts
- Ensure your listing includes all essential amenities for Donnelly: Free parking on premises, Smoke alarm, Heating, Hot water, Wifi, Dishes and silverware, TV, Refrigerator, Coffee maker.
- Prioritize adding missing essentials: Free parking on premises, Smoke alarm, Heating, Hot water, Wifi, Dishes and silverware, TV, Refrigerator, Coffee maker.
- Consider adding popular differentiators like Kitchen to increase appeal.
- Highlight unique or less common amenities you offer (e.g., hot tub, dedicated workspace, EV charger) in your listing description and photos.
- Regularly check competitor amenities in Donnelly to stay competitive.
Donnelly Airbnb Guest Demographics & Profile Analysis (2026)
Guest Profile Summary for Donnelly
- The typical guest profile for Airbnb in Donnelly consists of primarily domestic travelers (99%), often arriving from nearby Boise, typically belonging to the Post-2000s (Gen Z/Alpha) group (50%), primarily speaking English or Spanish.
- Domestic travelers account for 99.4% of guests.
- Key international markets include United States (99.4%) and Germany (0.2%).
- Top languages spoken are English (80.9%) followed by Spanish (9.9%).
- A significant demographic segment is the Post-2000s (Gen Z/Alpha) group, representing 50% of guests.
Recommendations for Hosts
- Target domestic marketing efforts towards travelers from Boise and Meridian.
- Tailor amenities and listing descriptions to appeal to the dominant Post-2000s (Gen Z/Alpha) demographic (e.g., highlight fast WiFi, smart home features, local guides).
- Highlight unique local experiences or amenities relevant to the primary guest profile.
- Consider seasonal promotions aligned with peak travel times for key origin markets.
Nearby Short-Term Rental Market Comparison
How does the Donnelly Airbnb market stack up against its neighbors? Compare key performance metrics like average monthly revenue, ADR, and occupancy rates in surrounding areas to understand the broader regional STR landscape.
| Market | Active Properties | Monthly Revenue | Daily Rate | Avg. Occupancy |
|---|---|---|---|---|
| Eagle | 82 | $2,745 | $210.92 | 48% |
| Garden Valley | 142 | $2,688 | $273.05 | 36% |
| Meridian | 315 | $2,664 | $208.32 | 52% |
| McCall | 527 | $2,663 | $332.11 | 35% |
| Kuna | 26 | $2,553 | $200.62 | 50% |
| Tamarack | 20 | $2,395 | $403.42 | 23% |
| Boise | 1,226 | $2,294 | $176.50 | 53% |
| New Meadows | 30 | $2,278 | $246.93 | 38% |
| Ontario | 13 | $2,169 | $179.86 | 47% |
| Baker City | 95 | $2,144 | $180.77 | 46% |