Boise Airbnb Market Analysis 2026: Short Term Rental Data & Vacation Rental Statistics in Idaho, United States
Is Airbnb profitable in Boise in 2026? Explore comprehensive Airbnb analytics for Boise, Idaho, United States to uncover income potential. This 2026 STR market report for Boise, based on AirROI data from February 2025 to January 2026, reveals key trends in the bustling market of 1,226 active listings.
Whether you're considering an Airbnb investment in Boise, optimizing your existing vacation rental, or exploring rental arbitrage opportunities, understanding the Boise Airbnb data is crucial. Leveraging the low regulation environment is key to maximizing your short term rental income potential. Let's dive into the specifics.
Key Boise Airbnb Performance Metrics Overview
Monthly Airbnb Revenue Variations & Income Potential in Boise (2026)
Understanding the monthly revenue variations for Airbnb listings in Boise is key to maximizing your short term rental income potential. Seasonality significantly impacts earnings. Our analysis, based on data from the past 12 months, shows that the peak revenue month for STRs in Boise is typically June, while February often presents the lowest earnings, highlighting opportunities for strategic pricing adjustments during shoulder and low seasons. Explore the typical Airbnb income in Boise across different performance tiers:
- Best-in-class properties (Top 10%) achieve $5,344+ monthly, often utilizing dynamic pricing and superior guest experiences.
- Strong performing properties (Top 25%) earn $3,697 or more, indicating effective management and desirable locations/amenities.
- Typical properties (Median) generate around $2,510 per month, representing the average market performance.
- Entry-level properties (Bottom 25%) see earnings around $1,512, often with potential for optimization.
Average Monthly Airbnb Earnings Trend in Boise
Boise Airbnb Occupancy Rate Trends (2026)
Maximize your bookings by understanding the Boise STR occupancy trends. Seasonal demand shifts significantly influence how often properties are booked. Typically, Junesees the highest demand (peak season occupancy), while January experiences the lowest (low season). Effective strategies, like adjusting minimum stays or offering promotions, can boost occupancy during slower periods. Here's how different property tiers perform in Boise:
- Best-in-class properties (Top 10%) achieve 86%+ occupancy, indicating high desirability and potentially optimized availability.
- Strong performing properties (Top 25%) maintain 74% or higher occupancy, suggesting good market fit and guest satisfaction.
- Typical properties (Median) have an occupancy rate around 55%.
- Entry-level properties (Bottom 25%) average 35% occupancy, potentially facing higher vacancy.
Average Monthly Occupancy Rate Trend in Boise
Average Daily Rate (ADR) Airbnb Trends in Boise (2026)
Effective short term rental pricing strategy in Boise involves understanding monthly ADR fluctuations. The Average Daily Rate (ADR) for Airbnb in Boise typically peaks in October and dips lowest during February. Leveraging Airbnb dynamic pricing tools or strategies based on this seasonality can significantly boost revenue. Here's a look at the typical nightly rates achieved:
- Best-in-class properties (Top 10%) command rates of $288+ per night, often due to premium features or locations.
- Strong performing properties (Top 25%) achieve nightly rates of $201 or more.
- Typical properties (Median) charge around $145 per night.
- Entry-level properties (Bottom 25%) earn around $105 per night.
Average Daily Rate (ADR) Trend by Month in Boise
Get Live Boise Market Intelligence 👇

Explore Real-time Analytics
Airbnb Seasonality Analysis & Trends in Boise (2026)
Peak Season (June, July, August)
- Revenue averages $3,804 per month
- Occupancy rates average 63.2%
- Daily rates average $181
Shoulder Season
- Revenue averages $2,903 per month
- Occupancy maintains around 52.3%
- Daily rates hold near $179
Low Season (January, February, April)
- Revenue drops to average $2,227 per month
- Occupancy decreases to average 47.6%
- Daily rates adjust to average $160
Seasonality Insights for Boise
- The Airbnb seasonality in Boise shows moderate seasonality with distinct peak and low periods. While the sections above show seasonal averages, it's also insightful to look at the extremes:
- During the high season, the absolute peak month showcases Boise's highest earning potential, with monthly revenues capable of climbing to $3,886, occupancy reaching a high of 63.9%, and ADRs peaking at $191.
- Conversely, the slowest single month of the year, typically falling within the low season, marks the market's lowest point. In this month, revenue might dip to $1,997, occupancy could drop to 41.2%, and ADRs may adjust down to $147.
- Understanding both the seasonal averages and these monthly peaks and troughs in revenue, occupancy, and ADR is crucial for maximizing your Airbnb profit potential in Boise.
Seasonal Strategies for Maximizing Profit
- Peak Season: Maximize revenue through premium pricing and potentially longer minimum stays. Ensure high availability.
- Low Season: Offer competitive pricing, special promotions (e.g., extended stay discounts), and flexible cancellation policies. Target off-season travelers like remote workers or budget-conscious guests.
- Shoulder Seasons: Implement dynamic pricing that balances peak and low rates. Target weekend travelers or specific events. Offer slightly more flexible terms than peak season.
- Regularly analyze your own performance against these Boise seasonality benchmarks and adjust your pricing and availability strategy accordingly.
Best Areas for Airbnb Investment in Boise (2026)
Exploring the top neighborhoods for short-term rentals in Boise? This section highlights key areas, outlining why they are attractive for hosts and guests, along with notable local attractions. Consider these locations based on your target guest profile and investment strategy.
| Neighborhood / Area | Why Host Here? (Target Guests & Appeal) | Key Attractions & Landmarks |
|---|---|---|
| Downtown Boise | Vibrant urban center with a mix of business, art, and dining options. Attracts both tourists and business travelers due to its accessibility and local attractions. | Boise River Greenbelt, Downtown Boise Farmers Market, Basque Block, Idaho State Capitol, Julia Davis Park |
| Boise State University | Home to the university, this area is popular with students and families visiting. A great spot for short-term rentals around academic events and sports. | Albertsons Stadium, Boise River, Campus events, Boise State Virtual Campus Tours |
| North End | Historic neighborhood with charming homes, great parks, and local shops. Attracts those looking for a residential experience close to downtown. | Camel's Back Park, Harrison Boulevard, Hyde Park, Boise Art Museum, Local coffee shops and eateries |
| East Boise | A quiet area with beautiful views and outdoor activities. Ideal for those seeking a more nature-oriented experience while still being close to the city. | Table Rock, Lucky Peak State Park, Boise Foothills trails, Scenic overlooks, Outdoor recreation |
| West Boise | Home to shopping centers and family-friendly neighborhoods. A good area for families visiting or relocating for work opportunities in Boise. | Boise Towne Square Mall, Ann Morrison Park, Family attractions, The Village at Meridian |
| Garden City | A growing area adjacent to Boise with an artistic vibe and access to the river. Popular with creatives and locals looking for unique features. | Morris Hill Park, Boise River access, Art galleries, Local breweries |
| Fairview Avenue Corridor | An economic area with various dining spots and shopping. Easy access to the main roads and close to the Boise River. | Boise River Greenbelt, Local restaurants, Convenient access to major highways |
| Southeast Boise | An area with a mix of residential and commercial properties, providing diverse options for potential renters. Close to parks and recreation. | Collister Park, Dry Creek Trail, Boise River access, Shopping and dining facilities |
Understanding Airbnb License Requirements & STR Laws in Boise (2026)
While Boise, Idaho, United States currently shows low STR regulations, specific Airbnb license requirements might still exist or change. Always verify the latest short term rental regulations and Airbnb license requirements directly with local government authorities for Boise to ensure full compliance before hosting.
(Source: AirROI data, 2026, based on 0% licensed listings)
Top Performing Airbnb Properties in Boise (2026)
Benchmark your potential! Explore examples of top-performing Airbnb properties in Boisebased on Trailing Twelve Month (TTM) revenue. Analyze their characteristics, revenue, occupancy rate, and ADR to understand what drives success in this market.
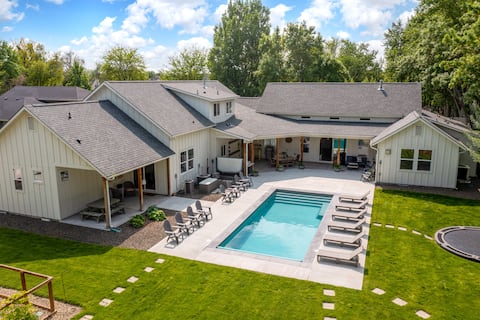
5BR Farmhouse w/ Hot Tub & Seasonally Heated Pool
Entire Place • 5 bedrooms
#HabitueHomes - Sunset Park Sweetheart
Entire Place • 2 bedrooms
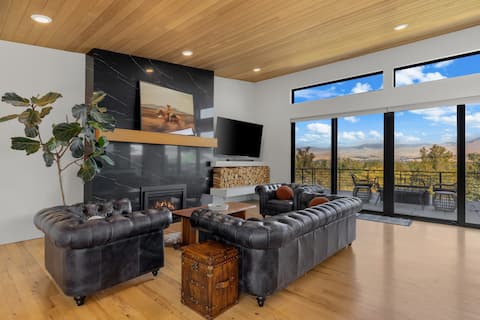
LUX HGTV “View House” | Hot Tub, Sauna, City Views
Entire Place • 4 bedrooms

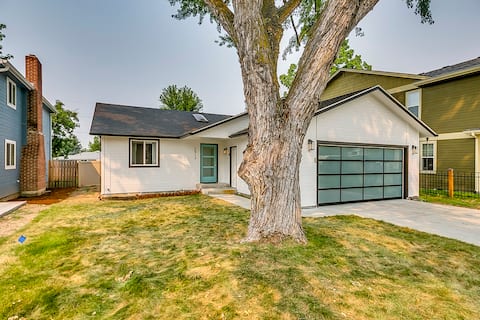
#HabitueHomes - Bronco House - Near Boise State!
Entire Place • 1 bedroom

Mountainside Luxury Entertainer | Game Room & Deck
Entire Place • 6 bedrooms

Central Boise Mansion Close to Dtwn, River & BSU!
Entire Place • 6 bedrooms
Note: Performance varies based on location, size, amenities, seasonality, and management quality. Data reflects the past 12 months.
Top Performing Airbnb Hosts in Boise (2026)
Learn from the best! This table showcases top-performing Airbnb hosts in Boise based on the number of properties managed and estimated total revenue over the past year. Analyze their scale and performance metrics.
| Host Name | Properties | Grossing Revenue | Stay Reviews | Avg Rating |
|---|---|---|---|---|
| Habitue | 33 | $2,323,650 | 2416 | 4.83/5.0 |
| ITrip So Idaho | 32 | $1,189,550 | 791 | 4.90/5.0 |
| Aaron & Kelly | 32 | $1,138,092 | 6836 | 4.89/5.0 |
| Evolve | 28 | $908,233 | 882 | 4.88/5.0 |
| Boise BnB | 31 | $880,861 | 896 | 4.70/5.0 |
| Matt & Kyli | 18 | $640,069 | 2417 | 4.92/5.0 |
| Jill Tibbs | 16 | $559,634 | 1268 | 4.74/5.0 |
| Austin And Hannah | 7 | $540,121 | 453 | 4.93/5.0 |
| Craig | 22 | $489,913 | 379 | 4.89/5.0 |
| Kirsten | 10 | $441,794 | 1525 | 4.96/5.0 |
Analyzing the strategies of top hosts, such as their property selection, pricing, and guest communication, can offer valuable lessons for optimizing your own Airbnb operations in Boise.
Dive Deeper: Advanced Boise STR Market Data (2026)
Ready to unlock more insights? AirROI provides access to advanced metrics and comprehensive Airbnb data for Boise. Explore detailed analytics beyond this report to refine your investment strategy, optimize pricing, and maximize your vacation rental profits.
Explore Advanced MetricsBoise Short-Term Rental Market Composition (2026): Property & Room Types
Room Type Distribution
Property Type Distribution
Market Composition Insights for Boise
- The Boise Airbnb market composition is heavily skewed towards Entire Home/Apt listings, which make up 93.8% of the 1,226 active rentals. This indicates strong guest preference for privacy and space.
- Looking at the property type distribution in Boise, House properties are the most common (70.6%), reflecting the local real estate landscape.
- Houses represent a significant 70.6% portion, catering likely to families or larger groups.
- The presence of 7.1% Hotel/Boutique listings indicates integration with traditional hospitality.
- Smaller segments like others, outdoor/unique, unique stays (combined 5.6%) offer potential for unique stay experiences.
Boise Airbnb Room Capacity Analysis (2026): Bedroom Distribution
Distribution of Listings by Number of Bedrooms
Room Capacity Insights for Boise
- The dominant room capacity in Boise is 2 bedrooms listings, making up 28.5% of the market. This suggests a strong demand for properties suitable for couples or solo travelers.
- Together, 2 bedrooms and 1 bedroom properties represent 54.9% of the active Airbnb listings in Boise, indicating a high concentration in these sizes.
- A significant 35.0% of listings offer 3+ bedrooms, catering to larger groups and families seeking more space in Boise.
Boise Vacation Rental Guest Capacity Trends (2026)
Distribution of Listings by Guest Capacity
Guest Capacity Insights for Boise
- The most common guest capacity trend in Boise vacation rentals is listings accommodating 4 guests (22.5%). This suggests the primary traveler segment is likely small families or groups.
- Properties designed for 4 guests and 2 guests dominate the Boise STR market, accounting for 41.5% of listings.
- 40.1% of properties accommodate 6+ guests, serving the market segment for larger families or group travel in Boise.
- On average, properties in Boise are equipped to host 4.6 guests.
Boise Airbnb Booking Patterns (2026): Available vs. Booked Days
Available Days Distribution
Booked Days Distribution
Booking Pattern Insights for Boise
- The most common availability pattern in Boise falls within the 91-180 days range, representing 34.4% of listings. This suggests many properties have significant open periods on their calendars.
- Approximately 58.3% of listings show high availability (181+ days open annually), indicating potential for increased bookings or specific owner usage patterns.
- For booked days, the 181-270 days range is most frequent in Boise (34.7%), reflecting common guest stay durations or potential owner blocking patterns.
- A notable 43.3% of properties secure long booking periods (181+ days booked per year), highlighting successful long-term rental strategies or significant owner usage.
Boise Airbnb Minimum Stay Requirements Analysis
Distribution of Listings by Minimum Night Requirement
1 Night
321 listings
26.2% of total
2 Nights
337 listings
27.5% of total
3 Nights
69 listings
5.6% of total
4-6 Nights
26 listings
2.1% of total
7-29 Nights
87 listings
7.1% of total
30+ Nights
386 listings
31.5% of total
Key Insights
- The most prevalent minimum stay requirement in Boise is 30+ Nights, adopted by 31.5% of listings. This highlights the market's preference for longer commitments.
- A significant segment (31.5%) caters to monthly stays (30+ nights) in Boise, pointing to opportunities in the extended-stay market.
Recommendations
- Align with the market by considering a 30+ Nights minimum stay, as 31.5% of Boise hosts use this setting.
- If feasible, allowing 1-night stays, especially midweek or during low season, could capture last-minute bookings, as only 26.2% currently do.
- Explore offering discounts for stays of 30+ nights to attract the 31.5% of the market seeking extended stays.
- Adjust minimum nights based on seasonality – potentially shorter during low season and longer during peak demand periods in Boise.
Boise Airbnb Cancellation Policy Trends Analysis (2026)
Super Strict 60 Days
8 listings
0.7% of total
Limited
20 listings
1.6% of total
Super Strict 30 Days
14 listings
1.1% of total
Flexible
272 listings
22.2% of total
Moderate
380 listings
31% of total
Firm
387 listings
31.6% of total
Strict
143 listings
11.7% of total
Cancellation Policy Insights for Boise
- The prevailing Airbnb cancellation policy trend in Boise is Firm, used by 31.6% of listings.
- There's a relatively balanced mix between guest-friendly (53.2%) and stricter (43.3%) policies, offering choices for different guest needs.
Recommendations for Hosts
- Consider adopting a Firm policy to align with the 31.6% market standard in Boise.
- Using a Strict policy might deter some guests, as only 11.7% of listings use it. Evaluate if potential revenue protection outweighs possible lower booking rates.
- Regularly review your cancellation policy against competitors and market demand shifts in Boise.
Boise STR Booking Lead Time Analysis (2026)
Average Booking Lead Time by Month
Booking Lead Time Insights for Boise
- The overall average booking lead time for vacation rentals in Boise is 41 days.
- Guests book furthest in advance for stays during May (average 59 days), likely coinciding with peak travel demand or local events.
- The shortest booking windows occur for stays in February (average 27 days), indicating more last-minute travel plans during this time.
- Seasonally, Summer (48 days avg.) sees the longest lead times, while Winter (31 days avg.) has the shortest, reflecting typical travel planning cycles.
Recommendations for Hosts
- Use the overall average lead time (41 days) as a baseline for your pricing and availability strategy in Boise.
- For May stays, consider implementing length-of-stay discounts or slightly higher rates for bookings made less than 59 days out to capitalize on advance planning.
- Target marketing efforts for the Summer season well in advance (at least 48 days) to capture early planners.
- Monitor your own booking lead times against these Boise averages to identify opportunities for dynamic pricing adjustments.
Popular & Essential Airbnb Amenities in Boise (2026)
Amenity Prevalence
Amenity Insights for Boise
- Essential amenities in Boise that guests expect include: Wifi, Air conditioning, Smoke alarm, Heating, TV, Hot water. Lacking these (any) could significantly impact bookings.
- Popular amenities like Dishes and silverware, Coffee maker, Kitchen are common but not universal. Offering these can provide a competitive edge.
Recommendations for Hosts
- Ensure your listing includes all essential amenities for Boise: Wifi, Air conditioning, Smoke alarm, Heating, TV, Hot water.
- Prioritize adding missing essentials: Wifi, Air conditioning, Smoke alarm, Heating, TV, Hot water.
- Consider adding popular differentiators like Dishes and silverware or Coffee maker to increase appeal.
- Highlight unique or less common amenities you offer (e.g., hot tub, dedicated workspace, EV charger) in your listing description and photos.
- Regularly check competitor amenities in Boise to stay competitive.
Boise Airbnb Guest Demographics & Profile Analysis (2026)
Guest Profile Summary for Boise
- The typical guest profile for Airbnb in Boise consists of primarily domestic travelers (97%), often arriving from nearby Boise, typically belonging to the Post-2000s (Gen Z/Alpha) group (50%), primarily speaking English or Spanish.
- Domestic travelers account for 97.2% of guests.
- Key international markets include United States (97.2%) and Canada (0.6%).
- Top languages spoken are English (74.9%) followed by Spanish (13%).
- A significant demographic segment is the Post-2000s (Gen Z/Alpha) group, representing 50% of guests.
Recommendations for Hosts
- Target domestic marketing efforts towards travelers from Boise and Portland.
- Tailor amenities and listing descriptions to appeal to the dominant Post-2000s (Gen Z/Alpha) demographic (e.g., highlight fast WiFi, smart home features, local guides).
- Highlight unique local experiences or amenities relevant to the primary guest profile.
- Consider seasonal promotions aligned with peak travel times for key origin markets.
Nearby Short-Term Rental Market Comparison
How does the Boise Airbnb market stack up against its neighbors? Compare key performance metrics like average monthly revenue, ADR, and occupancy rates in surrounding areas to understand the broader regional STR landscape.
| Market | Active Properties | Monthly Revenue | Daily Rate | Avg. Occupancy |
|---|---|---|---|---|
| Donnelly | 227 | $3,160 | $372.53 | 35% |
| Eagle | 82 | $2,745 | $210.92 | 48% |
| Garden Valley | 142 | $2,688 | $273.05 | 36% |
| Meridian | 315 | $2,664 | $208.32 | 52% |
| McCall | 527 | $2,663 | $332.11 | 35% |
| Kuna | 26 | $2,553 | $200.62 | 50% |
| Tamarack | 20 | $2,395 | $403.42 | 23% |
| Ontario | 13 | $2,169 | $179.86 | 47% |
| Baker City | 95 | $2,144 | $180.77 | 46% |
| Nampa | 206 | $2,124 | $183.41 | 49% |