Waialua Airbnb Market Analysis 2026: Short Term Rental Data & Vacation Rental Statistics in Hawaii, United States
Is Airbnb profitable in Waialua in 2026? Explore comprehensive Airbnb analytics for Waialua, Hawaii, United States to uncover income potential. This 2026 STR market report for Waialua, based on AirROI data from February 2025 to January 2026, reveals key trends in the niche market of 22 active listings.
Whether you're considering an Airbnb investment in Waialua, optimizing your existing vacation rental, or exploring rental arbitrage opportunities, understanding the Waialua Airbnb data is crucial. Navigating the high regulation landscape is key to maximizing your short term rental income potential. Let's dive into the specifics.
Key Waialua Airbnb Performance Metrics Overview
Monthly Airbnb Revenue Variations & Income Potential in Waialua (2026)
Understanding the monthly revenue variations for Airbnb listings in Waialua is key to maximizing your short term rental income potential. Seasonality significantly impacts earnings. Our analysis, based on data from the past 12 months, shows that the peak revenue month for STRs in Waialua is typically August, while October often presents the lowest earnings, highlighting opportunities for strategic pricing adjustments during shoulder and low seasons. Explore the typical Airbnb income in Waialua across different performance tiers:
- Best-in-class properties (Top 10%) achieve $12,923+ monthly, often utilizing dynamic pricing and superior guest experiences.
- Strong performing properties (Top 25%) earn $6,702 or more, indicating effective management and desirable locations/amenities.
- Typical properties (Median) generate around $2,785 per month, representing the average market performance.
- Entry-level properties (Bottom 25%) see earnings around $1,285, often with potential for optimization.
Average Monthly Airbnb Earnings Trend in Waialua
Waialua Airbnb Occupancy Rate Trends (2026)
Maximize your bookings by understanding the Waialua STR occupancy trends. Seasonal demand shifts significantly influence how often properties are booked. Typically, Februarysees the highest demand (peak season occupancy), while September experiences the lowest (low season). Effective strategies, like adjusting minimum stays or offering promotions, can boost occupancy during slower periods. Here's how different property tiers perform in Waialua:
- Best-in-class properties (Top 10%) achieve 66%+ occupancy, indicating high desirability and potentially optimized availability.
- Strong performing properties (Top 25%) maintain 43% or higher occupancy, suggesting good market fit and guest satisfaction.
- Typical properties (Median) have an occupancy rate around 25%.
- Entry-level properties (Bottom 25%) average 12% occupancy, potentially facing higher vacancy.
Average Monthly Occupancy Rate Trend in Waialua
Average Daily Rate (ADR) Airbnb Trends in Waialua (2026)
Effective short term rental pricing strategy in Waialua involves understanding monthly ADR fluctuations. The Average Daily Rate (ADR) for Airbnb in Waialua typically peaks in March and dips lowest during December. Leveraging Airbnb dynamic pricing tools or strategies based on this seasonality can significantly boost revenue. Here's a look at the typical nightly rates achieved:
- Best-in-class properties (Top 10%) command rates of $645+ per night, often due to premium features or locations.
- Strong performing properties (Top 25%) achieve nightly rates of $386 or more.
- Typical properties (Median) charge around $198 per night.
- Entry-level properties (Bottom 25%) earn around $115 per night.
Average Daily Rate (ADR) Trend by Month in Waialua
Get Live Waialua Market Intelligence 👇

Explore Real-time Analytics
Airbnb Seasonality Analysis & Trends in Waialua (2026)
Peak Season (August, July, June)
- Revenue averages $7,881 per month
- Occupancy rates average 36.9%
- Daily rates average $389
Shoulder Season
- Revenue averages $4,332 per month
- Occupancy maintains around 32.1%
- Daily rates hold near $375
Low Season (May, October, November)
- Revenue drops to average $3,042 per month
- Occupancy decreases to average 29.3%
- Daily rates adjust to average $363
Seasonality Insights for Waialua
- The Airbnb seasonality in Waialua shows highly seasonal trends requiring careful strategy. While the sections above show seasonal averages, it's also insightful to look at the extremes:
- During the high season, the absolute peak month showcases Waialua's highest earning potential, with monthly revenues capable of climbing to $8,645, occupancy reaching a high of 40.0%, and ADRs peaking at $410.
- Conversely, the slowest single month of the year, typically falling within the low season, marks the market's lowest point. In this month, revenue might dip to $2,546, occupancy could drop to 11.7%, and ADRs may adjust down to $340.
- Understanding both the seasonal averages and these monthly peaks and troughs in revenue, occupancy, and ADR is crucial for maximizing your Airbnb profit potential in Waialua.
Seasonal Strategies for Maximizing Profit
- Peak Season: Maximize revenue through premium pricing and potentially longer minimum stays. Ensure high availability.
- Low Season: Offer competitive pricing, special promotions (e.g., extended stay discounts), and flexible cancellation policies. Target off-season travelers like remote workers or budget-conscious guests.
- Shoulder Seasons: Implement dynamic pricing that balances peak and low rates. Target weekend travelers or specific events. Offer slightly more flexible terms than peak season.
- Regularly analyze your own performance against these Waialua seasonality benchmarks and adjust your pricing and availability strategy accordingly.
Best Areas for Airbnb Investment in Waialua (2026)
Exploring the top neighborhoods for short-term rentals in Waialua? This section highlights key areas, outlining why they are attractive for hosts and guests, along with notable local attractions. Consider these locations based on your target guest profile and investment strategy.
| Neighborhood / Area | Why Host Here? (Target Guests & Appeal) | Key Attractions & Landmarks |
|---|---|---|
| Waialua Beach | Stunning beach location known for its serene atmosphere and beautiful sunsets. Ideal for families and tourists looking for a peaceful seaside getaway. | Waialua Beach Park, Polihale State Park, Oahu Rail Trail, Kawailoa Beach, Dillingham Ranch |
| Mokuleia | A quiet, laid-back area with access to breathtaking beaches and a rural charm. Perfect for those wanting to escape the hustle and enjoy nature. | Mokuleia Beach, Waimea Bay, Shark's Cove, Dillingham Airfield, North Shore Surf Spots |
| Sunset Beach | Famous for its stunning sunsets and world-class surf. Attracts surfers, beach lovers, and holidaymakers during the winter surf season. | Sunset Beach Park, Pipeline, Waimea Bay, Turtle Bay Resort, Shark's Cove |
| Haleiwa | Historic town with a vibrant local culture and famous food trucks. A hotspot for tourists looking for unique shops and local delicacies. | Haleiwa Beach Park, Waialua Sugar Mill, Shark's Cove, Haleiwa Alii Beach Park, Food Trucks |
| Kahuku | Known for its lush landscapes and agricultural experiences. Great for visitors interested in the local farming culture and fresh food. | Kahuku Farms, Sharks Cove, Kahuku Point, Hukilau Beach, Fumi's Kahuku Shrimp |
| North Shore | World-renowned for its surf culture and beautiful beaches. Attracts surfers, adventurers, and tourists year-round. | Waimea Bay, Banzai Pipeline, Laniakea Beach, Sunset Beach, North Shore Farmers Market |
| Dillingham Airfield | A unique location known for skydiving and glider experiences. Attracts adventure seekers and those looking for unique aerial views of Oahu. | Dillingham Airfield, Skydiving Experiences, Air Tours, Glider Rides, Pacific Ocean Views |
| Waimea Valley | A lush tropical valley with a waterfall and rich cultural history. Perfect for nature lovers and those interested in Hawaiian history and culture. | Waimea Falls Park, Hiking Trails, Cultural Activities, Botanical Gardens, Historical Sites |
Understanding Airbnb License Requirements & STR Laws in Waialua (2026)
Yes, Waialua, Hawaii, United States enforces high STR regulations. Obtaining a license and ensuring compliance is almost certainly required according to current 2026 STR laws. Always verify the latest short term rental regulations and Airbnb license requirements directly with local government authorities for Waialua to ensure full compliance before hosting.
(Source: AirROI data, 2026, based on 73% licensed listings)
Top Performing Airbnb Properties in Waialua (2026)
Benchmark your potential! Explore examples of top-performing Airbnb properties in Waialuabased on Trailing Twelve Month (TTM) revenue. Analyze their characteristics, revenue, occupancy rate, and ADR to understand what drives success in this market.
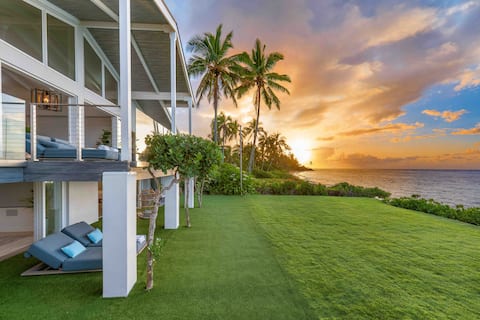
Northshore Oceanfront Home- 5 bedroom/4 bath
Entire Place • 5 bedrooms
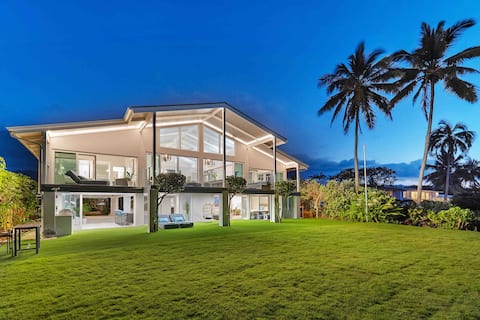
Sea of Glass Hawaii- Luxury 5 bedrooms North Shore
Entire Place • 6 bedrooms
Modern North Shore Beachfront- 4 Bed 4 Bath
Entire Place • 4 bedrooms

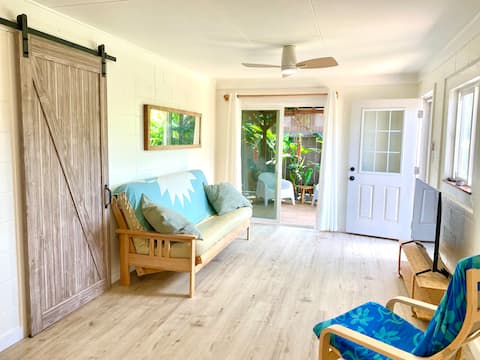
North Shore Bali Style Home on Waialua Beach
Entire Place • 3 bedrooms
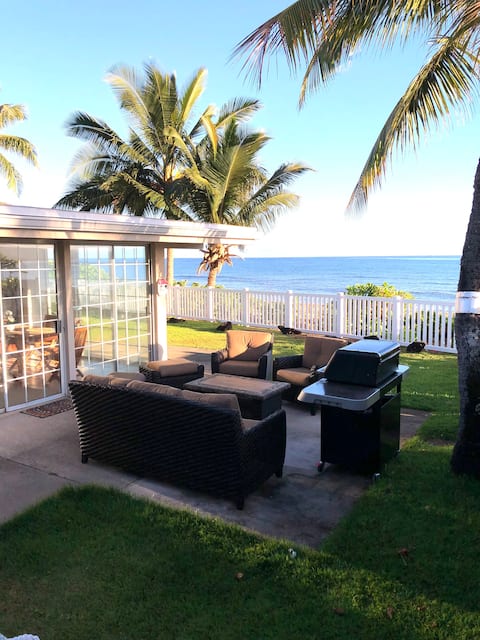
Country Getaway - Steps to the ocean!
Entire Place • 1 bedroom

Beach house on Oahu’s stunning north shore
Entire Place • 3 bedrooms
Note: Performance varies based on location, size, amenities, seasonality, and management quality. Data reflects the past 12 months.
Top Performing Airbnb Hosts in Waialua (2026)
Learn from the best! This table showcases top-performing Airbnb hosts in Waialua based on the number of properties managed and estimated total revenue over the past year. Analyze their scale and performance metrics.
| Host Name | Properties | Grossing Revenue | Stay Reviews | Avg Rating |
|---|---|---|---|---|
| Priscilla | 2 | $132,579 | 34 | 4.91/5.0 |
| Tara | 1 | $117,246 | 27 | 4.89/5.0 |
| Terrie | 1 | $53,433 | 117 | 4.96/5.0 |
| Jacqueline | 1 | $36,719 | 27 | 4.96/5.0 |
| Arieh | 1 | $30,171 | 39 | 4.95/5.0 |
| Sunee | 1 | $25,487 | 35 | 4.89/5.0 |
| Jing | 1 | $23,652 | 2 | Not Rated |
| Morgan | 1 | $17,374 | 103 | 4.83/5.0 |
| Marie | 1 | $15,524 | 45 | 4.69/5.0 |
| Lea | 1 | $11,834 | 28 | 5.00/5.0 |
Analyzing the strategies of top hosts, such as their property selection, pricing, and guest communication, can offer valuable lessons for optimizing your own Airbnb operations in Waialua.
Dive Deeper: Advanced Waialua STR Market Data (2026)
Ready to unlock more insights? AirROI provides access to advanced metrics and comprehensive Airbnb data for Waialua. Explore detailed analytics beyond this report to refine your investment strategy, optimize pricing, and maximize your vacation rental profits.
Explore Advanced MetricsWaialua Short-Term Rental Market Composition (2026): Property & Room Types
Room Type Distribution
Property Type Distribution
Market Composition Insights for Waialua
- The Waialua Airbnb market composition is heavily skewed towards Entire Home/Apt listings, which make up 86.4% of the 22 active rentals. This indicates strong guest preference for privacy and space.
- Looking at the property type distribution in Waialua, House properties are the most common (68.2%), reflecting the local real estate landscape.
- Houses represent a significant 68.2% portion, catering likely to families or larger groups.
- Smaller segments like hotel/boutique (combined 4.5%) offer potential for unique stay experiences.
Waialua Airbnb Room Capacity Analysis (2026): Bedroom Distribution
Distribution of Listings by Number of Bedrooms
Room Capacity Insights for Waialua
- The dominant room capacity in Waialua is 3 bedrooms listings, making up 18.2% of the market. This suggests a strong demand for properties suitable for families or small groups.
- Together, 3 bedrooms and 1 bedroom properties represent 31.8% of the active Airbnb listings in Waialua, indicating a high concentration in these sizes.
- A significant 36.4% of listings offer 3+ bedrooms, catering to larger groups and families seeking more space in Waialua.
Waialua Vacation Rental Guest Capacity Trends (2026)
Distribution of Listings by Guest Capacity
Guest Capacity Insights for Waialua
- The most common guest capacity trend in Waialua vacation rentals is listings accommodating 2 guests (22.7%). This suggests the primary traveler segment is likely couples or solo travelers.
- Properties designed for 2 guests and 8+ guests dominate the Waialua STR market, accounting for 45.4% of listings.
- 40.8% of properties accommodate 6+ guests, serving the market segment for larger families or group travel in Waialua.
- On average, properties in Waialua are equipped to host 4.2 guests.
Waialua Airbnb Booking Patterns (2026): Available vs. Booked Days
Available Days Distribution
Booked Days Distribution
Booking Pattern Insights for Waialua
- The most common availability pattern in Waialua falls within the 271-366 days range, representing 81.8% of listings. This suggests many properties have significant open periods on their calendars.
- Approximately 100.0% of listings show high availability (181+ days open annually), indicating potential for increased bookings or specific owner usage patterns.
- For booked days, the 31-90 days range is most frequent in Waialua (50%), reflecting common guest stay durations or potential owner blocking patterns.
Waialua Airbnb Minimum Stay Requirements Analysis
Distribution of Listings by Minimum Night Requirement
7-29 Nights
6 listings
27.3% of total
30+ Nights
16 listings
72.7% of total
Key Insights
- The most prevalent minimum stay requirement in Waialua is 30+ Nights, adopted by 72.7% of listings. This highlights the market's preference for longer commitments.
- A significant segment (72.7%) caters to monthly stays (30+ nights) in Waialua, pointing to opportunities in the extended-stay market.
Recommendations
- Align with the market by considering a 30+ Nights minimum stay, as 72.7% of Waialua hosts use this setting.
- Explore offering discounts for stays of 30+ nights to attract the 72.7% of the market seeking extended stays.
- Adjust minimum nights based on seasonality – potentially shorter during low season and longer during peak demand periods in Waialua.
Waialua Airbnb Cancellation Policy Trends Analysis (2026)
Flexible
2 listings
9.1% of total
Moderate
3 listings
13.6% of total
Firm
13 listings
59.1% of total
Strict
4 listings
18.2% of total
Cancellation Policy Insights for Waialua
- The prevailing Airbnb cancellation policy trend in Waialua is Firm, used by 59.1% of listings.
- A majority (77.3%) of hosts in Waialua utilize Firm or Strict policies, indicating a market where hosts prioritize booking security.
Recommendations for Hosts
- Consider adopting a Firm policy to align with the 59.1% market standard in Waialua.
- Regularly review your cancellation policy against competitors and market demand shifts in Waialua.
Waialua STR Booking Lead Time Analysis (2026)
Average Booking Lead Time by Month
Booking Lead Time Insights for Waialua
- The overall average booking lead time for vacation rentals in Waialua is 53 days.
- Guests book furthest in advance for stays during April (average 93 days), likely coinciding with peak travel demand or local events.
- The shortest booking windows occur for stays in October (average 22 days), indicating more last-minute travel plans during this time.
- Seasonally, Spring (65 days avg.) sees the longest lead times, while Fall (45 days avg.) has the shortest, reflecting typical travel planning cycles.
Recommendations for Hosts
- Use the overall average lead time (53 days) as a baseline for your pricing and availability strategy in Waialua.
- For April stays, consider implementing length-of-stay discounts or slightly higher rates for bookings made less than 93 days out to capitalize on advance planning.
- Target marketing efforts for the Spring season well in advance (at least 65 days) to capture early planners.
- Monitor your own booking lead times against these Waialua averages to identify opportunities for dynamic pricing adjustments.
Popular & Essential Airbnb Amenities in Waialua (2026)
Amenity Prevalence
Amenity Insights for Waialua
- Essential amenities in Waialua that guests expect include: Wifi, Smoke alarm, Kitchen, TV. Lacking these (any) could significantly impact bookings.
- Popular amenities like Coffee maker, Hot water, Dishes and silverware are common but not universal. Offering these can provide a competitive edge.
Recommendations for Hosts
- Ensure your listing includes all essential amenities for Waialua: Wifi, Smoke alarm, Kitchen, TV.
- Prioritize adding missing essentials: Smoke alarm, Kitchen, TV.
- Consider adding popular differentiators like Coffee maker or Hot water to increase appeal.
- Highlight unique or less common amenities you offer (e.g., hot tub, dedicated workspace, EV charger) in your listing description and photos.
- Regularly check competitor amenities in Waialua to stay competitive.
Waialua Airbnb Guest Demographics & Profile Analysis (2026)
Guest Profile Summary for Waialua
- The typical guest profile for Airbnb in Waialua consists of primarily domestic travelers (76%), often arriving from nearby Los Angeles, typically belonging to the Post-2000s (Gen Z/Alpha) group (50%), primarily speaking English or German.
- Domestic travelers account for 76.2% of guests.
- Key international markets include United States (76.2%) and Canada (7.1%).
- Top languages spoken are English (72.7%) followed by German (13.6%).
- A significant demographic segment is the Post-2000s (Gen Z/Alpha) group, representing 50% of guests.
Recommendations for Hosts
- Target domestic marketing efforts towards travelers from Los Angeles and Ventura.
- Tailor amenities and listing descriptions to appeal to the dominant Post-2000s (Gen Z/Alpha) demographic (e.g., highlight fast WiFi, smart home features, local guides).
- Highlight unique local experiences or amenities relevant to the primary guest profile.
- Consider seasonal promotions aligned with peak travel times for key origin markets.
Nearby Short-Term Rental Market Comparison
How does the Waialua Airbnb market stack up against its neighbors? Compare key performance metrics like average monthly revenue, ADR, and occupancy rates in surrounding areas to understand the broader regional STR landscape.
| Market | Active Properties | Monthly Revenue | Daily Rate | Avg. Occupancy |
|---|---|---|---|---|
| Haena | 12 | $14,312 | $1130.41 | 51% |
| Anahola | 22 | $13,673 | $845.34 | 54% |
| Mākaha Valley | 96 | $13,116 | $669.71 | 70% |
| Kahuku | 287 | $11,358 | $679.39 | 64% |
| Kilauea | 45 | $9,733 | $1064.42 | 50% |
| Kekaha | 14 | $9,595 | $545.34 | 65% |
| Koloa | 266 | $8,991 | $942.59 | 48% |
| Hanalei | 426 | $6,937 | $560.08 | 50% |
| Poipu | 1,140 | $6,673 | $596.99 | 48% |
| Kapolei | 520 | $6,393 | $688.27 | 44% |