Waiale‘e Airbnb Market Analysis 2026: Short Term Rental Data & Vacation Rental Statistics in Hawaii, United States
Is Airbnb profitable in Waiale‘e in 2026? Explore comprehensive Airbnb analytics for Waiale‘e, Hawaii, United States to uncover income potential. This 2026 STR market report for Waiale‘e, based on AirROI data from February 2025 to January 2026, reveals key trends in the niche market of 55 active listings.
Whether you're considering an Airbnb investment in Waiale‘e, optimizing your existing vacation rental, or exploring rental arbitrage opportunities, understanding the Waiale‘e Airbnb data is crucial. Navigating the high regulation landscape is key to maximizing your short term rental income potential. Let's dive into the specifics.
Key Waiale‘e Airbnb Performance Metrics Overview
Monthly Airbnb Revenue Variations & Income Potential in Waiale‘e (2026)
Understanding the monthly revenue variations for Airbnb listings in Waiale‘e is key to maximizing your short term rental income potential. Seasonality significantly impacts earnings. Our analysis, based on data from the past 12 months, shows that the peak revenue month for STRs in Waiale‘e is typically May, while January often presents the lowest earnings, highlighting opportunities for strategic pricing adjustments during shoulder and low seasons. Explore the typical Airbnb income in Waiale‘e across different performance tiers:
- Best-in-class properties (Top 10%) achieve $13,943+ monthly, often utilizing dynamic pricing and superior guest experiences.
- Strong performing properties (Top 25%) earn $8,165 or more, indicating effective management and desirable locations/amenities.
- Typical properties (Median) generate around $3,942 per month, representing the average market performance.
- Entry-level properties (Bottom 25%) see earnings around $1,843, often with potential for optimization.
Average Monthly Airbnb Earnings Trend in Waiale‘e
Waiale‘e Airbnb Occupancy Rate Trends (2026)
Maximize your bookings by understanding the Waiale‘e STR occupancy trends. Seasonal demand shifts significantly influence how often properties are booked. Typically, Aprilsees the highest demand (peak season occupancy), while January experiences the lowest (low season). Effective strategies, like adjusting minimum stays or offering promotions, can boost occupancy during slower periods. Here's how different property tiers perform in Waiale‘e:
- Best-in-class properties (Top 10%) achieve 85%+ occupancy, indicating high desirability and potentially optimized availability.
- Strong performing properties (Top 25%) maintain 70% or higher occupancy, suggesting good market fit and guest satisfaction.
- Typical properties (Median) have an occupancy rate around 43%.
- Entry-level properties (Bottom 25%) average 23% occupancy, potentially facing higher vacancy.
Average Monthly Occupancy Rate Trend in Waiale‘e
Average Daily Rate (ADR) Airbnb Trends in Waiale‘e (2026)
Effective short term rental pricing strategy in Waiale‘e involves understanding monthly ADR fluctuations. The Average Daily Rate (ADR) for Airbnb in Waiale‘e typically peaks in March and dips lowest during October. Leveraging Airbnb dynamic pricing tools or strategies based on this seasonality can significantly boost revenue. Here's a look at the typical nightly rates achieved:
- Best-in-class properties (Top 10%) command rates of $811+ per night, often due to premium features or locations.
- Strong performing properties (Top 25%) achieve nightly rates of $431 or more.
- Typical properties (Median) charge around $264 per night.
- Entry-level properties (Bottom 25%) earn around $167 per night.
Average Daily Rate (ADR) Trend by Month in Waiale‘e
Get Live Waiale‘e Market Intelligence 👇

Explore Real-time Analytics
Airbnb Seasonality Analysis & Trends in Waiale‘e (2026)
Peak Season (May, April, July)
- Revenue averages $8,270 per month
- Occupancy rates average 48.8%
- Daily rates average $386
Shoulder Season
- Revenue averages $6,715 per month
- Occupancy maintains around 48.8%
- Daily rates hold near $379
Low Season (January, August, September)
- Revenue drops to average $4,780 per month
- Occupancy decreases to average 38.7%
- Daily rates adjust to average $371
Seasonality Insights for Waiale‘e
- The Airbnb seasonality in Waiale‘e shows moderate seasonality with distinct peak and low periods. While the sections above show seasonal averages, it's also insightful to look at the extremes:
- During the high season, the absolute peak month showcases Waiale‘e's highest earning potential, with monthly revenues capable of climbing to $8,710, occupancy reaching a high of 54.6%, and ADRs peaking at $394.
- Conversely, the slowest single month of the year, typically falling within the low season, marks the market's lowest point. In this month, revenue might dip to $4,186, occupancy could drop to 32.9%, and ADRs may adjust down to $358.
- Understanding both the seasonal averages and these monthly peaks and troughs in revenue, occupancy, and ADR is crucial for maximizing your Airbnb profit potential in Waiale‘e.
Seasonal Strategies for Maximizing Profit
- Peak Season: Maximize revenue through premium pricing and potentially longer minimum stays. Ensure high availability.
- Low Season: Offer competitive pricing, special promotions (e.g., extended stay discounts), and flexible cancellation policies. Target off-season travelers like remote workers or budget-conscious guests.
- Shoulder Seasons: Implement dynamic pricing that balances peak and low rates. Target weekend travelers or specific events. Offer slightly more flexible terms than peak season.
- Regularly analyze your own performance against these Waiale‘e seasonality benchmarks and adjust your pricing and availability strategy accordingly.
Best Areas for Airbnb Investment in Waiale‘e (2026)
Exploring the top neighborhoods for short-term rentals in Waiale‘e? This section highlights key areas, outlining why they are attractive for hosts and guests, along with notable local attractions. Consider these locations based on your target guest profile and investment strategy.
| Neighborhood / Area | Why Host Here? (Target Guests & Appeal) | Key Attractions & Landmarks |
|---|---|---|
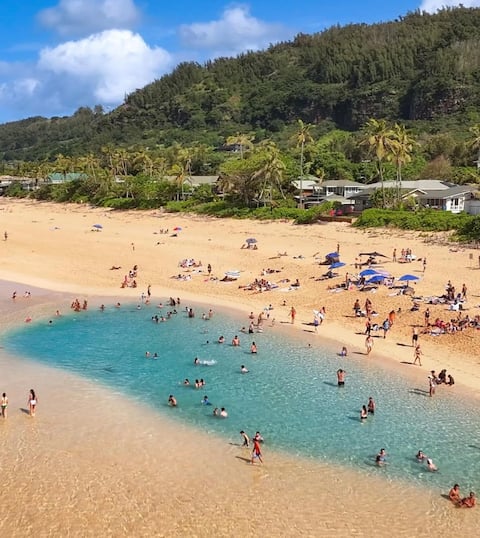
| Waiale‘e Beach | A picturesque beach with crystal clear waters, making it perfect for tourists seeking relaxation and outdoor activities. Great for beach lovers and water sports enthusiasts. | Waiale‘e Beach Park, Water sports rentals, Hiking trails, Picnic areas, Vedanta Temple |
| Kualoa Ranch | Famous for its stunning landscapes and outdoor adventures, Kualoa Ranch attracts tourists interested in nature, filming locations, and adventure tours. | Kualoa Ranch tours, Movies sites tours, Ziplining, ATV rides, Hiking trails |
| North Shore | Known for its world-class surfing, the North Shore is a hot spot for both surfers and visitors looking for a laid-back, beach town vibe. Ideal for those seeking an adventurous vacation. | Waimea Bay, Sunset Beach, Pipeline, Shark's Cove, Local food trucks |
| Haleiwa | A charming historic town featuring unique shops, restaurants, and stunning beaches. It offers a glimpse into the local culture and is an ideal location for families and tourists. | Haleiwa Alii Beach Park, Shark's Cove, Haleiwa Town Center, Local art galleries, Food trucks |
| Pupukea | A quiet area known for its beautiful beaches and scenic views. It appeals to tourists looking for a more tranquil experience away from the crowds. | Shark's Cove, Three Tables Beach, Pupukea Beach Park, Banzai Pipeline, Scenic viewpoints |
| Waimea Valley | A lush valley offering botanical gardens and a waterfall, perfect for nature lovers and families looking for educational and scenic activities. | Waimea Waterfall, Botanical Gardens, Cultural events, Walking trails, Guided tours |
| Sunset Beach | Famous for its breathtaking sunsets and surfing events, this area attracts tourists looking for scenic views and beach activities. | Sunset Beach Park, Local surfing competitions, Lifeguard stations, Stunning sunset viewpoints, Beachfront dining |
| Turtle Bay | A luxurious resort area that provides a variety of amenities and activities, making it attractive for vacationers seeking relaxation and comfort. | Turtle Bay Resort, Golf course, Horseback riding, Spa services, Private beaches |
Understanding Airbnb License Requirements & STR Laws in Waiale‘e (2026)
Yes, Waiale‘e, Hawaii, United States enforces high STR regulations. Obtaining a license and ensuring compliance is almost certainly required according to current 2026 STR laws. Always verify the latest short term rental regulations and Airbnb license requirements directly with local government authorities for Waiale‘e to ensure full compliance before hosting.
(Source: AirROI data, 2026, based on 64% licensed listings)
Top Performing Airbnb Properties in Waiale‘e (2026)
Benchmark your potential! Explore examples of top-performing Airbnb properties in Waiale‘ebased on Trailing Twelve Month (TTM) revenue. Analyze their characteristics, revenue, occupancy rate, and ADR to understand what drives success in this market.
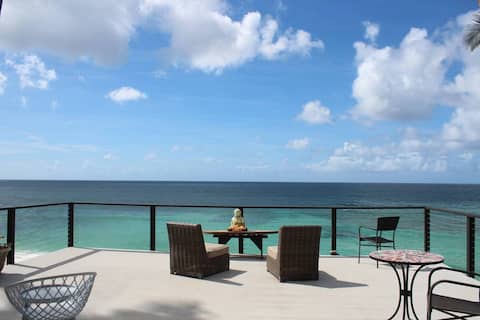
Oceanfront Bliss: Pipeline Haven
Entire Place • 4 bedrooms

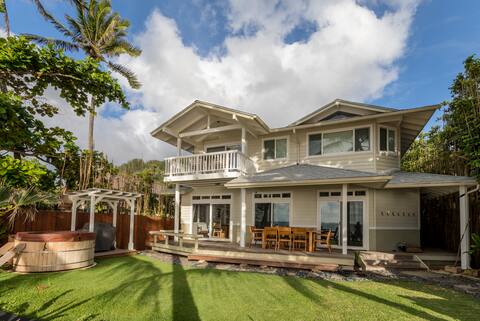
Sunset Beach House
Entire Place • 4 bedrooms

Hawaii Oceanfront Beach House Paradise on the
Entire Place • 3 bedrooms
7 Mile Miracle Beach House
Entire Place • 6 bedrooms
Beachfront 4 beds
Entire Place • 3 bedrooms
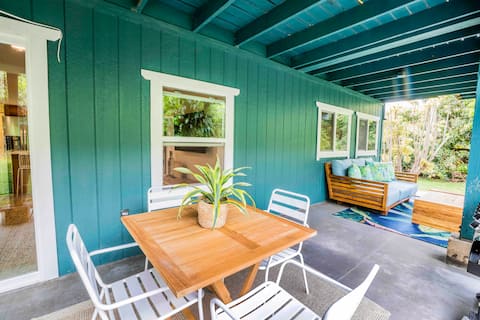
Dreamy Surf Shack
Entire Place • 2 bedrooms
Note: Performance varies based on location, size, amenities, seasonality, and management quality. Data reflects the past 12 months.
Top Performing Airbnb Hosts in Waiale‘e (2026)
Learn from the best! This table showcases top-performing Airbnb hosts in Waiale‘e based on the number of properties managed and estimated total revenue over the past year. Analyze their scale and performance metrics.
| Host Name | Properties | Grossing Revenue | Stay Reviews | Avg Rating |
|---|---|---|---|---|
| Sarah | 1 | $444,127 | 33 | 4.85/5.0 |
| William | 1 | $221,674 | 37 | 4.81/5.0 |
| Michael | 4 | $212,171 | 515 | 4.52/5.0 |
| Dan & Ada | 3 | $185,471 | 244 | 4.91/5.0 |
| Andreia | 1 | $159,888 | 63 | 4.78/5.0 |
| Jean | 3 | $159,233 | 158 | 4.69/5.0 |
| Andrezza Ribeiro Ramos | 3 | $157,908 | 455 | 4.70/5.0 |
| Matt | 1 | $135,217 | 1 | Not Rated |
| Gail | 2 | $121,656 | 189 | 4.82/5.0 |
| Chaney | 3 | $97,178 | 79 | 4.93/5.0 |
Analyzing the strategies of top hosts, such as their property selection, pricing, and guest communication, can offer valuable lessons for optimizing your own Airbnb operations in Waiale‘e.
Dive Deeper: Advanced Waiale‘e STR Market Data (2026)
Ready to unlock more insights? AirROI provides access to advanced metrics and comprehensive Airbnb data for Waiale‘e. Explore detailed analytics beyond this report to refine your investment strategy, optimize pricing, and maximize your vacation rental profits.
Explore Advanced MetricsWaiale‘e Short-Term Rental Market Composition (2026): Property & Room Types
Room Type Distribution
Property Type Distribution
Market Composition Insights for Waiale‘e
- The Waiale‘e Airbnb market composition is heavily skewed towards Entire Home/Apt listings, which make up 94.5% of the 55 active rentals. This indicates strong guest preference for privacy and space.
- Looking at the property type distribution in Waiale‘e, House properties are the most common (60%), reflecting the local real estate landscape.
- Houses represent a significant 60% portion, catering likely to families or larger groups.
- The presence of 16.4% Hotel/Boutique listings indicates integration with traditional hospitality.
Waiale‘e Airbnb Room Capacity Analysis (2026): Bedroom Distribution
Distribution of Listings by Number of Bedrooms
Room Capacity Insights for Waiale‘e
- The dominant room capacity in Waiale‘e is 1 bedroom listings, making up 25.5% of the market. This suggests a strong demand for properties suitable for couples or solo travelers.
- Together, 1 bedroom and 3 bedrooms properties represent 45.5% of the active Airbnb listings in Waiale‘e, indicating a high concentration in these sizes.
- A significant 29.1% of listings offer 3+ bedrooms, catering to larger groups and families seeking more space in Waiale‘e.
Waiale‘e Vacation Rental Guest Capacity Trends (2026)
Distribution of Listings by Guest Capacity
Guest Capacity Insights for Waiale‘e
- The most common guest capacity trend in Waiale‘e vacation rentals is listings accommodating 2 guests (32.7%). This suggests the primary traveler segment is likely couples or solo travelers.
- Properties designed for 2 guests and 6 guests dominate the Waiale‘e STR market, accounting for 50.9% of listings.
- 32.7% of properties accommodate 6+ guests, serving the market segment for larger families or group travel in Waiale‘e.
- On average, properties in Waiale‘e are equipped to host 4.0 guests.
Waiale‘e Airbnb Booking Patterns (2026): Available vs. Booked Days
Available Days Distribution
Booked Days Distribution
Booking Pattern Insights for Waiale‘e
- The most common availability pattern in Waiale‘e falls within the 271-366 days range, representing 56.4% of listings. This suggests many properties have significant open periods on their calendars.
- Approximately 78.2% of listings show high availability (181+ days open annually), indicating potential for increased bookings or specific owner usage patterns.
- For booked days, the 31-90 days range is most frequent in Waiale‘e (34.5%), reflecting common guest stay durations or potential owner blocking patterns.
- A notable 21.8% of properties secure long booking periods (181+ days booked per year), highlighting successful long-term rental strategies or significant owner usage.
Waiale‘e Airbnb Minimum Stay Requirements Analysis
Distribution of Listings by Minimum Night Requirement
2 Nights
2 listings
3.6% of total
3 Nights
3 listings
5.5% of total
4-6 Nights
2 listings
3.6% of total
7-29 Nights
16 listings
29.1% of total
30+ Nights
32 listings
58.2% of total
Key Insights
- The most prevalent minimum stay requirement in Waiale‘e is 30+ Nights, adopted by 58.2% of listings. This highlights the market's preference for longer commitments.
- Very short stays (1-2 nights) are less common (3.6%), suggesting hosts prefer slightly longer bookings to optimize turnover.
- A significant segment (58.2%) caters to monthly stays (30+ nights) in Waiale‘e, pointing to opportunities in the extended-stay market.
Recommendations
- Align with the market by considering a 30+ Nights minimum stay, as 58.2% of Waiale‘e hosts use this setting.
- Explore offering discounts for stays of 30+ nights to attract the 58.2% of the market seeking extended stays.
- Adjust minimum nights based on seasonality – potentially shorter during low season and longer during peak demand periods in Waiale‘e.
Waiale‘e Airbnb Cancellation Policy Trends Analysis (2026)
Super Strict 60 Days
3 listings
5.5% of total
Super Strict 30 Days
3 listings
5.5% of total
Flexible
5 listings
9.1% of total
Moderate
6 listings
10.9% of total
Firm
18 listings
32.7% of total
Strict
20 listings
36.4% of total
Cancellation Policy Insights for Waiale‘e
- The prevailing Airbnb cancellation policy trend in Waiale‘e is Strict, used by 36.4% of listings.
- A majority (69.1%) of hosts in Waiale‘e utilize Firm or Strict policies, indicating a market where hosts prioritize booking security.
Recommendations for Hosts
- Consider adopting a Strict policy to align with the 36.4% market standard in Waiale‘e.
- With 36.4% using Strict terms, this is a viable option in Waiale‘e, particularly for high-value properties or during peak demand periods.
- Regularly review your cancellation policy against competitors and market demand shifts in Waiale‘e.
Waiale‘e STR Booking Lead Time Analysis (2026)
Average Booking Lead Time by Month
Booking Lead Time Insights for Waiale‘e
- The overall average booking lead time for vacation rentals in Waiale‘e is 73 days.
- Guests book furthest in advance for stays during January (average 116 days), likely coinciding with peak travel demand or local events.
- The shortest booking windows occur for stays in September (average 54 days), indicating more last-minute travel plans during this time.
- Seasonally, Winter (95 days avg.) sees the longest lead times, while Fall (73 days avg.) has the shortest, reflecting typical travel planning cycles.
Recommendations for Hosts
- Use the overall average lead time (73 days) as a baseline for your pricing and availability strategy in Waiale‘e.
- For January stays, consider implementing length-of-stay discounts or slightly higher rates for bookings made less than 116 days out to capitalize on advance planning.
- Target marketing efforts for the Winter season well in advance (at least 95 days) to capture early planners.
- Monitor your own booking lead times against these Waiale‘e averages to identify opportunities for dynamic pricing adjustments.
Popular & Essential Airbnb Amenities in Waiale‘e (2026)
Amenity Prevalence
Amenity Insights for Waiale‘e
- Essential amenities in Waiale‘e that guests expect include: Wifi, Kitchen. Lacking these (any) could significantly impact bookings.
- Popular amenities like TV, Dishes and silverware, Smoke alarm are common but not universal. Offering these can provide a competitive edge.
Recommendations for Hosts
- Ensure your listing includes all essential amenities for Waiale‘e: Wifi, Kitchen.
- Prioritize adding missing essentials: Kitchen.
- Consider adding popular differentiators like TV or Dishes and silverware to increase appeal.
- Highlight unique or less common amenities you offer (e.g., hot tub, dedicated workspace, EV charger) in your listing description and photos.
- Regularly check competitor amenities in Waiale‘e to stay competitive.
Waiale‘e Airbnb Guest Demographics & Profile Analysis (2026)
Guest Profile Summary for Waiale‘e
- The typical guest profile for Airbnb in Waiale‘e consists of primarily domestic travelers (84%), often arriving from nearby San Diego, typically belonging to the Post-2000s (Gen Z/Alpha) group (50%), primarily speaking English or Spanish.
- Domestic travelers account for 84.4% of guests.
- Key international markets include United States (84.4%) and Australia (4.4%).
- Top languages spoken are English (58.6%) followed by Spanish (18.1%).
- A significant demographic segment is the Post-2000s (Gen Z/Alpha) group, representing 50% of guests.
Recommendations for Hosts
- Target domestic marketing efforts towards travelers from San Diego and Los Angeles.
- Tailor amenities and listing descriptions to appeal to the dominant Post-2000s (Gen Z/Alpha) demographic (e.g., highlight fast WiFi, smart home features, local guides).
- Highlight unique local experiences or amenities relevant to the primary guest profile.
- Consider seasonal promotions aligned with peak travel times for key origin markets.
Nearby Short-Term Rental Market Comparison
How does the Waiale‘e Airbnb market stack up against its neighbors? Compare key performance metrics like average monthly revenue, ADR, and occupancy rates in surrounding areas to understand the broader regional STR landscape.
| Market | Active Properties | Monthly Revenue | Daily Rate | Avg. Occupancy |
|---|---|---|---|---|
| Haena | 12 | $14,312 | $1130.41 | 51% |
| Anahola | 22 | $13,673 | $845.34 | 54% |
| Mākaha Valley | 96 | $13,116 | $669.71 | 70% |
| Kahuku | 287 | $11,358 | $679.39 | 64% |
| Kilauea | 45 | $9,733 | $1064.42 | 50% |
| Kekaha | 14 | $9,595 | $545.34 | 65% |
| Koloa | 266 | $8,991 | $942.59 | 48% |
| Hanalei | 426 | $6,937 | $560.08 | 50% |
| Poipu | 1,140 | $6,673 | $596.99 | 48% |
| Kapolei | 520 | $6,393 | $688.27 | 44% |