Puakō Airbnb Market Analysis 2026: Short Term Rental Data & Vacation Rental Statistics in Hawaii, United States
Is Airbnb profitable in Puakō in 2026? Explore comprehensive Airbnb analytics for Puakō, Hawaii, United States to uncover income potential. This 2026 STR market report for Puakō, based on AirROI data from February 2025 to January 2026, reveals key trends in the niche market of 62 active listings.
Whether you're considering an Airbnb investment in Puakō, optimizing your existing vacation rental, or exploring rental arbitrage opportunities, understanding the Puakō Airbnb data is crucial. Navigating the high regulation landscape is key to maximizing your short term rental income potential. Let's dive into the specifics.
Key Puakō Airbnb Performance Metrics Overview
Monthly Airbnb Revenue Variations & Income Potential in Puakō (2026)
Understanding the monthly revenue variations for Airbnb listings in Puakō is key to maximizing your short term rental income potential. Seasonality significantly impacts earnings. Our analysis, based on data from the past 12 months, shows that the peak revenue month for STRs in Puakō is typically March, while September often presents the lowest earnings, highlighting opportunities for strategic pricing adjustments during shoulder and low seasons. Explore the typical Airbnb income in Puakō across different performance tiers:
- Best-in-class properties (Top 10%) achieve $21,583+ monthly, often utilizing dynamic pricing and superior guest experiences.
- Strong performing properties (Top 25%) earn $14,081 or more, indicating effective management and desirable locations/amenities.
- Typical properties (Median) generate around $7,822 per month, representing the average market performance.
- Entry-level properties (Bottom 25%) see earnings around $3,892, often with potential for optimization.
Average Monthly Airbnb Earnings Trend in Puakō
Puakō Airbnb Occupancy Rate Trends (2026)
Maximize your bookings by understanding the Puakō STR occupancy trends. Seasonal demand shifts significantly influence how often properties are booked. Typically, Februarysees the highest demand (peak season occupancy), while September experiences the lowest (low season). Effective strategies, like adjusting minimum stays or offering promotions, can boost occupancy during slower periods. Here's how different property tiers perform in Puakō:
- Best-in-class properties (Top 10%) achieve 86%+ occupancy, indicating high desirability and potentially optimized availability.
- Strong performing properties (Top 25%) maintain 70% or higher occupancy, suggesting good market fit and guest satisfaction.
- Typical properties (Median) have an occupancy rate around 46%.
- Entry-level properties (Bottom 25%) average 25% occupancy, potentially facing higher vacancy.
Average Monthly Occupancy Rate Trend in Puakō
Average Daily Rate (ADR) Airbnb Trends in Puakō (2026)
Effective short term rental pricing strategy in Puakō involves understanding monthly ADR fluctuations. The Average Daily Rate (ADR) for Airbnb in Puakō typically peaks in December and dips lowest during May. Leveraging Airbnb dynamic pricing tools or strategies based on this seasonality can significantly boost revenue. Here's a look at the typical nightly rates achieved:
- Best-in-class properties (Top 10%) command rates of $1,973+ per night, often due to premium features or locations.
- Strong performing properties (Top 25%) achieve nightly rates of $952 or more.
- Typical properties (Median) charge around $549 per night.
- Entry-level properties (Bottom 25%) earn around $358 per night.
Average Daily Rate (ADR) Trend by Month in Puakō
Get Live Puakō Market Intelligence 👇

Explore Real-time Analytics
Airbnb Seasonality Analysis & Trends in Puakō (2026)
Peak Season (March, July, February)
- Revenue averages $13,042 per month
- Occupancy rates average 55.2%
- Daily rates average $879
Shoulder Season
- Revenue averages $11,004 per month
- Occupancy maintains around 47.0%
- Daily rates hold near $885
Low Season (September, October, November)
- Revenue drops to average $8,246 per month
- Occupancy decreases to average 41.9%
- Daily rates adjust to average $858
Seasonality Insights for Puakō
- The Airbnb seasonality in Puakō shows moderate seasonality with distinct peak and low periods. While the sections above show seasonal averages, it's also insightful to look at the extremes:
- During the high season, the absolute peak month showcases Puakō's highest earning potential, with monthly revenues capable of climbing to $13,654, occupancy reaching a high of 60.0%, and ADRs peaking at $973.
- Conversely, the slowest single month of the year, typically falling within the low season, marks the market's lowest point. In this month, revenue might dip to $7,227, occupancy could drop to 34.8%, and ADRs may adjust down to $840.
- Understanding both the seasonal averages and these monthly peaks and troughs in revenue, occupancy, and ADR is crucial for maximizing your Airbnb profit potential in Puakō.
Seasonal Strategies for Maximizing Profit
- Peak Season: Maximize revenue through premium pricing and potentially longer minimum stays. Ensure high availability.
- Low Season: Offer competitive pricing, special promotions (e.g., extended stay discounts), and flexible cancellation policies. Target off-season travelers like remote workers or budget-conscious guests.
- Shoulder Seasons: Implement dynamic pricing that balances peak and low rates. Target weekend travelers or specific events. Offer slightly more flexible terms than peak season.
- Regularly analyze your own performance against these Puakō seasonality benchmarks and adjust your pricing and availability strategy accordingly.
Best Areas for Airbnb Investment in Puakō (2026)
Exploring the top neighborhoods for short-term rentals in Puakō? This section highlights key areas, outlining why they are attractive for hosts and guests, along with notable local attractions. Consider these locations based on your target guest profile and investment strategy.
| Neighborhood / Area | Why Host Here? (Target Guests & Appeal) | Key Attractions & Landmarks |
|---|---|---|
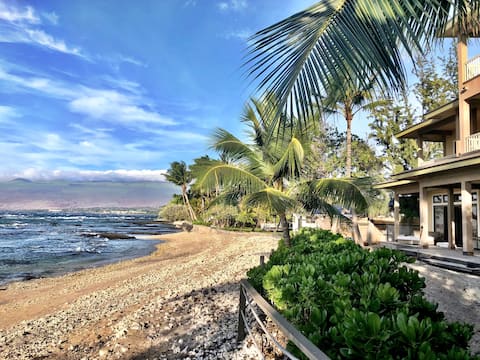
| Puakō Beach | Beautiful and serene beach area known for its excellent snorkeling and marine life. Ideal for families and those seeking a relaxing beach vacation. | Puakō Beach, Hapuna Beach State Park, Mauna Kea Beach, Puʻukohola Heiau National Historic Site, Waikoloa Beach Resort |
| Mauna Lani | Upscale resort area with luxury accommodations and golf courses. Attracts high-end tourists and golfers looking for a lavish experience. | Mauna Lani Resort, Puako Petroglyph Archaeological Preserve, Waikoloa Village Golf Club, Mauna Lani Spa, Parker Ranch |
| Waikoloa Village | Popular area with shopping, dining, and activities near the beach. Great for families and couples looking for both relaxation and adventure. | Kings’ Shops, Waikoloa Beach Resort, Anaeho'omalu Bay, Hilton Waikoloa Village, Waikoloa Kings’ Golf Course |
| Kohala Coast | Renowned for its luxury resorts and stunning beaches. Ideal for tourists wanting a mix of adventure and relaxation in a beautiful setting. | Hapuna Beach, Makena State Park, Mauna Kea, Kohala Coast beaches, Waimea Bay |
| Waimea (Kamuela) | Cultural and agricultural center of Hawaii Island, offering a different experience from the coastline. Appeals to those interested in local culture and scenery. | Waimea Park, Kamuela Museum, Parker Ranch, Waimea Restaurant, Hawaii Preparatory Academy |
| Hawi | Charming town with a rich history and beautiful landscapes, attracting tourists looking for a peaceful Hawaiian experience with authentic culture. | Kohala Historical Society, Hawi Wind Farm, Pololu Valley, Hawi Sugar Museum, local art galleries |
| Kapaau | Home to the birthplace of King Kamehameha and rich in Hawaiian history, making it attractive for culturally minded travelers. | King Kamehameha I Statue, Big Island Eco Adventures, Kapaau Park, local festivals, Kawaihaa Falls |
| Laupāhoehoe | Less touristy area with amazing coastal views, ideal for those seeking a quiet getaway and natural beauty. | Laupāhoehoe Point State Park, Laupāhoehoe Train Museum, local beaches, hiking trails, scenic coastal drives |
Understanding Airbnb License Requirements & STR Laws in Puakō (2026)
Yes, Puakō, Hawaii, United States enforces high STR regulations. Obtaining a license and ensuring compliance is almost certainly required according to current 2026 STR laws. Always verify the latest short term rental regulations and Airbnb license requirements directly with local government authorities for Puakō to ensure full compliance before hosting.
(Source: AirROI data, 2026, based on 76% licensed listings)
Top Performing Airbnb Properties in Puakō (2026)
Benchmark your potential! Explore examples of top-performing Airbnb properties in Puakōbased on Trailing Twelve Month (TTM) revenue. Analyze their characteristics, revenue, occupancy rate, and ADR to understand what drives success in this market.

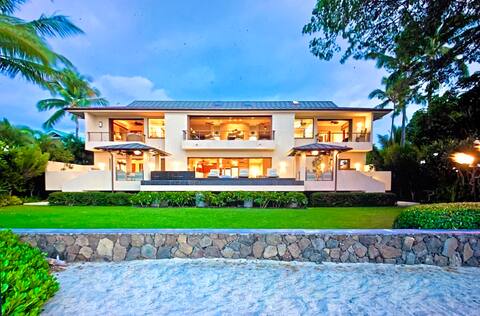
Hale Nana Kohola Beach House
Entire Place • 5 bedrooms
Spend some time on the beach.
Entire Place • 5 bedrooms
Puako Hylton
Entire Place • 4 bedrooms
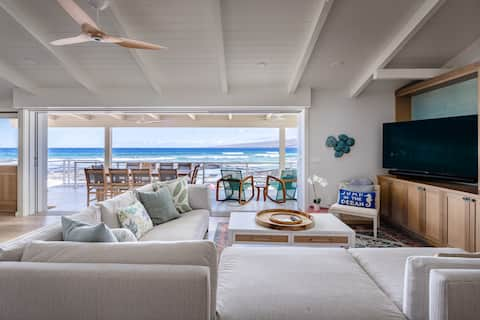
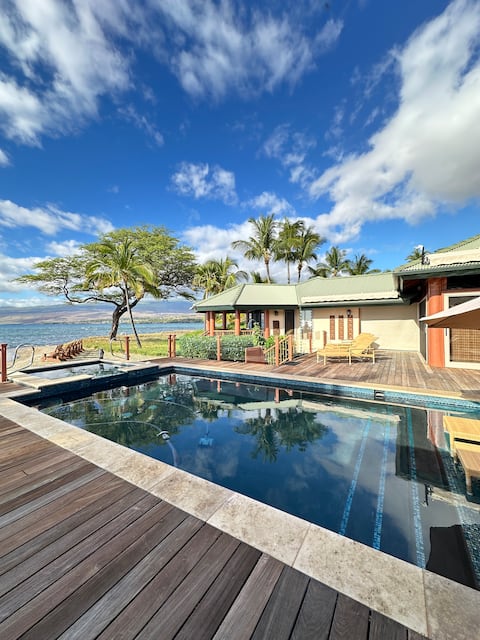
Absolutely Stunning Oceanfront Puako Beach House!
Entire Place • 3 bedrooms
Lux Oceanfront Coral Reef Villa -Dive In/Chill Out
Entire Place • 4 bedrooms
Stunning Puako Bay Hideaway, 4 bedrooms, Sleeps 11
Entire Place • 4 bedrooms
Note: Performance varies based on location, size, amenities, seasonality, and management quality. Data reflects the past 12 months.
Top Performing Airbnb Hosts in Puakō (2026)
Learn from the best! This table showcases top-performing Airbnb hosts in Puakō based on the number of properties managed and estimated total revenue over the past year. Analyze their scale and performance metrics.
| Host Name | Properties | Grossing Revenue | Stay Reviews | Avg Rating |
|---|---|---|---|---|
| Sara | 8 | $987,612 | 309 | 4.97/5.0 |
| Island Beach Rentals | 14 | $685,170 | 410 | 4.76/5.0 |
| Leilani Properties | 4 | $590,958 | 70 | 4.95/5.0 |
| Gather | 3 | $472,205 | 51 | 4.97/5.0 |
| CoralTree Residence Collection | 5 | $376,897 | 15 | 5.00/5.0 |
| Amy | 2 | $341,045 | 130 | 4.96/5.0 |
| Gordon | 1 | $339,480 | 1 | Not Rated |
| Frank | 2 | $276,037 | 88 | 4.87/5.0 |
| Puako | 1 | $238,943 | 19 | 4.95/5.0 |
| Beachwood Partners EB,LLC | 1 | $227,965 | 2 | Not Rated |
Analyzing the strategies of top hosts, such as their property selection, pricing, and guest communication, can offer valuable lessons for optimizing your own Airbnb operations in Puakō.
Dive Deeper: Advanced Puakō STR Market Data (2026)
Ready to unlock more insights? AirROI provides access to advanced metrics and comprehensive Airbnb data for Puakō. Explore detailed analytics beyond this report to refine your investment strategy, optimize pricing, and maximize your vacation rental profits.
Explore Advanced MetricsPuakō Short-Term Rental Market Composition (2026): Property & Room Types
Room Type Distribution
Property Type Distribution
Market Composition Insights for Puakō
- The Puakō Airbnb market composition is heavily skewed towards Entire Home/Apt listings, which make up 95.2% of the 62 active rentals. This indicates strong guest preference for privacy and space.
- Looking at the property type distribution in Puakō, House properties are the most common (54.8%), reflecting the local real estate landscape.
- Houses represent a significant 54.8% portion, catering likely to families or larger groups.
- The presence of 6.5% Hotel/Boutique listings indicates integration with traditional hospitality.
Puakō Airbnb Room Capacity Analysis (2026): Bedroom Distribution
Distribution of Listings by Number of Bedrooms
Room Capacity Insights for Puakō
- The dominant room capacity in Puakō is 2 bedrooms listings, making up 27.4% of the market. This suggests a strong demand for properties suitable for couples or solo travelers.
- Together, 2 bedrooms and 3 bedrooms properties represent 53.2% of the active Airbnb listings in Puakō, indicating a high concentration in these sizes.
- A significant 51.7% of listings offer 3+ bedrooms, catering to larger groups and families seeking more space in Puakō.
Puakō Vacation Rental Guest Capacity Trends (2026)
Distribution of Listings by Guest Capacity
Guest Capacity Insights for Puakō
- The most common guest capacity trend in Puakō vacation rentals is listings accommodating 6 guests (35.5%). This suggests the primary traveler segment is likely larger groups.
- Properties designed for 6 guests and 8+ guests dominate the Puakō STR market, accounting for 62.9% of listings.
- 64.5% of properties accommodate 6+ guests, serving the market segment for larger families or group travel in Puakō.
- On average, properties in Puakō are equipped to host 5.6 guests.
Puakō Airbnb Booking Patterns (2026): Available vs. Booked Days
Available Days Distribution
Booked Days Distribution
Booking Pattern Insights for Puakō
- The most common availability pattern in Puakō falls within the 271-366 days range, representing 38.7% of listings. This suggests many properties have significant open periods on their calendars.
- Approximately 66.1% of listings show high availability (181+ days open annually), indicating potential for increased bookings or specific owner usage patterns.
- For booked days, the 181-270 days range is most frequent in Puakō (29%), reflecting common guest stay durations or potential owner blocking patterns.
- A notable 35.5% of properties secure long booking periods (181+ days booked per year), highlighting successful long-term rental strategies or significant owner usage.
Puakō Airbnb Minimum Stay Requirements Analysis
Distribution of Listings by Minimum Night Requirement
2 Nights
4 listings
6.5% of total
3 Nights
1 listings
1.6% of total
4-6 Nights
35 listings
56.5% of total
7-29 Nights
4 listings
6.5% of total
30+ Nights
18 listings
29% of total
Key Insights
- The most prevalent minimum stay requirement in Puakō is 4-6 Nights, adopted by 56.5% of listings. This highlights the market's preference for longer commitments.
- Very short stays (1-2 nights) are less common (6.5%), suggesting hosts prefer slightly longer bookings to optimize turnover.
- A significant segment (29%) caters to monthly stays (30+ nights) in Puakō, pointing to opportunities in the extended-stay market.
Recommendations
- Align with the market by considering a 4-6 Nights minimum stay, as 56.5% of Puakō hosts use this setting.
- Explore offering discounts for stays of 30+ nights to attract the 29% of the market seeking extended stays.
- Adjust minimum nights based on seasonality – potentially shorter during low season and longer during peak demand periods in Puakō.
Puakō Airbnb Cancellation Policy Trends Analysis (2026)
Super Strict 30 Days
1 listings
1.6% of total
Limited
1 listings
1.6% of total
Super Strict 60 Days
14 listings
22.6% of total
Flexible
3 listings
4.8% of total
Moderate
1 listings
1.6% of total
Firm
28 listings
45.2% of total
Strict
14 listings
22.6% of total
Cancellation Policy Insights for Puakō
- The prevailing Airbnb cancellation policy trend in Puakō is Firm, used by 45.2% of listings.
- A majority (67.8%) of hosts in Puakō utilize Firm or Strict policies, indicating a market where hosts prioritize booking security.
Recommendations for Hosts
- Consider adopting a Firm policy to align with the 45.2% market standard in Puakō.
- Regularly review your cancellation policy against competitors and market demand shifts in Puakō.
Puakō STR Booking Lead Time Analysis (2026)
Average Booking Lead Time by Month
Booking Lead Time Insights for Puakō
- The overall average booking lead time for vacation rentals in Puakō is 93 days.
- Guests book furthest in advance for stays during January (average 141 days), likely coinciding with peak travel demand or local events.
- The shortest booking windows occur for stays in September (average 64 days), indicating more last-minute travel plans during this time.
- Seasonally, Winter (120 days avg.) sees the longest lead times, while Summer (72 days avg.) has the shortest, reflecting typical travel planning cycles.
Recommendations for Hosts
- Use the overall average lead time (93 days) as a baseline for your pricing and availability strategy in Puakō.
- For January stays, consider implementing length-of-stay discounts or slightly higher rates for bookings made less than 141 days out to capitalize on advance planning.
- Target marketing efforts for the Winter season well in advance (at least 120 days) to capture early planners.
- Monitor your own booking lead times against these Puakō averages to identify opportunities for dynamic pricing adjustments.
Popular & Essential Airbnb Amenities in Puakō (2026)
Amenity Prevalence
Amenity Insights for Puakō
- Essential amenities in Puakō that guests expect include: Kitchen, Wifi, Free parking on premises, Smoke alarm, TV. Lacking these (any) could significantly impact bookings.
- Popular amenities like Washer, Coffee maker, Hair dryer are common but not universal. Offering these can provide a competitive edge.
Recommendations for Hosts
- Ensure your listing includes all essential amenities for Puakō: Kitchen, Wifi, Free parking on premises, Smoke alarm, TV.
- Prioritize adding missing essentials: Free parking on premises, Smoke alarm, TV.
- Consider adding popular differentiators like Washer or Coffee maker to increase appeal.
- Highlight unique or less common amenities you offer (e.g., hot tub, dedicated workspace, EV charger) in your listing description and photos.
- Regularly check competitor amenities in Puakō to stay competitive.
Puakō Airbnb Guest Demographics & Profile Analysis (2026)
Guest Profile Summary for Puakō
- The typical guest profile for Airbnb in Puakō consists of primarily domestic travelers (95%), often arriving from nearby Seattle, typically belonging to the Post-2000s (Gen Z/Alpha) group (50%), primarily speaking English or French.
- Domestic travelers account for 94.6% of guests.
- Key international markets include United States (94.6%) and Canada (1.4%).
- Top languages spoken are English (68%) followed by French (9.7%).
- A significant demographic segment is the Post-2000s (Gen Z/Alpha) group, representing 50% of guests.
Recommendations for Hosts
- Target domestic marketing efforts towards travelers from Seattle and San Francisco.
- Tailor amenities and listing descriptions to appeal to the dominant Post-2000s (Gen Z/Alpha) demographic (e.g., highlight fast WiFi, smart home features, local guides).
- Highlight unique local experiences or amenities relevant to the primary guest profile.
- Consider seasonal promotions aligned with peak travel times for key origin markets.
Nearby Short-Term Rental Market Comparison
How does the Puakō Airbnb market stack up against its neighbors? Compare key performance metrics like average monthly revenue, ADR, and occupancy rates in surrounding areas to understand the broader regional STR landscape.
| Market | Active Properties | Monthly Revenue | Daily Rate | Avg. Occupancy |
|---|---|---|---|---|
| Kula | 11 | $9,130 | $383.13 | 79% |
| Waimea | 416 | $8,098 | $819.38 | 43% |
| Hana | 68 | $7,791 | $413.38 | 65% |
| Makawao | 19 | $7,315 | $437.12 | 67% |
| Kapalua | 297 | $7,140 | $741.15 | 42% |
| Honalo | 24 | $7,044 | $410.83 | 56% |
| Paia | 88 | $6,942 | $546.66 | 49% |
| Wailea-Makena | 11 | $6,581 | $787.33 | 46% |
| Waikoloa Beach Resort | 27 | $6,060 | $544.82 | 46% |
| Kaanapali | 1,624 | $6,028 | $838.76 | 38% |