Princeville Airbnb Market Analysis 2026: Short Term Rental Data & Vacation Rental Statistics in Hawaii, United States
Is Airbnb profitable in Princeville in 2026? Explore comprehensive Airbnb analytics for Princeville, Hawaii, United States to uncover income potential. This 2026 STR market report for Princeville, based on AirROI data from February 2025 to January 2026, reveals key trends in the bustling market of 1,362 active listings.
Whether you're considering an Airbnb investment in Princeville, optimizing your existing vacation rental, or exploring rental arbitrage opportunities, understanding the Princeville Airbnb data is crucial. Navigating the high regulation landscape is key to maximizing your short term rental income potential. Let's dive into the specifics.
Key Princeville Airbnb Performance Metrics Overview
Monthly Airbnb Revenue Variations & Income Potential in Princeville (2026)
Understanding the monthly revenue variations for Airbnb listings in Princeville is key to maximizing your short term rental income potential. Seasonality significantly impacts earnings. Our analysis, based on data from the past 12 months, shows that the peak revenue month for STRs in Princeville is typically July, while January often presents the lowest earnings, highlighting opportunities for strategic pricing adjustments during shoulder and low seasons. Explore the typical Airbnb income in Princeville across different performance tiers:
- Best-in-class properties (Top 10%) achieve $14,715+ monthly, often utilizing dynamic pricing and superior guest experiences.
- Strong performing properties (Top 25%) earn $9,924 or more, indicating effective management and desirable locations/amenities.
- Typical properties (Median) generate around $5,956 per month, representing the average market performance.
- Entry-level properties (Bottom 25%) see earnings around $2,938, often with potential for optimization.
Average Monthly Airbnb Earnings Trend in Princeville
Princeville Airbnb Occupancy Rate Trends (2026)
Maximize your bookings by understanding the Princeville STR occupancy trends. Seasonal demand shifts significantly influence how often properties are booked. Typically, Februarysees the highest demand (peak season occupancy), while January experiences the lowest (low season). Effective strategies, like adjusting minimum stays or offering promotions, can boost occupancy during slower periods. Here's how different property tiers perform in Princeville:
- Best-in-class properties (Top 10%) achieve 89%+ occupancy, indicating high desirability and potentially optimized availability.
- Strong performing properties (Top 25%) maintain 80% or higher occupancy, suggesting good market fit and guest satisfaction.
- Typical properties (Median) have an occupancy rate around 59%.
- Entry-level properties (Bottom 25%) average 26% occupancy, potentially facing higher vacancy.
Average Monthly Occupancy Rate Trend in Princeville
Average Daily Rate (ADR) Airbnb Trends in Princeville (2026)
Effective short term rental pricing strategy in Princeville involves understanding monthly ADR fluctuations. The Average Daily Rate (ADR) for Airbnb in Princeville typically peaks in December and dips lowest during April. Leveraging Airbnb dynamic pricing tools or strategies based on this seasonality can significantly boost revenue. Here's a look at the typical nightly rates achieved:
- Best-in-class properties (Top 10%) command rates of $714+ per night, often due to premium features or locations.
- Strong performing properties (Top 25%) achieve nightly rates of $508 or more.
- Typical properties (Median) charge around $367 per night.
- Entry-level properties (Bottom 25%) earn around $272 per night.
Average Daily Rate (ADR) Trend by Month in Princeville
Get Live Princeville Market Intelligence 👇

Explore Real-time Analytics
Airbnb Seasonality Analysis & Trends in Princeville (2026)
Peak Season (July, June, March)
- Revenue averages $8,321 per month
- Occupancy rates average 60.0%
- Daily rates average $424
Shoulder Season
- Revenue averages $7,297 per month
- Occupancy maintains around 55.2%
- Daily rates hold near $426
Low Season (January, September, November)
- Revenue drops to average $6,314 per month
- Occupancy decreases to average 46.5%
- Daily rates adjust to average $443
Seasonality Insights for Princeville
- The Airbnb seasonality in Princeville shows moderate seasonality with distinct peak and low periods. While the sections above show seasonal averages, it's also insightful to look at the extremes:
- During the high season, the absolute peak month showcases Princeville's highest earning potential, with monthly revenues capable of climbing to $8,984, occupancy reaching a high of 63.6%, and ADRs peaking at $480.
- Conversely, the slowest single month of the year, typically falling within the low season, marks the market's lowest point. In this month, revenue might dip to $5,955, occupancy could drop to 41.3%, and ADRs may adjust down to $400.
- Understanding both the seasonal averages and these monthly peaks and troughs in revenue, occupancy, and ADR is crucial for maximizing your Airbnb profit potential in Princeville.
Seasonal Strategies for Maximizing Profit
- Peak Season: Maximize revenue through premium pricing and potentially longer minimum stays. Ensure high availability.
- Low Season: Offer competitive pricing, special promotions (e.g., extended stay discounts), and flexible cancellation policies. Target off-season travelers like remote workers or budget-conscious guests.
- Shoulder Seasons: Implement dynamic pricing that balances peak and low rates. Target weekend travelers or specific events. Offer slightly more flexible terms than peak season.
- Regularly analyze your own performance against these Princeville seasonality benchmarks and adjust your pricing and availability strategy accordingly.
Best Areas for Airbnb Investment in Princeville (2026)
Exploring the top neighborhoods for short-term rentals in Princeville? This section highlights key areas, outlining why they are attractive for hosts and guests, along with notable local attractions. Consider these locations based on your target guest profile and investment strategy.
| Neighborhood / Area | Why Host Here? (Target Guests & Appeal) | Key Attractions & Landmarks |
|---|---|---|
| Hanalei Bay | Stunning natural beauty with scenic views of the mountains and ocean. A prime destination for those looking for outdoor activities like surfing, snorkeling, and hiking. | Hanalei National Wildlife Refuge, Na Pali Coast State Park, Tunnels Beach, Hanalei National Park, Hanalei River |
| Princeville Golf Club | A premier golf destination with breathtaking ocean views and beautiful courses. Attracts golf enthusiasts and tourists looking for luxury accommodations. | Princeville Makai Golf Club, Princeville Golf Courses, Scenic Overlook, Kauai Path, Princeville Shopping Center |
| Queen's Bath | A natural tide pool surrounded by lava rock, famous for its beauty and unique geological features. A must-see attraction for nature lovers and adventure seekers. | Queen's Bath, Turtle Beach, Cliffside views, Hiking trails, Nearby beaches |
| St. Regis Princeville Resort | Luxurious accommodations with world-class amenities and stunning views of Hanalei Bay. Popular among upscale travelers seeking a high-end experience. | Infinity Pool, Spa Services, Restaurant with ocean view, Private beach access, Golfing |
| Na Pali Coast | Famous for its dramatic cliffs and pristine beaches, attracting hikers and adventure seekers. Offers breathtaking views and outdoor activities. | Kalalau Trail, Boat Tours, Helicopter Tours, Snorkeling, Beach Access |
| Kaweonui Point | Offers stunning ocean views and is a popular spot for sunset watching. Great for those looking for a romantic getaway or peaceful retreat. | Scenic viewpoints, Photography spots, Walking trails, Beach access |
| Anini Beach | Known for its calm waters and beautiful scenery, Anini Beach is perfect for families and those looking for a relaxing beach experience. | Anini Beach Park, Water sports, Snorkeling, Picnic areas, Relaxation |
| Hiking Trails | Princeville is surrounded by beautiful hiking trails, making it a great location for outdoor enthusiasts and those looking to explore nature. | Hiking Trails in Princeville, Scenic Views, Access to Nature, Wildlife Observation, Botanical Gardens |
Understanding Airbnb License Requirements & STR Laws in Princeville (2026)
Yes, Princeville, Hawaii, United States enforces high STR regulations. Obtaining a license and ensuring compliance is almost certainly required according to current 2026 STR laws. Always verify the latest short term rental regulations and Airbnb license requirements directly with local government authorities for Princeville to ensure full compliance before hosting.
(Source: AirROI data, 2026, based on 97% licensed listings)
Top Performing Airbnb Properties in Princeville (2026)
Benchmark your potential! Explore examples of top-performing Airbnb properties in Princevillebased on Trailing Twelve Month (TTM) revenue. Analyze their characteristics, revenue, occupancy rate, and ADR to understand what drives success in this market.
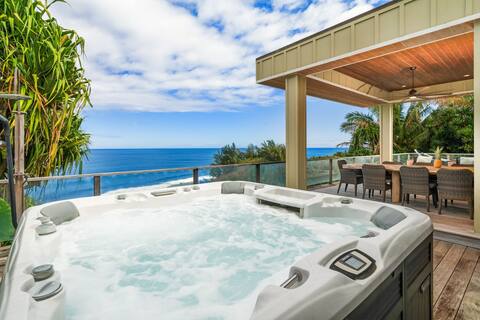
North Shore Kauai Villa with Magnificent View 3559
Entire Place • 4 bedrooms
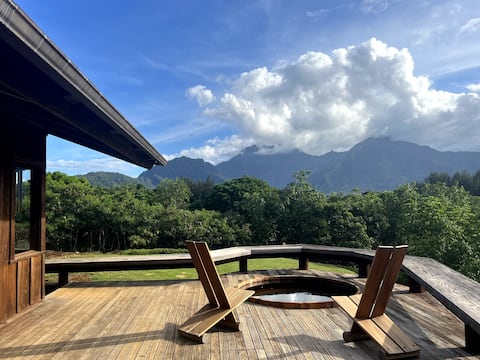
The most unique view of Hanalei Bay
Entire Place • 4 bedrooms
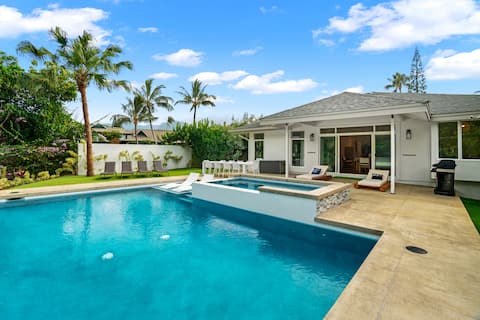
Queens Bath +Renovated home +New pool/hot tub
Entire Place • 5 bedrooms
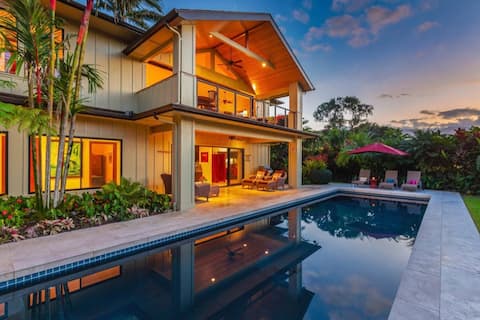
Hale Mikana - Beautiful home w/ Ocean Views & Pool
Entire Place • 4 bedrooms

Queens Bath, Pool and Spa, Ocean Views!
Entire Place • 5 bedrooms
Huge Home w/Private Pool, Jacuzzi & Water Slide!
Entire Place • 5 bedrooms
Note: Performance varies based on location, size, amenities, seasonality, and management quality. Data reflects the past 12 months.
Top Performing Airbnb Hosts in Princeville (2026)
Learn from the best! This table showcases top-performing Airbnb hosts in Princeville based on the number of properties managed and estimated total revenue over the past year. Analyze their scale and performance metrics.
| Host Name | Properties | Grossing Revenue | Stay Reviews | Avg Rating |
|---|---|---|---|---|
| Shana | 46 | $4,355,735 | 4879 | 4.91/5.0 |
| Arthur William | 36 | $4,090,080 | 1586 | 4.82/5.0 |
| Gather | 32 | $3,574,069 | 920 | 4.91/5.0 |
| Hawaii Life Rentals | 34 | $3,477,697 | 828 | 4.80/5.0 |
| Ian | 17 | $2,765,077 | 838 | 4.95/5.0 |
| Donna | 38 | $2,474,745 | 1637 | 4.69/5.0 |
| Kauai Kahuna Vacation Rentals | 34 | $2,247,768 | 1651 | 4.70/5.0 |
| Makana Kauai Properties | 22 | $1,784,127 | 236 | 4.86/5.0 |
| Paul | 13 | $1,757,878 | 997 | 4.94/5.0 |
| Lauren | 9 | $1,507,234 | 831 | 4.94/5.0 |
Analyzing the strategies of top hosts, such as their property selection, pricing, and guest communication, can offer valuable lessons for optimizing your own Airbnb operations in Princeville.
Dive Deeper: Advanced Princeville STR Market Data (2026)
Ready to unlock more insights? AirROI provides access to advanced metrics and comprehensive Airbnb data for Princeville. Explore detailed analytics beyond this report to refine your investment strategy, optimize pricing, and maximize your vacation rental profits.
Explore Advanced MetricsPrinceville Short-Term Rental Market Composition (2026): Property & Room Types
Room Type Distribution
Property Type Distribution
Market Composition Insights for Princeville
- The Princeville Airbnb market composition is heavily skewed towards Entire Home/Apt listings, which make up 96.9% of the 1,362 active rentals. This indicates strong guest preference for privacy and space.
- Looking at the property type distribution in Princeville, Apartment/Condo properties are the most common (72.2%), reflecting the local real estate landscape.
- Houses represent a significant 24.2% portion, catering likely to families or larger groups.
- Smaller segments like hotel/boutique, others, unique stays (combined 3.5%) offer potential for unique stay experiences.
Princeville Airbnb Room Capacity Analysis (2026): Bedroom Distribution
Distribution of Listings by Number of Bedrooms
Room Capacity Insights for Princeville
- The dominant room capacity in Princeville is 2 bedrooms listings, making up 39.4% of the market. This suggests a strong demand for properties suitable for couples or solo travelers.
- Together, 2 bedrooms and 1 bedroom properties represent 70.6% of the active Airbnb listings in Princeville, indicating a high concentration in these sizes.
- A significant 22.1% of listings offer 3+ bedrooms, catering to larger groups and families seeking more space in Princeville.
Princeville Vacation Rental Guest Capacity Trends (2026)
Distribution of Listings by Guest Capacity
Guest Capacity Insights for Princeville
- The most common guest capacity trend in Princeville vacation rentals is listings accommodating 4 guests (34.8%). This suggests the primary traveler segment is likely small families or groups.
- Properties designed for 4 guests and 6 guests dominate the Princeville STR market, accounting for 65.2% of listings.
- 44.6% of properties accommodate 6+ guests, serving the market segment for larger families or group travel in Princeville.
- On average, properties in Princeville are equipped to host 4.9 guests.
Princeville Airbnb Booking Patterns (2026): Available vs. Booked Days
Available Days Distribution
Booked Days Distribution
Booking Pattern Insights for Princeville
- The most common availability pattern in Princeville falls within the 271-366 days range, representing 38.3% of listings. This suggests many properties have significant open periods on their calendars.
- Approximately 58.0% of listings show high availability (181+ days open annually), indicating potential for increased bookings or specific owner usage patterns.
- For booked days, the 31-90 days range is most frequent in Princeville (24.7%), reflecting common guest stay durations or potential owner blocking patterns.
- A notable 42.9% of properties secure long booking periods (181+ days booked per year), highlighting successful long-term rental strategies or significant owner usage.
Princeville Airbnb Minimum Stay Requirements Analysis
Distribution of Listings by Minimum Night Requirement
1 Night
118 listings
8.7% of total
2 Nights
378 listings
27.8% of total
3 Nights
120 listings
8.8% of total
4-6 Nights
84 listings
6.2% of total
7-29 Nights
5 listings
0.4% of total
30+ Nights
656 listings
48.2% of total
Key Insights
- The most prevalent minimum stay requirement in Princeville is 30+ Nights, adopted by 48.2% of listings. This highlights the market's preference for longer commitments.
- A significant segment (48.2%) caters to monthly stays (30+ nights) in Princeville, pointing to opportunities in the extended-stay market.
Recommendations
- Align with the market by considering a 30+ Nights minimum stay, as 48.2% of Princeville hosts use this setting.
- If feasible, allowing 1-night stays, especially midweek or during low season, could capture last-minute bookings, as only 8.7% currently do.
- Explore offering discounts for stays of 30+ nights to attract the 48.2% of the market seeking extended stays.
- Adjust minimum nights based on seasonality – potentially shorter during low season and longer during peak demand periods in Princeville.
Princeville Airbnb Cancellation Policy Trends Analysis (2026)
Super Strict 30 Days
159 listings
11.7% of total
Super Strict 60 Days
114 listings
8.4% of total
Limited
9 listings
0.7% of total
Flexible
19 listings
1.4% of total
Moderate
99 listings
7.3% of total
Firm
524 listings
38.6% of total
Strict
433 listings
31.9% of total
Cancellation Policy Insights for Princeville
- The prevailing Airbnb cancellation policy trend in Princeville is Firm, used by 38.6% of listings.
- A majority (70.5%) of hosts in Princeville utilize Firm or Strict policies, indicating a market where hosts prioritize booking security.
Recommendations for Hosts
- Consider adopting a Firm policy to align with the 38.6% market standard in Princeville.
- With 31.9% using Strict terms, this is a viable option in Princeville, particularly for high-value properties or during peak demand periods.
- Regularly review your cancellation policy against competitors and market demand shifts in Princeville.
Princeville STR Booking Lead Time Analysis (2026)
Average Booking Lead Time by Month
Booking Lead Time Insights for Princeville
- The overall average booking lead time for vacation rentals in Princeville is 73 days.
- Guests book furthest in advance for stays during April (average 80 days), likely coinciding with peak travel demand or local events.
- The shortest booking windows occur for stays in August (average 67 days), indicating more last-minute travel plans during this time.
- Seasonally, Winter (75 days avg.) sees the longest lead times, while Summer (74 days avg.) has the shortest, reflecting typical travel planning cycles.
Recommendations for Hosts
- Use the overall average lead time (73 days) as a baseline for your pricing and availability strategy in Princeville.
- Target marketing efforts for the Winter season well in advance (at least 75 days) to capture early planners.
- Monitor your own booking lead times against these Princeville averages to identify opportunities for dynamic pricing adjustments.
Popular & Essential Airbnb Amenities in Princeville (2026)
Amenity Prevalence
Amenity Insights for Princeville
- Essential amenities in Princeville that guests expect include: Wifi, TV, Smoke alarm. Lacking these (any) could significantly impact bookings.
- Popular amenities like Hair dryer, Essentials, Washer are common but not universal. Offering these can provide a competitive edge.
Recommendations for Hosts
- Ensure your listing includes all essential amenities for Princeville: Wifi, TV, Smoke alarm.
- Prioritize adding missing essentials: Wifi, TV, Smoke alarm.
- Consider adding popular differentiators like Hair dryer or Essentials to increase appeal.
- Highlight unique or less common amenities you offer (e.g., hot tub, dedicated workspace, EV charger) in your listing description and photos.
- Regularly check competitor amenities in Princeville to stay competitive.
Princeville Airbnb Guest Demographics & Profile Analysis (2026)
Guest Profile Summary for Princeville
- The typical guest profile for Airbnb in Princeville consists of primarily domestic travelers (91%), often arriving from nearby Los Angeles, typically belonging to the Post-2000s (Gen Z/Alpha) group (50%), primarily speaking English or Spanish.
- Domestic travelers account for 91.0% of guests.
- Key international markets include United States (91%) and Canada (2.6%).
- Top languages spoken are English (65%) followed by Spanish (11.8%).
- A significant demographic segment is the Post-2000s (Gen Z/Alpha) group, representing 50% of guests.
Recommendations for Hosts
- Target domestic marketing efforts towards travelers from Los Angeles and San Francisco.
- Tailor amenities and listing descriptions to appeal to the dominant Post-2000s (Gen Z/Alpha) demographic (e.g., highlight fast WiFi, smart home features, local guides).
- Highlight unique local experiences or amenities relevant to the primary guest profile.
- Consider seasonal promotions aligned with peak travel times for key origin markets.
Nearby Short-Term Rental Market Comparison
How does the Princeville Airbnb market stack up against its neighbors? Compare key performance metrics like average monthly revenue, ADR, and occupancy rates in surrounding areas to understand the broader regional STR landscape.
| Market | Active Properties | Monthly Revenue | Daily Rate | Avg. Occupancy |
|---|---|---|---|---|
| Haena | 12 | $14,312 | $1130.41 | 51% |
| Anahola | 22 | $13,673 | $845.34 | 54% |
| Mākaha Valley | 96 | $13,116 | $669.71 | 70% |
| Kilauea | 45 | $9,733 | $1064.42 | 50% |
| Kekaha | 14 | $9,595 | $545.34 | 65% |
| Koloa | 266 | $8,991 | $942.59 | 48% |
| Hanalei | 426 | $6,937 | $560.08 | 50% |
| Poipu | 1,140 | $6,673 | $596.99 | 48% |
| Kapolei | 520 | $6,393 | $688.27 | 44% |
| Kapaa | 233 | $5,645 | $425.03 | 53% |