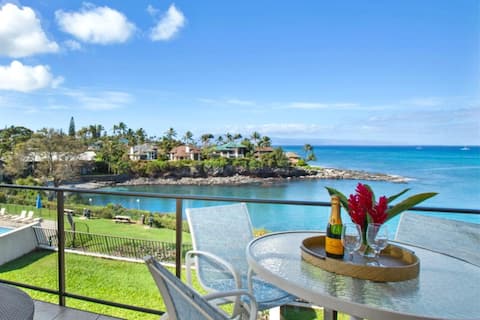
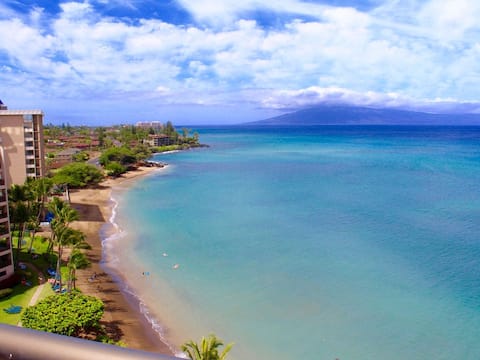
Napili Airbnb Market Analysis 2026: Short Term Rental Data & Vacation Rental Statistics in Hawaii, United States
Is Airbnb profitable in Napili in 2026? Explore comprehensive Airbnb analytics for Napili, Hawaii, United States to uncover income potential. This 2026 STR market report for Napili, based on AirROI data from February 2025 to January 2026, reveals key trends in the market of 373 active listings.
Whether you're considering an Airbnb investment in Napili, optimizing your existing vacation rental, or exploring rental arbitrage opportunities, understanding the Napili Airbnb data is crucial. Navigating the high regulation landscape is key to maximizing your short term rental income potential. Let's dive into the specifics.
Key Napili Airbnb Performance Metrics Overview
Monthly Airbnb Revenue Variations & Income Potential in Napili (2026)
Understanding the monthly revenue variations for Airbnb listings in Napili is key to maximizing your short term rental income potential. Seasonality significantly impacts earnings. Our analysis, based on data from the past 12 months, shows that the peak revenue month for STRs in Napili is typically February, while September often presents the lowest earnings, highlighting opportunities for strategic pricing adjustments during shoulder and low seasons. Explore the typical Airbnb income in Napili across different performance tiers:
- Best-in-class properties (Top 10%) achieve $12,212+ monthly, often utilizing dynamic pricing and superior guest experiences.
- Strong performing properties (Top 25%) earn $8,158 or more, indicating effective management and desirable locations/amenities.
- Typical properties (Median) generate around $5,384 per month, representing the average market performance.
- Entry-level properties (Bottom 25%) see earnings around $3,098, often with potential for optimization.
Average Monthly Airbnb Earnings Trend in Napili
Napili Airbnb Occupancy Rate Trends (2026)
Maximize your bookings by understanding the Napili STR occupancy trends. Seasonal demand shifts significantly influence how often properties are booked. Typically, Februarysees the highest demand (peak season occupancy), while January experiences the lowest (low season). Effective strategies, like adjusting minimum stays or offering promotions, can boost occupancy during slower periods. Here's how different property tiers perform in Napili:
- Best-in-class properties (Top 10%) achieve 89%+ occupancy, indicating high desirability and potentially optimized availability.
- Strong performing properties (Top 25%) maintain 80% or higher occupancy, suggesting good market fit and guest satisfaction.
- Typical properties (Median) have an occupancy rate around 56%.
- Entry-level properties (Bottom 25%) average 27% occupancy, potentially facing higher vacancy.
Average Monthly Occupancy Rate Trend in Napili
Average Daily Rate (ADR) Airbnb Trends in Napili (2026)
Effective short term rental pricing strategy in Napili involves understanding monthly ADR fluctuations. The Average Daily Rate (ADR) for Airbnb in Napili typically peaks in January and dips lowest during May. Leveraging Airbnb dynamic pricing tools or strategies based on this seasonality can significantly boost revenue. Here's a look at the typical nightly rates achieved:
- Best-in-class properties (Top 10%) command rates of $682+ per night, often due to premium features or locations.
- Strong performing properties (Top 25%) achieve nightly rates of $452 or more.
- Typical properties (Median) charge around $343 per night.
- Entry-level properties (Bottom 25%) earn around $269 per night.
Average Daily Rate (ADR) Trend by Month in Napili
Get Live Napili Market Intelligence 👇

Explore Real-time Analytics
Airbnb Seasonality Analysis & Trends in Napili (2026)
Peak Season (February, March, July)
- Revenue averages $7,937 per month
- Occupancy rates average 62.1%
- Daily rates average $450
Shoulder Season
- Revenue averages $6,289 per month
- Occupancy maintains around 51.1%
- Daily rates hold near $453
Low Season (June, August, September)
- Revenue drops to average $5,689 per month
- Occupancy decreases to average 49.0%
- Daily rates adjust to average $421
Seasonality Insights for Napili
- The Airbnb seasonality in Napili shows moderate seasonality with distinct peak and low periods. While the sections above show seasonal averages, it's also insightful to look at the extremes:
- During the high season, the absolute peak month showcases Napili's highest earning potential, with monthly revenues capable of climbing to $8,373, occupancy reaching a high of 68.5%, and ADRs peaking at $518.
- Conversely, the slowest single month of the year, typically falling within the low season, marks the market's lowest point. In this month, revenue might dip to $5,576, occupancy could drop to 44.8%, and ADRs may adjust down to $409.
- Understanding both the seasonal averages and these monthly peaks and troughs in revenue, occupancy, and ADR is crucial for maximizing your Airbnb profit potential in Napili.
Seasonal Strategies for Maximizing Profit
- Peak Season: Maximize revenue through premium pricing and potentially longer minimum stays. Ensure high availability.
- Low Season: Offer competitive pricing, special promotions (e.g., extended stay discounts), and flexible cancellation policies. Target off-season travelers like remote workers or budget-conscious guests.
- Shoulder Seasons: Implement dynamic pricing that balances peak and low rates. Target weekend travelers or specific events. Offer slightly more flexible terms than peak season.
- Regularly analyze your own performance against these Napili seasonality benchmarks and adjust your pricing and availability strategy accordingly.
Best Areas for Airbnb Investment in Napili (2026)
Exploring the top neighborhoods for short-term rentals in Napili? This section highlights key areas, outlining why they are attractive for hosts and guests, along with notable local attractions. Consider these locations based on your target guest profile and investment strategy.
| Neighborhood / Area | Why Host Here? (Target Guests & Appeal) | Key Attractions & Landmarks |
|---|---|---|
| Napili Bay | A stunning beach known for its golden sands and clear waters, making it a favorite for families and beach lovers. Guests can enjoy snorkeling, swimming, and relaxing on the beach. | Napili Beach, Kapalu Bay, Napili Bay Beach Park, Maui Sailing Canoe, Honoapiilani Highway |
| Kapalua | Renowned for its luxury resorts, golf courses, and stunning views. Kapalua appeals to high-end travelers looking for a premium experience in a serene setting. | Kapalua Beach, Napili Bay, The Plantation Course, Kapalua Resort, Dragon's Teeth |
| Lahaina | Rich in history and culture, Lahaina offers a vibrant town atmosphere with plenty of dining, shopping, and art galleries. It’s a highly sought-after location for tourists and has a lively nightlife. | Front Street, Maui Theater, Banyan Tree Park, Lahaina Harbor, Lahaina Historic Trail |
| Kahana | A quieter area with beautiful beaches and excellent ocean activities. Kahana is favored by travelers looking for a more laid-back Hawaiian experience with access to various water sports. | Kahana Beach, Ka'opala Beach, Napili Kai Beach Resort, Kahului Shopping Center |
| Honokowai | Features beautiful beaches and is conveniently located between Kapalua and Lahaina. It attracts tourists who want to enjoy both relaxed beach days and access to local attractions. | Honokowai Beach Park, Ka'anapali Beach, Maui Ocean Center, Lahaina Cannery Mall |
| Ka'anapali | Famous for its stunning beaches, luxury resorts, and vibrant nightlife. Ka'anapali is a major tourist destination that offers numerous activities for visitors. | Black Rock Beach, Whalers Village, Ka'anapali Beach, Maui Golf Club |
| Molokai Island | Known as 'The Friendly Isle', it offers a more authentic Hawaiian experience, away from the hustle and bustle of other tourist spots. Great for eco-tourism and cultural experiences. | Kalaupapa National Historical Park, Halawa Valley, Papohaku Beach |
| Maui Ocean Center | A marine park showcasing the local marine life. It attracts families and nature lovers interested in learning about underwater ecosystems and the importance of ocean conservation. | Maui Ocean Center Aquarium |
Understanding Airbnb License Requirements & STR Laws in Napili (2026)
Yes, Napili, Hawaii, United States enforces high STR regulations. Obtaining a license and ensuring compliance is almost certainly required according to current 2026 STR laws. Always verify the latest short term rental regulations and Airbnb license requirements directly with local government authorities for Napili to ensure full compliance before hosting.
(Source: AirROI data, 2026, based on 98% licensed listings)
Top Performing Airbnb Properties in Napili (2026)
Benchmark your potential! Explore examples of top-performing Airbnb properties in Napilibased on Trailing Twelve Month (TTM) revenue. Analyze their characteristics, revenue, occupancy rate, and ADR to understand what drives success in this market.
Napili Point C31 | FREE CAR | KBM Resorts
Entire Place • 2 bedrooms

Oceanfront Turtle Cove Maui Pole House Estate
Entire Place • 5 bedrooms
Penthouse on Sandy Swimmable Beach Incredible View
Entire Place • 3 bedrooms

Spacious 4-BR Oceanfront 2Condos with Central AC
Entire Place • 4 bedrooms

Napili Point B26 | FREE CAR | KBM Resorts
Entire Place • 1 bedroom

Kahana Outrigger #4A2 - Vacation West Maui
Entire Place • 3 bedrooms
Note: Performance varies based on location, size, amenities, seasonality, and management quality. Data reflects the past 12 months.
Top Performing Airbnb Hosts in Napili (2026)
Learn from the best! This table showcases top-performing Airbnb hosts in Napili based on the number of properties managed and estimated total revenue over the past year. Analyze their scale and performance metrics.
| Host Name | Properties | Grossing Revenue | Stay Reviews | Avg Rating |
|---|---|---|---|---|
| K B M Resort Rentals Resorts | 9 | $1,482,693 | 43 | 4.27/5.0 |
| Maui Paradise Properties | 23 | $1,242,259 | 702 | 4.65/5.0 |
| Stay Aloha | 14 | $1,105,766 | 523 | 4.90/5.0 |
| My Perfect Stays Team | 31 | $1,028,650 | 567 | 4.73/5.0 |
| Joseph | 9 | $962,249 | 700 | 4.92/5.0 |
| Jill | 8 | $812,286 | 484 | 4.92/5.0 |
| Chase 'N Rainbows By Castle Re | 10 | $526,657 | 132 | 4.61/5.0 |
| Sullivan Properties | 22 | $515,635 | 204 | 4.58/5.0 |
| Hawaii Vacation Condos By OUTR | 13 | $420,714 | 28 | 4.71/5.0 |
| Cynthia | 2 | $417,933 | 261 | 4.99/5.0 |
Analyzing the strategies of top hosts, such as their property selection, pricing, and guest communication, can offer valuable lessons for optimizing your own Airbnb operations in Napili.
Dive Deeper: Advanced Napili STR Market Data (2026)
Ready to unlock more insights? AirROI provides access to advanced metrics and comprehensive Airbnb data for Napili. Explore detailed analytics beyond this report to refine your investment strategy, optimize pricing, and maximize your vacation rental profits.
Explore Advanced MetricsNapili Short-Term Rental Market Composition (2026): Property & Room Types
Room Type Distribution
Property Type Distribution
Market Composition Insights for Napili
- The Napili Airbnb market composition is heavily skewed towards Entire Home/Apt listings, which make up 99.2% of the 373 active rentals. This indicates strong guest preference for privacy and space.
- Looking at the property type distribution in Napili, Apartment/Condo properties are the most common (93.3%), reflecting the local real estate landscape.
- Smaller segments like hotel/boutique (combined 0.3%) offer potential for unique stay experiences.
Napili Airbnb Room Capacity Analysis (2026): Bedroom Distribution
Distribution of Listings by Number of Bedrooms
Room Capacity Insights for Napili
- The dominant room capacity in Napili is 1 bedroom listings, making up 46.1% of the market. This suggests a strong demand for properties suitable for couples or solo travelers.
- Together, 1 bedroom and 2 bedrooms properties represent 75.3% of the active Airbnb listings in Napili, indicating a high concentration in these sizes.
- Listings with 3+ bedrooms (6.9%) represent a smaller niche, potentially indicating an underserved market for larger group accommodations in Napili.
Napili Vacation Rental Guest Capacity Trends (2026)
Distribution of Listings by Guest Capacity
Guest Capacity Insights for Napili
- The most common guest capacity trend in Napili vacation rentals is listings accommodating 4 guests (38.3%). This suggests the primary traveler segment is likely small families or groups.
- Properties designed for 4 guests and 6 guests dominate the Napili STR market, accounting for 62.4% of listings.
- 30.5% of properties accommodate 6+ guests, serving the market segment for larger families or group travel in Napili.
- On average, properties in Napili are equipped to host 4.3 guests.
Napili Airbnb Booking Patterns (2026): Available vs. Booked Days
Available Days Distribution
Booked Days Distribution
Booking Pattern Insights for Napili
- The most common availability pattern in Napili falls within the 271-366 days range, representing 39.1% of listings. This suggests many properties have significant open periods on their calendars.
- Approximately 65.4% of listings show high availability (181+ days open annually), indicating potential for increased bookings or specific owner usage patterns.
- For booked days, the 91-180 days range is most frequent in Napili (25.7%), reflecting common guest stay durations or potential owner blocking patterns.
- A notable 35.9% of properties secure long booking periods (181+ days booked per year), highlighting successful long-term rental strategies or significant owner usage.
Napili Airbnb Minimum Stay Requirements Analysis
Distribution of Listings by Minimum Night Requirement
1 Night
35 listings
9.4% of total
2 Nights
52 listings
13.9% of total
3 Nights
45 listings
12.1% of total
4-6 Nights
48 listings
12.9% of total
7-29 Nights
3 listings
0.8% of total
30+ Nights
190 listings
50.9% of total
Key Insights
- The most prevalent minimum stay requirement in Napili is 30+ Nights, adopted by 50.9% of listings. This highlights the market's preference for longer commitments.
- A significant segment (50.9%) caters to monthly stays (30+ nights) in Napili, pointing to opportunities in the extended-stay market.
Recommendations
- Align with the market by considering a 30+ Nights minimum stay, as 50.9% of Napili hosts use this setting.
- If feasible, allowing 1-night stays, especially midweek or during low season, could capture last-minute bookings, as only 9.4% currently do.
- Explore offering discounts for stays of 30+ nights to attract the 50.9% of the market seeking extended stays.
- Adjust minimum nights based on seasonality – potentially shorter during low season and longer during peak demand periods in Napili.
Napili Airbnb Cancellation Policy Trends Analysis (2026)
Super Strict 30 Days
32 listings
8.6% of total
Super Strict 60 Days
62 listings
16.6% of total
Limited
6 listings
1.6% of total
Flexible
4 listings
1.1% of total
Moderate
26 listings
7% of total
Firm
148 listings
39.7% of total
Strict
95 listings
25.5% of total
Cancellation Policy Insights for Napili
- The prevailing Airbnb cancellation policy trend in Napili is Firm, used by 39.7% of listings.
- A majority (65.2%) of hosts in Napili utilize Firm or Strict policies, indicating a market where hosts prioritize booking security.
Recommendations for Hosts
- Consider adopting a Firm policy to align with the 39.7% market standard in Napili.
- Regularly review your cancellation policy against competitors and market demand shifts in Napili.
Napili STR Booking Lead Time Analysis (2026)
Average Booking Lead Time by Month
Booking Lead Time Insights for Napili
- The overall average booking lead time for vacation rentals in Napili is 92 days.
- Guests book furthest in advance for stays during January (average 120 days), likely coinciding with peak travel demand or local events.
- The shortest booking windows occur for stays in August (average 75 days), indicating more last-minute travel plans during this time.
- Seasonally, Winter (114 days avg.) sees the longest lead times, while Summer (79 days avg.) has the shortest, reflecting typical travel planning cycles.
Recommendations for Hosts
- Use the overall average lead time (92 days) as a baseline for your pricing and availability strategy in Napili.
- For January stays, consider implementing length-of-stay discounts or slightly higher rates for bookings made less than 120 days out to capitalize on advance planning.
- Target marketing efforts for the Winter season well in advance (at least 114 days) to capture early planners.
- Monitor your own booking lead times against these Napili averages to identify opportunities for dynamic pricing adjustments.
Popular & Essential Airbnb Amenities in Napili (2026)
Amenity Prevalence
Amenity Insights for Napili
- Essential amenities in Napili that guests expect include: Wifi, TV, Smoke alarm, Hair dryer, Coffee maker, Kitchen, Microwave. Lacking these (any) could significantly impact bookings.
- Popular amenities like Refrigerator, Pool, Dishes and silverware are common but not universal. Offering these can provide a competitive edge.
- A pool is a highly desired but not standard amenity, making it a key feature for attracting guests seeking leisure in Napili.
Recommendations for Hosts
- Ensure your listing includes all essential amenities for Napili: Wifi, TV, Smoke alarm, Hair dryer, Coffee maker, Kitchen, Microwave.
- Prioritize adding missing essentials: Wifi, TV, Smoke alarm, Hair dryer, Coffee maker, Kitchen, Microwave.
- Consider adding popular differentiators like Refrigerator or Pool to increase appeal.
- Highlight unique or less common amenities you offer (e.g., hot tub, dedicated workspace, EV charger) in your listing description and photos.
- Regularly check competitor amenities in Napili to stay competitive.
Napili Airbnb Guest Demographics & Profile Analysis (2026)
Guest Profile Summary for Napili
- The typical guest profile for Airbnb in Napili consists of primarily domestic travelers (89%), often arriving from nearby Los Angeles, typically belonging to the Post-2000s (Gen Z/Alpha) group (50%), primarily speaking English or Spanish.
- Domestic travelers account for 89.1% of guests.
- Key international markets include United States (89.1%) and Canada (4.8%).
- Top languages spoken are English (65.6%) followed by Spanish (10.8%).
- A significant demographic segment is the Post-2000s (Gen Z/Alpha) group, representing 50% of guests.
Recommendations for Hosts
- Target domestic marketing efforts towards travelers from Los Angeles and Seattle.
- Tailor amenities and listing descriptions to appeal to the dominant Post-2000s (Gen Z/Alpha) demographic (e.g., highlight fast WiFi, smart home features, local guides).
- Highlight unique local experiences or amenities relevant to the primary guest profile.
- Consider seasonal promotions aligned with peak travel times for key origin markets.
Nearby Short-Term Rental Market Comparison
How does the Napili Airbnb market stack up against its neighbors? Compare key performance metrics like average monthly revenue, ADR, and occupancy rates in surrounding areas to understand the broader regional STR landscape.
| Market | Active Properties | Monthly Revenue | Daily Rate | Avg. Occupancy |
|---|---|---|---|---|
| Kahuku | 287 | $11,358 | $679.39 | 64% |
| Kula | 11 | $9,130 | $383.13 | 79% |
| Waimea | 416 | $8,098 | $819.38 | 43% |
| Puakō | 62 | $7,820 | $874.88 | 44% |
| Hana | 68 | $7,791 | $413.38 | 65% |
| Makawao | 19 | $7,315 | $437.12 | 67% |
| Kapalua | 297 | $7,140 | $741.15 | 42% |
| Honalo | 24 | $7,044 | $410.83 | 56% |
| Paia | 88 | $6,942 | $546.66 | 49% |
| Wailea-Makena | 11 | $6,581 | $787.33 | 46% |