Naalehu Airbnb Market Analysis 2026: Short Term Rental Data & Vacation Rental Statistics in Hawaii, United States
Is Airbnb profitable in Naalehu in 2026? Explore comprehensive Airbnb analytics for Naalehu, Hawaii, United States to uncover income potential. This 2026 STR market report for Naalehu, based on AirROI data from February 2025 to January 2026, reveals key trends in the niche market of 47 active listings.
Whether you're considering an Airbnb investment in Naalehu, optimizing your existing vacation rental, or exploring rental arbitrage opportunities, understanding the Naalehu Airbnb data is crucial. Navigating the high regulation landscape is key to maximizing your short term rental income potential. Let's dive into the specifics.
Key Naalehu Airbnb Performance Metrics Overview
Monthly Airbnb Revenue Variations & Income Potential in Naalehu (2026)
Understanding the monthly revenue variations for Airbnb listings in Naalehu is key to maximizing your short term rental income potential. Seasonality significantly impacts earnings. Our analysis, based on data from the past 12 months, shows that the peak revenue month for STRs in Naalehu is typically February, while September often presents the lowest earnings, highlighting opportunities for strategic pricing adjustments during shoulder and low seasons. Explore the typical Airbnb income in Naalehu across different performance tiers:
- Best-in-class properties (Top 10%) achieve $4,729+ monthly, often utilizing dynamic pricing and superior guest experiences.
- Strong performing properties (Top 25%) earn $3,164 or more, indicating effective management and desirable locations/amenities.
- Typical properties (Median) generate around $1,931 per month, representing the average market performance.
- Entry-level properties (Bottom 25%) see earnings around $1,034, often with potential for optimization.
Average Monthly Airbnb Earnings Trend in Naalehu
Naalehu Airbnb Occupancy Rate Trends (2026)
Maximize your bookings by understanding the Naalehu STR occupancy trends. Seasonal demand shifts significantly influence how often properties are booked. Typically, Februarysees the highest demand (peak season occupancy), while June experiences the lowest (low season). Effective strategies, like adjusting minimum stays or offering promotions, can boost occupancy during slower periods. Here's how different property tiers perform in Naalehu:
- Best-in-class properties (Top 10%) achieve 83%+ occupancy, indicating high desirability and potentially optimized availability.
- Strong performing properties (Top 25%) maintain 70% or higher occupancy, suggesting good market fit and guest satisfaction.
- Typical properties (Median) have an occupancy rate around 48%.
- Entry-level properties (Bottom 25%) average 30% occupancy, potentially facing higher vacancy.
Average Monthly Occupancy Rate Trend in Naalehu
Average Daily Rate (ADR) Airbnb Trends in Naalehu (2026)
Effective short term rental pricing strategy in Naalehu involves understanding monthly ADR fluctuations. The Average Daily Rate (ADR) for Airbnb in Naalehu typically peaks in January and dips lowest during March. Leveraging Airbnb dynamic pricing tools or strategies based on this seasonality can significantly boost revenue. Here's a look at the typical nightly rates achieved:
- Best-in-class properties (Top 10%) command rates of $278+ per night, often due to premium features or locations.
- Strong performing properties (Top 25%) achieve nightly rates of $193 or more.
- Typical properties (Median) charge around $144 per night.
- Entry-level properties (Bottom 25%) earn around $104 per night.
Average Daily Rate (ADR) Trend by Month in Naalehu
Get Live Naalehu Market Intelligence 👇

Explore Real-time Analytics
Airbnb Seasonality Analysis & Trends in Naalehu (2026)
Peak Season (February, January, March)
- Revenue averages $2,778 per month
- Occupancy rates average 60.6%
- Daily rates average $157
Shoulder Season
- Revenue averages $2,274 per month
- Occupancy maintains around 47.9%
- Daily rates hold near $164
Low Season (June, July, September)
- Revenue drops to average $2,126 per month
- Occupancy decreases to average 43.3%
- Daily rates adjust to average $164
Seasonality Insights for Naalehu
- The Airbnb seasonality in Naalehu shows moderate seasonality with distinct peak and low periods. While the sections above show seasonal averages, it's also insightful to look at the extremes:
- During the high season, the absolute peak month showcases Naalehu's highest earning potential, with monthly revenues capable of climbing to $2,936, occupancy reaching a high of 70.6%, and ADRs peaking at $175.
- Conversely, the slowest single month of the year, typically falling within the low season, marks the market's lowest point. In this month, revenue might dip to $2,008, occupancy could drop to 41.6%, and ADRs may adjust down to $148.
- Understanding both the seasonal averages and these monthly peaks and troughs in revenue, occupancy, and ADR is crucial for maximizing your Airbnb profit potential in Naalehu.
Seasonal Strategies for Maximizing Profit
- Peak Season: Maximize revenue through premium pricing and potentially longer minimum stays. Ensure high availability.
- Low Season: Offer competitive pricing, special promotions (e.g., extended stay discounts), and flexible cancellation policies. Target off-season travelers like remote workers or budget-conscious guests.
- Shoulder Seasons: Implement dynamic pricing that balances peak and low rates. Target weekend travelers or specific events. Offer slightly more flexible terms than peak season.
- Regularly analyze your own performance against these Naalehu seasonality benchmarks and adjust your pricing and availability strategy accordingly.
Best Areas for Airbnb Investment in Naalehu (2026)
Exploring the top neighborhoods for short-term rentals in Naalehu? This section highlights key areas, outlining why they are attractive for hosts and guests, along with notable local attractions. Consider these locations based on your target guest profile and investment strategy.
| Neighborhood / Area | Why Host Here? (Target Guests & Appeal) | Key Attractions & Landmarks |
|---|---|---|
| Punalu'u Black Sand Beach | A stunning natural phenomenon that attracts both tourists and locals, known for its unique black sand and scenic views. It's a popular spot for swimming, sunbathing, and picnicking. | Punalu'u Beach Park, Black Sand Beach, Palm Trees and Turtles, Sea Turtle Viewing, Hiking Trails |
| South Point (Ka Lae) | The southernmost point in the United States, known for its breathtaking cliffs and ocean views. A must-visit for tourists looking for adventure and photography spots. | Green Sand Beach, Cliff Diving, Scenic Views, Hiking Trails, Historical Significance |
| Hawaii Volcanoes National Park | A national park that showcases the active Kilauea volcano and diverse ecosystems. Attracts nature lovers and adventure seekers for hiking and camping. | Kilauea Visitor Center, Chain of Craters Road, Thurston Lava Tube, Hiking Trails, Steam Vents |
| Naalehu Town | A charming small town with local cafes and shops, serving as a gateway to the Southern Hawaii attractions. Offers a unique slice of Hawaiian life. | Naalehu Farmers Market, Local Eateries, Scenic Views, Hawaiian Culture, Art Galleries |
| Kau Coffee Mill | Famous for its coffee plantation tours and tastings. Attracts coffee enthusiasts and tourists looking to learn about local agriculture. | Coffee Tours, Coffee Tasting, Local Gift Shop, Scenic Views, Educational Tours |
| Manuka State Wayside | A hidden gem with beautiful scenery and access to hiking. Attracts visitors seeking tranquility and natural beauty away from crowded areas. | Hiking Trails, Scenic Lookouts, Wildlife Viewing, Picnic Areas, Nature Walks |
| Pahala | A quaint town that offers a glimpse into local life and access to stunning views of the surrounding areas. Great for those looking for a quieter stay. | Pahala Public Library, Local Shops, Hiking Opportunities, Nearby Botanical Gardens, Cultural Heritage Sites |
| Ocean View | A growing community with expansive ocean views and affordable accommodations. Attracts longer-stay guests looking for peace and nature. | Scenic Drive, Community Markets, Nature Parks, Local Events, Outdoor Activities |
Understanding Airbnb License Requirements & STR Laws in Naalehu (2026)
Yes, Naalehu, Hawaii, United States enforces high STR regulations. Obtaining a license and ensuring compliance is almost certainly required according to current 2026 STR laws. Always verify the latest short term rental regulations and Airbnb license requirements directly with local government authorities for Naalehu to ensure full compliance before hosting.
(Source: AirROI data, 2026, based on 51% licensed listings)
Top Performing Airbnb Properties in Naalehu (2026)
Benchmark your potential! Explore examples of top-performing Airbnb properties in Naalehubased on Trailing Twelve Month (TTM) revenue. Analyze their characteristics, revenue, occupancy rate, and ADR to understand what drives success in this market.

Peaceful Retreat
Entire Place • 3 bedrooms
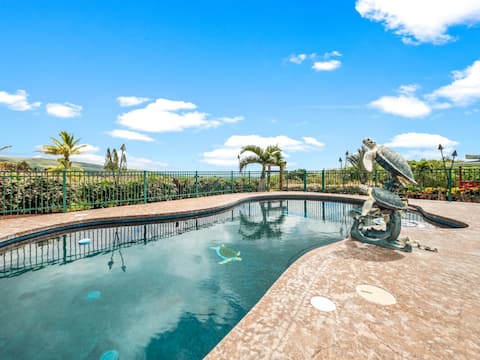
Pool, Japanese Pagoda & Gardens, Gorgeous Ocean Vi
Entire Place • 3 bedrooms

Home w/ Ocean View near Discovery Harbour Golf
Entire Place • 1 bedroom

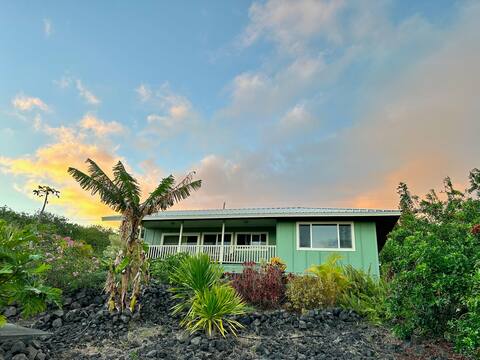
'The Aloha Green House' Retreat w/ Ocean Views!
Entire Place • 2 bedrooms
Peaceful Big Island Homebase with Coastline Views
Entire Place • 2 bedrooms

Tranquil Retreat – Sweeping Ocean View Studio
Entire Place • N/A
Note: Performance varies based on location, size, amenities, seasonality, and management quality. Data reflects the past 12 months.
Top Performing Airbnb Hosts in Naalehu (2026)
Learn from the best! This table showcases top-performing Airbnb hosts in Naalehu based on the number of properties managed and estimated total revenue over the past year. Analyze their scale and performance metrics.
| Host Name | Properties | Grossing Revenue | Stay Reviews | Avg Rating |
|---|---|---|---|---|
| Julie | 6 | $174,577 | 213 | 4.73/5.0 |
| Catherine | 1 | $81,041 | 92 | 4.92/5.0 |
| Deanne | 7 | $79,047 | 1422 | 4.82/5.0 |
| Lou And Kami | 2 | $73,680 | 342 | 4.98/5.0 |
| Paul | 2 | $69,390 | 559 | 4.93/5.0 |
| Andrea | 1 | $58,370 | 56 | 4.96/5.0 |
| Evolve | 1 | $58,180 | 88 | 4.97/5.0 |
| Ka'Haiya | 2 | $55,987 | 495 | 4.95/5.0 |
| Linda | 2 | $54,188 | 469 | 4.80/5.0 |
| Josh | 1 | $49,554 | 39 | 5.00/5.0 |
Analyzing the strategies of top hosts, such as their property selection, pricing, and guest communication, can offer valuable lessons for optimizing your own Airbnb operations in Naalehu.
Dive Deeper: Advanced Naalehu STR Market Data (2026)
Ready to unlock more insights? AirROI provides access to advanced metrics and comprehensive Airbnb data for Naalehu. Explore detailed analytics beyond this report to refine your investment strategy, optimize pricing, and maximize your vacation rental profits.
Explore Advanced MetricsNaalehu Short-Term Rental Market Composition (2026): Property & Room Types
Room Type Distribution
Property Type Distribution
Market Composition Insights for Naalehu
- The Naalehu Airbnb market composition is heavily skewed towards Entire Home/Apt listings, which make up 85.1% of the 47 active rentals. This indicates strong guest preference for privacy and space.
- Looking at the property type distribution in Naalehu, House properties are the most common (44.7%), reflecting the local real estate landscape.
- Houses represent a significant 44.7% portion, catering likely to families or larger groups.
- The presence of 14.9% Hotel/Boutique listings indicates integration with traditional hospitality.
Naalehu Airbnb Room Capacity Analysis (2026): Bedroom Distribution
Distribution of Listings by Number of Bedrooms
Room Capacity Insights for Naalehu
- The dominant room capacity in Naalehu is 1 bedroom listings, making up 42.6% of the market. This suggests a strong demand for properties suitable for couples or solo travelers.
- Together, 1 bedroom and 2 bedrooms properties represent 63.9% of the active Airbnb listings in Naalehu, indicating a high concentration in these sizes.
Naalehu Vacation Rental Guest Capacity Trends (2026)
Distribution of Listings by Guest Capacity
Guest Capacity Insights for Naalehu
- The most common guest capacity trend in Naalehu vacation rentals is listings accommodating 2 guests (27.7%). This suggests the primary traveler segment is likely couples or solo travelers.
- Properties designed for 2 guests and 4 guests dominate the Naalehu STR market, accounting for 55.4% of listings.
- 23.4% of properties accommodate 6+ guests, serving the market segment for larger families or group travel in Naalehu.
- On average, properties in Naalehu are equipped to host 3.7 guests.
Naalehu Airbnb Booking Patterns (2026): Available vs. Booked Days
Available Days Distribution
Booked Days Distribution
Booking Pattern Insights for Naalehu
- The most common availability pattern in Naalehu falls within the 91-180 days range, representing 36.2% of listings. This suggests many properties have significant open periods on their calendars.
- Approximately 59.6% of listings show high availability (181+ days open annually), indicating potential for increased bookings or specific owner usage patterns.
- For booked days, the 181-270 days range is most frequent in Naalehu (36.2%), reflecting common guest stay durations or potential owner blocking patterns.
- A notable 40.5% of properties secure long booking periods (181+ days booked per year), highlighting successful long-term rental strategies or significant owner usage.
Naalehu Airbnb Minimum Stay Requirements Analysis
Distribution of Listings by Minimum Night Requirement
1 Night
19 listings
40.4% of total
2 Nights
11 listings
23.4% of total
3 Nights
6 listings
12.8% of total
4-6 Nights
3 listings
6.4% of total
7-29 Nights
1 listings
2.1% of total
30+ Nights
7 listings
14.9% of total
Key Insights
- The most prevalent minimum stay requirement in Naalehu is 1 Night, adopted by 40.4% of listings. This highlights the market's preference for shorter, flexible bookings.
- A strong majority (63.8%) of the Naalehu Airbnb data shows acceptance of very short stays (1-2 nights), indicating a dynamic, high-turnover market.
- A significant segment (14.9%) caters to monthly stays (30+ nights) in Naalehu, pointing to opportunities in the extended-stay market.
Recommendations
- Align with the market by considering a 1 Night minimum stay, as 40.4% of Naalehu hosts use this setting.
- Explore offering discounts for stays of 30+ nights to attract the 14.9% of the market seeking extended stays.
- Adjust minimum nights based on seasonality – potentially shorter during low season and longer during peak demand periods in Naalehu.
Naalehu Airbnb Cancellation Policy Trends Analysis (2026)
Super Strict 30 Days
6 listings
12.8% of total
Flexible
4 listings
8.5% of total
Moderate
14 listings
29.8% of total
Firm
17 listings
36.2% of total
Strict
6 listings
12.8% of total
Cancellation Policy Insights for Naalehu
- The prevailing Airbnb cancellation policy trend in Naalehu is Firm, used by 36.2% of listings.
- There's a relatively balanced mix between guest-friendly (38.3%) and stricter (49.0%) policies, offering choices for different guest needs.
Recommendations for Hosts
- Consider adopting a Firm policy to align with the 36.2% market standard in Naalehu.
- Using a Strict policy might deter some guests, as only 12.8% of listings use it. Evaluate if potential revenue protection outweighs possible lower booking rates.
- Regularly review your cancellation policy against competitors and market demand shifts in Naalehu.
Naalehu STR Booking Lead Time Analysis (2026)
Average Booking Lead Time by Month
Booking Lead Time Insights for Naalehu
- The overall average booking lead time for vacation rentals in Naalehu is 57 days.
- Guests book furthest in advance for stays during February (average 67 days), likely coinciding with peak travel demand or local events.
- The shortest booking windows occur for stays in March (average 48 days), indicating more last-minute travel plans during this time.
- Seasonally, Winter (65 days avg.) sees the longest lead times, while Spring (55 days avg.) has the shortest, reflecting typical travel planning cycles.
Recommendations for Hosts
- Use the overall average lead time (57 days) as a baseline for your pricing and availability strategy in Naalehu.
- Target marketing efforts for the Winter season well in advance (at least 65 days) to capture early planners.
- Monitor your own booking lead times against these Naalehu averages to identify opportunities for dynamic pricing adjustments.
Popular & Essential Airbnb Amenities in Naalehu (2026)
Amenity Prevalence
Amenity Insights for Naalehu
- Essential amenities in Naalehu that guests expect include: Free parking on premises, Hot water, Dishes and silverware. Lacking these (any) could significantly impact bookings.
- Popular amenities like Refrigerator, Cooking basics, Kitchen are common but not universal. Offering these can provide a competitive edge.
- Warning: Wifi is not universally provided but is considered essential globally. Ensure reliable Wifi is offered.
Recommendations for Hosts
- Ensure your listing includes all essential amenities for Naalehu: Free parking on premises, Hot water, Dishes and silverware.
- Prioritize adding missing essentials: Hot water, Dishes and silverware.
- Consider adding popular differentiators like Refrigerator or Cooking basics to increase appeal.
- Highlight unique or less common amenities you offer (e.g., hot tub, dedicated workspace, EV charger) in your listing description and photos.
- Regularly check competitor amenities in Naalehu to stay competitive.
Naalehu Airbnb Guest Demographics & Profile Analysis (2026)
Guest Profile Summary for Naalehu
- The typical guest profile for Airbnb in Naalehu consists of primarily domestic travelers (84%), often arriving from nearby Seattle, typically belonging to the Post-2000s (Gen Z/Alpha) group (50%), primarily speaking English or Spanish.
- Domestic travelers account for 84.2% of guests.
- Key international markets include United States (84.2%) and Canada (4.2%).
- Top languages spoken are English (60.1%) followed by Spanish (8.8%).
- A significant demographic segment is the Post-2000s (Gen Z/Alpha) group, representing 50% of guests.
Recommendations for Hosts
- Target domestic marketing efforts towards travelers from Seattle and Los Angeles.
- Tailor amenities and listing descriptions to appeal to the dominant Post-2000s (Gen Z/Alpha) demographic (e.g., highlight fast WiFi, smart home features, local guides).
- Highlight unique local experiences or amenities relevant to the primary guest profile.
- Consider seasonal promotions aligned with peak travel times for key origin markets.
Nearby Short-Term Rental Market Comparison
How does the Naalehu Airbnb market stack up against its neighbors? Compare key performance metrics like average monthly revenue, ADR, and occupancy rates in surrounding areas to understand the broader regional STR landscape.
| Market | Active Properties | Monthly Revenue | Daily Rate | Avg. Occupancy |
|---|---|---|---|---|
| Kula | 11 | $9,130 | $383.13 | 79% |
| Waimea | 416 | $8,098 | $819.38 | 43% |
| Puakō | 62 | $7,820 | $874.88 | 44% |
| Hana | 68 | $7,791 | $413.38 | 65% |
| Makawao | 19 | $7,315 | $437.12 | 67% |
| Kapalua | 297 | $7,140 | $741.15 | 42% |
| Honalo | 24 | $7,044 | $410.83 | 56% |
| Paia | 88 | $6,942 | $546.66 | 49% |
| Wailea-Makena | 11 | $6,581 | $787.33 | 46% |
| Waikoloa Beach Resort | 27 | $6,060 | $544.82 | 46% |