Mountain View Airbnb Market Analysis 2026: Short Term Rental Data & Vacation Rental Statistics in Hawaii, United States
Is Airbnb profitable in Mountain View in 2026? Explore comprehensive Airbnb analytics for Mountain View, Hawaii, United States to uncover income potential. This 2026 STR market report for Mountain View, based on AirROI data from February 2025 to January 2026, reveals key trends in the niche market of 50 active listings.
Whether you're considering an Airbnb investment in Mountain View, optimizing your existing vacation rental, or exploring rental arbitrage opportunities, understanding the Mountain View Airbnb data is crucial. Understanding the local regulations is key to maximizing your short term rental income potential. Let's dive into the specifics.
Key Mountain View Airbnb Performance Metrics Overview
Monthly Airbnb Revenue Variations & Income Potential in Mountain View (2026)
Understanding the monthly revenue variations for Airbnb listings in Mountain View is key to maximizing your short term rental income potential. Seasonality significantly impacts earnings. Our analysis, based on data from the past 12 months, shows that the peak revenue month for STRs in Mountain View is typically January, while September often presents the lowest earnings, highlighting opportunities for strategic pricing adjustments during shoulder and low seasons. Explore the typical Airbnb income in Mountain View across different performance tiers:
- Best-in-class properties (Top 10%) achieve $4,768+ monthly, often utilizing dynamic pricing and superior guest experiences.
- Strong performing properties (Top 25%) earn $3,595 or more, indicating effective management and desirable locations/amenities.
- Typical properties (Median) generate around $2,323 per month, representing the average market performance.
- Entry-level properties (Bottom 25%) see earnings around $1,374, often with potential for optimization.
Average Monthly Airbnb Earnings Trend in Mountain View
Mountain View Airbnb Occupancy Rate Trends (2026)
Maximize your bookings by understanding the Mountain View STR occupancy trends. Seasonal demand shifts significantly influence how often properties are booked. Typically, Februarysees the highest demand (peak season occupancy), while September experiences the lowest (low season). Effective strategies, like adjusting minimum stays or offering promotions, can boost occupancy during slower periods. Here's how different property tiers perform in Mountain View:
- Best-in-class properties (Top 10%) achieve 89%+ occupancy, indicating high desirability and potentially optimized availability.
- Strong performing properties (Top 25%) maintain 74% or higher occupancy, suggesting good market fit and guest satisfaction.
- Typical properties (Median) have an occupancy rate around 53%.
- Entry-level properties (Bottom 25%) average 31% occupancy, potentially facing higher vacancy.
Average Monthly Occupancy Rate Trend in Mountain View
Average Daily Rate (ADR) Airbnb Trends in Mountain View (2026)
Effective short term rental pricing strategy in Mountain View involves understanding monthly ADR fluctuations. The Average Daily Rate (ADR) for Airbnb in Mountain View typically peaks in December and dips lowest during April. Leveraging Airbnb dynamic pricing tools or strategies based on this seasonality can significantly boost revenue. Here's a look at the typical nightly rates achieved:
- Best-in-class properties (Top 10%) command rates of $274+ per night, often due to premium features or locations.
- Strong performing properties (Top 25%) achieve nightly rates of $188 or more.
- Typical properties (Median) charge around $139 per night.
- Entry-level properties (Bottom 25%) earn around $100 per night.
Average Daily Rate (ADR) Trend by Month in Mountain View
Get Live Mountain View Market Intelligence 👇

Explore Real-time Analytics
Airbnb Seasonality Analysis & Trends in Mountain View (2026)
Peak Season (January, December, July)
- Revenue averages $3,074 per month
- Occupancy rates average 53.4%
- Daily rates average $177
Shoulder Season
- Revenue averages $2,643 per month
- Occupancy maintains around 55.2%
- Daily rates hold near $170
Low Season (June, September, November)
- Revenue drops to average $2,332 per month
- Occupancy decreases to average 47.5%
- Daily rates adjust to average $174
Seasonality Insights for Mountain View
- The Airbnb seasonality in Mountain View shows moderate seasonality with distinct peak and low periods. While the sections above show seasonal averages, it's also insightful to look at the extremes:
- During the high season, the absolute peak month showcases Mountain View's highest earning potential, with monthly revenues capable of climbing to $3,202, occupancy reaching a high of 64.0%, and ADRs peaking at $182.
- Conversely, the slowest single month of the year, typically falling within the low season, marks the market's lowest point. In this month, revenue might dip to $2,112, occupancy could drop to 41.3%, and ADRs may adjust down to $165.
- Understanding both the seasonal averages and these monthly peaks and troughs in revenue, occupancy, and ADR is crucial for maximizing your Airbnb profit potential in Mountain View.
Seasonal Strategies for Maximizing Profit
- Peak Season: Maximize revenue through premium pricing and potentially longer minimum stays. Ensure high availability.
- Low Season: Offer competitive pricing, special promotions (e.g., extended stay discounts), and flexible cancellation policies. Target off-season travelers like remote workers or budget-conscious guests.
- Shoulder Seasons: Implement dynamic pricing that balances peak and low rates. Target weekend travelers or specific events. Offer slightly more flexible terms than peak season.
- Regularly analyze your own performance against these Mountain View seasonality benchmarks and adjust your pricing and availability strategy accordingly.
Best Areas for Airbnb Investment in Mountain View (2026)
Exploring the top neighborhoods for short-term rentals in Mountain View? This section highlights key areas, outlining why they are attractive for hosts and guests, along with notable local attractions. Consider these locations based on your target guest profile and investment strategy.
| Neighborhood / Area | Why Host Here? (Target Guests & Appeal) | Key Attractions & Landmarks |
|---|---|---|
| Kailua-Kona | Kailua-Kona is a popular tourist destination known for its beautiful beaches, water activities, and vibrant local culture. It offers stunning ocean views and is ideal for vacation rentals due to its proximity to attractions. | Kona Coffee Living History Farm, Kona Brewing Company, Ali'i Drive, Kona Coast, Hulihee Palace |
| Hilo | Hilo is the largest town on the Big Island and provides access to lush tropical scenery and waterfalls. It's a great location for travelers interested in exploring Hawaii's natural beauty and rich history. | Hawaii Volcanoes National Park, Akaka Falls State Park, Liliuokalani Gardens, Hilo Farmers Market, Pacific Tsunami Museum |
| Waikoloa | Waikoloa is a master-planned resort community that offers beautiful beaches, golf courses, and luxury amenities. It's popular among families and travelers looking for a relaxing getaway in a resort setting. | Anaeho'omalu Bay, Waikoloa Beach Resort, Kings' Shops, Mauna Lani Bay, Hapuna Beach State Park |
| Pahoa | Pahoa is known for its unique and laid-back atmosphere, with a strong local culture and nearby volcanic activity. It appeals to adventurous travelers looking for an off-the-beaten-path experience. | Kaimu Black Sand Beach, Lava Tree State Monument, Pahoa Village, Hot Pond, Ahalanui Park |
| Kauai | Although technically an island separate from the Big Island, Kauai is often included in discussions about Hawaii. It features stunning natural landscapes and is perfect for outdoor enthusiasts, making it a prime area for Airbnb hosting. | Waimea Canyon, Na Pali Coast, Hanalei Bay, Kauai's North Shore, Wailua Falls |
| Mauna Kea | Mauna Kea offers some of the best stargazing opportunities in the world. It attracts visitors interested in astronomy and unique natural experiences which makes it a niche market for Airbnb hosting. | Mauna Kea Observatories, Mauna Kea State Recreation Area, The summit of Mauna Kea, Kona Coffee, Stargazing tours |
| Hamakua Coast | The Hamakua Coast is known for its breathtaking views and lush landscapes along the northern coast of Hawaii. It's appealing for travelers looking to experience Hawaii's untouched beauty. | Akaka Falls, Honomu, Hamakuapoko Falls, Onomea Bay, Hawaii Tropical Botanical Garden |
| South Point | South Point is known as the southernmost point in the United States, featuring dramatic cliffs and scenic views. It is an area for travelers seeking adventure and unique photo opportunities. | Green Sand Beach, Ka Lae, South Point Lighthouse, Cliff diving spots, Fisherman's Beach |
Understanding Airbnb License Requirements & STR Laws in Mountain View (2026)
With 22% of listings showing registration in 2026, understanding potential Airbnb license requirements is crucial in Mountain View. Always verify the latest short term rental regulations and Airbnb license requirements directly with local government authorities for Mountain View to ensure full compliance before hosting.
(Source: AirROI data, 2026, based on 22% licensed listings)
Top Performing Airbnb Properties in Mountain View (2026)
Benchmark your potential! Explore examples of top-performing Airbnb properties in Mountain Viewbased on Trailing Twelve Month (TTM) revenue. Analyze their characteristics, revenue, occupancy rate, and ADR to understand what drives success in this market.

Hawaii Pickleball Vacation Rental 2 Covered Courts
Entire Place • 7 bedrooms
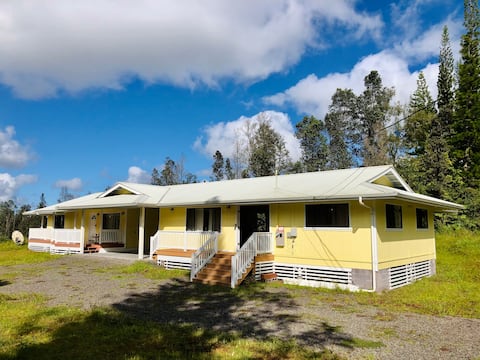
Hawaiian Plantation Style Home. Visit Volcano!
Entire Place • 4 bedrooms

Entire Home A/C /Dishwasher/ Bidet/AlohaHaleNohea
Entire Place • 3 bedrooms
Hale 'Ola'a - Majestic Mountain Retreat - 3 Beds
Entire Place • 2 bedrooms
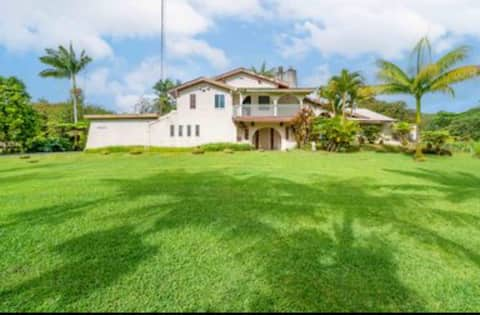
Aloha! Large home in Mt View HI 3 BR 2.5 bath
Entire Place • 3 bedrooms

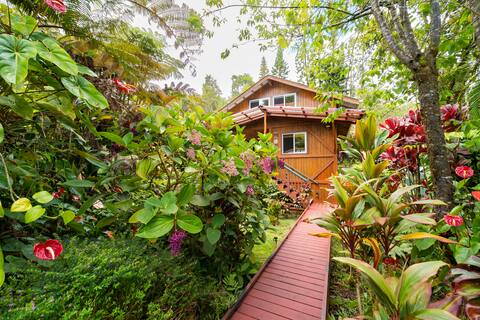
Best Treehouse Ever
Entire Place • 1 bedroom
Note: Performance varies based on location, size, amenities, seasonality, and management quality. Data reflects the past 12 months.
Top Performing Airbnb Hosts in Mountain View (2026)
Learn from the best! This table showcases top-performing Airbnb hosts in Mountain View based on the number of properties managed and estimated total revenue over the past year. Analyze their scale and performance metrics.
| Host Name | Properties | Grossing Revenue | Stay Reviews | Avg Rating |
|---|---|---|---|---|
| Nataliia | 3 | $121,616 | 186 | 4.96/5.0 |
| Simon & Jeri | 2 | $110,501 | 473 | 4.97/5.0 |
| Emily | 2 | $95,648 | 1139 | 4.91/5.0 |
| Cassandra | 2 | $94,923 | 217 | 4.99/5.0 |
| Lorretta | 1 | $64,529 | 6 | 5.00/5.0 |
| Ryan | 1 | $57,686 | 173 | 4.94/5.0 |
| Chai | 1 | $56,347 | 35 | 4.54/5.0 |
| Bill | 2 | $55,334 | 72 | 5.00/5.0 |
| Zalyn | 2 | $49,091 | 111 | 4.92/5.0 |
| Britt And Michael | 1 | $43,297 | 853 | 4.90/5.0 |
Analyzing the strategies of top hosts, such as their property selection, pricing, and guest communication, can offer valuable lessons for optimizing your own Airbnb operations in Mountain View.
Dive Deeper: Advanced Mountain View STR Market Data (2026)
Ready to unlock more insights? AirROI provides access to advanced metrics and comprehensive Airbnb data for Mountain View. Explore detailed analytics beyond this report to refine your investment strategy, optimize pricing, and maximize your vacation rental profits.
Explore Advanced MetricsMountain View Short-Term Rental Market Composition (2026): Property & Room Types
Room Type Distribution
Property Type Distribution
Market Composition Insights for Mountain View
- The Mountain View Airbnb market composition is heavily skewed towards Entire Home/Apt listings, which make up 96% of the 50 active rentals. This indicates strong guest preference for privacy and space.
- Looking at the property type distribution in Mountain View, House properties are the most common (56%), reflecting the local real estate landscape.
- Houses represent a significant 56% portion, catering likely to families or larger groups.
- The presence of 10% Hotel/Boutique listings indicates integration with traditional hospitality.
- Smaller segments like apartment/condo (combined 2.0%) offer potential for unique stay experiences.
Mountain View Airbnb Room Capacity Analysis (2026): Bedroom Distribution
Distribution of Listings by Number of Bedrooms
Room Capacity Insights for Mountain View
- The dominant room capacity in Mountain View is 1 bedroom listings, making up 58% of the market. This suggests a strong demand for properties suitable for couples or solo travelers.
- Together, 1 bedroom and 2 bedrooms properties represent 76.0% of the active Airbnb listings in Mountain View, indicating a high concentration in these sizes.
- With over half the market (58%) consisting of studios or 1-bedroom units, Mountain View is particularly well-suited for individuals or couples.
Mountain View Vacation Rental Guest Capacity Trends (2026)
Distribution of Listings by Guest Capacity
Guest Capacity Insights for Mountain View
- The most common guest capacity trend in Mountain View vacation rentals is listings accommodating 2 guests (32%). This suggests the primary traveler segment is likely couples or solo travelers.
- Properties designed for 2 guests and 4 guests dominate the Mountain View STR market, accounting for 58.0% of listings.
- 28.0% of properties accommodate 6+ guests, serving the market segment for larger families or group travel in Mountain View.
- On average, properties in Mountain View are equipped to host 4.0 guests.
Mountain View Airbnb Booking Patterns (2026): Available vs. Booked Days
Available Days Distribution
Booked Days Distribution
Booking Pattern Insights for Mountain View
- The most common availability pattern in Mountain View falls within the 271-366 days range, representing 34% of listings. This suggests many properties have significant open periods on their calendars.
- Approximately 64.0% of listings show high availability (181+ days open annually), indicating potential for increased bookings or specific owner usage patterns.
- For booked days, the 91-180 days range is most frequent in Mountain View (32%), reflecting common guest stay durations or potential owner blocking patterns.
- A notable 36.0% of properties secure long booking periods (181+ days booked per year), highlighting successful long-term rental strategies or significant owner usage.
Mountain View Airbnb Minimum Stay Requirements Analysis
Distribution of Listings by Minimum Night Requirement
1 Night
25 listings
50% of total
2 Nights
7 listings
14% of total
3 Nights
4 listings
8% of total
7-29 Nights
1 listings
2% of total
30+ Nights
13 listings
26% of total
Key Insights
- The most prevalent minimum stay requirement in Mountain View is 1 Night, adopted by 50% of listings. This highlights the market's preference for shorter, flexible bookings.
- A strong majority (64.0%) of the Mountain View Airbnb data shows acceptance of very short stays (1-2 nights), indicating a dynamic, high-turnover market.
- A significant segment (26%) caters to monthly stays (30+ nights) in Mountain View, pointing to opportunities in the extended-stay market.
Recommendations
- Align with the market by considering a 1 Night minimum stay, as 50% of Mountain View hosts use this setting.
- Explore offering discounts for stays of 30+ nights to attract the 26% of the market seeking extended stays.
- Adjust minimum nights based on seasonality – potentially shorter during low season and longer during peak demand periods in Mountain View.
Mountain View Airbnb Cancellation Policy Trends Analysis (2026)
Limited
1 listings
2% of total
Flexible
7 listings
14% of total
Moderate
14 listings
28% of total
Firm
19 listings
38% of total
Strict
9 listings
18% of total
Cancellation Policy Insights for Mountain View
- The prevailing Airbnb cancellation policy trend in Mountain View is Firm, used by 38% of listings.
- A majority (56.0%) of hosts in Mountain View utilize Firm or Strict policies, indicating a market where hosts prioritize booking security.
Recommendations for Hosts
- Consider adopting a Firm policy to align with the 38% market standard in Mountain View.
- Regularly review your cancellation policy against competitors and market demand shifts in Mountain View.
Mountain View STR Booking Lead Time Analysis (2026)
Average Booking Lead Time by Month
Booking Lead Time Insights for Mountain View
- The overall average booking lead time for vacation rentals in Mountain View is 53 days.
- Guests book furthest in advance for stays during April (average 91 days), likely coinciding with peak travel demand or local events.
- The shortest booking windows occur for stays in May (average 49 days), indicating more last-minute travel plans during this time.
- Seasonally, Spring (66 days avg.) sees the longest lead times, while Summer (54 days avg.) has the shortest, reflecting typical travel planning cycles.
Recommendations for Hosts
- Use the overall average lead time (53 days) as a baseline for your pricing and availability strategy in Mountain View.
- For April stays, consider implementing length-of-stay discounts or slightly higher rates for bookings made less than 91 days out to capitalize on advance planning.
- Target marketing efforts for the Spring season well in advance (at least 66 days) to capture early planners.
- Monitor your own booking lead times against these Mountain View averages to identify opportunities for dynamic pricing adjustments.
Popular & Essential Airbnb Amenities in Mountain View (2026)
Amenity Prevalence
Amenity Insights for Mountain View
- Essential amenities in Mountain View that guests expect include: Free parking on premises. Lacking these (this) could significantly impact bookings.
- Popular amenities like Dishes and silverware, Smoke alarm, Wifi are common but not universal. Offering these can provide a competitive edge.
- Warning: Wifi is not universally provided but is considered essential globally. Ensure reliable Wifi is offered.
Recommendations for Hosts
- Ensure your listing includes all essential amenities for Mountain View: Free parking on premises.
- Prioritize adding missing essentials: Free parking on premises.
- Consider adding popular differentiators like Dishes and silverware or Smoke alarm to increase appeal.
- Highlight unique or less common amenities you offer (e.g., hot tub, dedicated workspace, EV charger) in your listing description and photos.
- Regularly check competitor amenities in Mountain View to stay competitive.
Mountain View Airbnb Guest Demographics & Profile Analysis (2026)
Guest Profile Summary for Mountain View
- The typical guest profile for Airbnb in Mountain View consists of primarily domestic travelers (86%), often arriving from nearby Honolulu, typically belonging to the Post-2000s (Gen Z/Alpha) group (50%), primarily speaking English or Spanish.
- Domestic travelers account for 86.4% of guests.
- Key international markets include United States (86.4%) and Canada (4.1%).
- Top languages spoken are English (61.8%) followed by Spanish (8%).
- A significant demographic segment is the Post-2000s (Gen Z/Alpha) group, representing 50% of guests.
Recommendations for Hosts
- Target domestic marketing efforts towards travelers from Honolulu and New York.
- Tailor amenities and listing descriptions to appeal to the dominant Post-2000s (Gen Z/Alpha) demographic (e.g., highlight fast WiFi, smart home features, local guides).
- Highlight unique local experiences or amenities relevant to the primary guest profile.
- Consider seasonal promotions aligned with peak travel times for key origin markets.
Nearby Short-Term Rental Market Comparison
How does the Mountain View Airbnb market stack up against its neighbors? Compare key performance metrics like average monthly revenue, ADR, and occupancy rates in surrounding areas to understand the broader regional STR landscape.
| Market | Active Properties | Monthly Revenue | Daily Rate | Avg. Occupancy |
|---|---|---|---|---|
| Kula | 11 | $9,130 | $383.13 | 79% |
| Waimea | 416 | $8,098 | $819.38 | 43% |
| Puakō | 62 | $7,820 | $874.88 | 44% |
| Hana | 68 | $7,791 | $413.38 | 65% |
| Makawao | 19 | $7,315 | $437.12 | 67% |
| Kapalua | 297 | $7,140 | $741.15 | 42% |
| Honalo | 24 | $7,044 | $410.83 | 56% |
| Paia | 88 | $6,942 | $546.66 | 49% |
| Wailea-Makena | 11 | $6,581 | $787.33 | 46% |
| Waikoloa Beach Resort | 27 | $6,060 | $544.82 | 46% |