Laie Airbnb Market Analysis 2026: Short Term Rental Data & Vacation Rental Statistics in Hawaii, United States
Is Airbnb profitable in Laie in 2026? Explore comprehensive Airbnb analytics for Laie, Hawaii, United States to uncover income potential. This 2026 STR market report for Laie, based on AirROI data from February 2025 to January 2026, reveals key trends in the niche market of 56 active listings.
Whether you're considering an Airbnb investment in Laie, optimizing your existing vacation rental, or exploring rental arbitrage opportunities, understanding the Laie Airbnb data is crucial. Navigating the high regulation landscape is key to maximizing your short term rental income potential. Let's dive into the specifics.
Key Laie Airbnb Performance Metrics Overview
Monthly Airbnb Revenue Variations & Income Potential in Laie (2026)
Understanding the monthly revenue variations for Airbnb listings in Laie is key to maximizing your short term rental income potential. Seasonality significantly impacts earnings. Our analysis, based on data from the past 12 months, shows that the peak revenue month for STRs in Laie is typically July, while December often presents the lowest earnings, highlighting opportunities for strategic pricing adjustments during shoulder and low seasons. Explore the typical Airbnb income in Laie across different performance tiers:
- Best-in-class properties (Top 10%) achieve $17,970+ monthly, often utilizing dynamic pricing and superior guest experiences.
- Strong performing properties (Top 25%) earn $8,654 or more, indicating effective management and desirable locations/amenities.
- Typical properties (Median) generate around $3,798 per month, representing the average market performance.
- Entry-level properties (Bottom 25%) see earnings around $1,935, often with potential for optimization.
Average Monthly Airbnb Earnings Trend in Laie
Laie Airbnb Occupancy Rate Trends (2026)
Maximize your bookings by understanding the Laie STR occupancy trends. Seasonal demand shifts significantly influence how often properties are booked. Typically, Aprilsees the highest demand (peak season occupancy), while September experiences the lowest (low season). Effective strategies, like adjusting minimum stays or offering promotions, can boost occupancy during slower periods. Here's how different property tiers perform in Laie:
- Best-in-class properties (Top 10%) achieve 87%+ occupancy, indicating high desirability and potentially optimized availability.
- Strong performing properties (Top 25%) maintain 72% or higher occupancy, suggesting good market fit and guest satisfaction.
- Typical properties (Median) have an occupancy rate around 38%.
- Entry-level properties (Bottom 25%) average 19% occupancy, potentially facing higher vacancy.
Average Monthly Occupancy Rate Trend in Laie
Average Daily Rate (ADR) Airbnb Trends in Laie (2026)
Effective short term rental pricing strategy in Laie involves understanding monthly ADR fluctuations. The Average Daily Rate (ADR) for Airbnb in Laie typically peaks in December and dips lowest during August. Leveraging Airbnb dynamic pricing tools or strategies based on this seasonality can significantly boost revenue. Here's a look at the typical nightly rates achieved:
- Best-in-class properties (Top 10%) command rates of $1,496+ per night, often due to premium features or locations.
- Strong performing properties (Top 25%) achieve nightly rates of $763 or more.
- Typical properties (Median) charge around $435 per night.
- Entry-level properties (Bottom 25%) earn around $176 per night.
Average Daily Rate (ADR) Trend by Month in Laie
Get Live Laie Market Intelligence 👇

Explore Real-time Analytics
Airbnb Seasonality Analysis & Trends in Laie (2026)
Peak Season (July, March, February)
- Revenue averages $10,936 per month
- Occupancy rates average 52.7%
- Daily rates average $700
Shoulder Season
- Revenue averages $7,993 per month
- Occupancy maintains around 42.6%
- Daily rates hold near $691
Low Season (January, May, December)
- Revenue drops to average $6,110 per month
- Occupancy decreases to average 41.6%
- Daily rates adjust to average $700
Seasonality Insights for Laie
- The Airbnb seasonality in Laie shows moderate seasonality with distinct peak and low periods. While the sections above show seasonal averages, it's also insightful to look at the extremes:
- During the high season, the absolute peak month showcases Laie's highest earning potential, with monthly revenues capable of climbing to $11,140, occupancy reaching a high of 57.7%, and ADRs peaking at $717.
- Conversely, the slowest single month of the year, typically falling within the low season, marks the market's lowest point. In this month, revenue might dip to $5,518, occupancy could drop to 35.4%, and ADRs may adjust down to $674.
- Understanding both the seasonal averages and these monthly peaks and troughs in revenue, occupancy, and ADR is crucial for maximizing your Airbnb profit potential in Laie.
Seasonal Strategies for Maximizing Profit
- Peak Season: Maximize revenue through premium pricing and potentially longer minimum stays. Ensure high availability.
- Low Season: Offer competitive pricing, special promotions (e.g., extended stay discounts), and flexible cancellation policies. Target off-season travelers like remote workers or budget-conscious guests.
- Shoulder Seasons: Implement dynamic pricing that balances peak and low rates. Target weekend travelers or specific events. Offer slightly more flexible terms than peak season.
- Regularly analyze your own performance against these Laie seasonality benchmarks and adjust your pricing and availability strategy accordingly.
Best Areas for Airbnb Investment in Laie (2026)
Exploring the top neighborhoods for short-term rentals in Laie? This section highlights key areas, outlining why they are attractive for hosts and guests, along with notable local attractions. Consider these locations based on your target guest profile and investment strategy.
| Neighborhood / Area | Why Host Here? (Target Guests & Appeal) | Key Attractions & Landmarks |
|---|---|---|
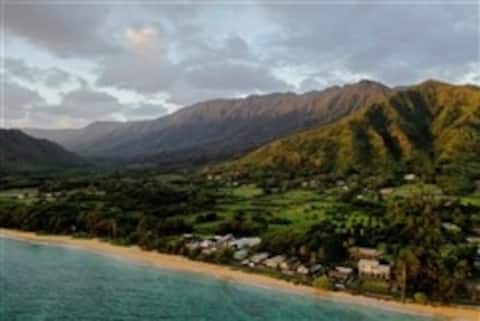
| Laie Point | A scenic point known for its stunning coastal views and vibrant marine life. Ideal for tourists seeking outdoor adventures and picturesque landscapes. | Laie Point State Wayside, Dole Plantation, Kawela Bay, Hukilau Beach, Laie Falls |
| Hukilau Beach | A beautiful, less-crowded beach that offers a more local experience. Great for families and those looking to relax by the ocean. | Hukilau Beach, Macadamia Nut Farm, Kahuku Point, Food trucks on Kamehameha Highway |
| Polynesian Cultural Center | A cultural theme park offering insights into Polynesian culture through presentations and activities. Attracts visitors interested in cultural enrichment. | Polynesian Cultural Center, Canoe Rides, Luau dining experience, Cultural shows |
| Laie Falls | A hiking destination that features beautiful waterfalls, perfect for adventure seekers and nature lovers. Offers both thrill and breathtaking views. | Laie Falls Trail, Panoramic views of the coast, Flora and fauna, Photography opportunities |
| Kawela Bay | A serene bay known for its calm waters and beautiful scenery, popular among snorkelers and beachgoers looking for tranquility. | Kawela Bay Beach, Snorkeling spots, Lush surroundings, Kayaking opportunities |
| BYUH Campus | The campus of Brigham Young University Hawaii attracts visitors for events and conferences. Great for educational and cultural tourism. | Church History sites, Beautiful campus views, Community events, Cultural festivals |
| Laie North Shore | Located near the famous North Shore, this area is ideal for surfing enthusiasts and those wanting to experience the laid-back beach lifestyle. | World famous surf spots, Sunset Beach, Waimea Bay, Shark's Cove |
| Kahuku | A nearby town offering access to local cuisine and agricultural experiences. A great place for food tourists and those interested in local farm tours. | Kahuku Farms, Food trucks, Agricultural tours, Cultural workshops |
Understanding Airbnb License Requirements & STR Laws in Laie (2026)
Yes, Laie, Hawaii, United States enforces high STR regulations. Obtaining a license and ensuring compliance is almost certainly required according to current 2026 STR laws. Always verify the latest short term rental regulations and Airbnb license requirements directly with local government authorities for Laie to ensure full compliance before hosting.
(Source: AirROI data, 2026, based on 70% licensed listings)
Top Performing Airbnb Properties in Laie (2026)
Benchmark your potential! Explore examples of top-performing Airbnb properties in Laiebased on Trailing Twelve Month (TTM) revenue. Analyze their characteristics, revenue, occupancy rate, and ADR to understand what drives success in this market.
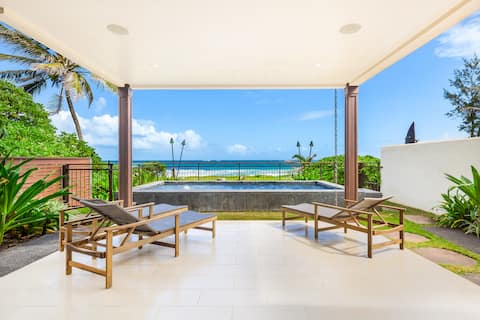
Hale Mahina Beach House
Entire Place • 3 bedrooms
Majestic Mahakea: Oceanfront Oasis by Gather
Entire Place • 4 bedrooms

Pacific Pearl, Beachfront, AC, Modern, Spacious
Entire Place • 3 bedrooms

Sea Cliff House - Oceanfront - 30 Day Stays
Entire Place • 3 bedrooms

Sea Cliff House 2 - Oceanfront Home - 30-day stays
Entire Place • 3 bedrooms

TMV 5: 8bdrm,/7ba at Tiki Moon Villas
Entire Place • 8 bedrooms
Note: Performance varies based on location, size, amenities, seasonality, and management quality. Data reflects the past 12 months.
Top Performing Airbnb Hosts in Laie (2026)
Learn from the best! This table showcases top-performing Airbnb hosts in Laie based on the number of properties managed and estimated total revenue over the past year. Analyze their scale and performance metrics.
| Host Name | Properties | Grossing Revenue | Stay Reviews | Avg Rating |
|---|---|---|---|---|
| R | 1 | $641,473 | 38 | 4.63/5.0 |
| Geoffrey | 4 | $530,332 | 1350 | 4.82/5.0 |
| Gather Vacations | 2 | $514,957 | 4 | 5.00/5.0 |
| Raymond And Azlina | 10 | $369,312 | 115 | 4.77/5.0 |
| Logan | 3 | $295,142 | 301 | 4.81/5.0 |
| Anna K. | 1 | $207,920 | 72 | 4.99/5.0 |
| North Shore Glamping | 3 | $128,013 | 192 | 4.66/5.0 |
| Michael | 1 | $109,334 | 37 | 4.81/5.0 |
| Emma | 1 | $104,234 | 21 | 4.95/5.0 |
| Scott | 1 | $101,726 | 23 | 4.57/5.0 |
Analyzing the strategies of top hosts, such as their property selection, pricing, and guest communication, can offer valuable lessons for optimizing your own Airbnb operations in Laie.
Dive Deeper: Advanced Laie STR Market Data (2026)
Ready to unlock more insights? AirROI provides access to advanced metrics and comprehensive Airbnb data for Laie. Explore detailed analytics beyond this report to refine your investment strategy, optimize pricing, and maximize your vacation rental profits.
Explore Advanced MetricsLaie Short-Term Rental Market Composition (2026): Property & Room Types
Room Type Distribution
Property Type Distribution
Market Composition Insights for Laie
- The Laie Airbnb market composition is heavily skewed towards Entire Home/Apt listings, which make up 94.6% of the 56 active rentals. This indicates strong guest preference for privacy and space.
- Looking at the property type distribution in Laie, House properties are the most common (62.5%), reflecting the local real estate landscape.
- Houses represent a significant 62.5% portion, catering likely to families or larger groups.
- Smaller segments like hotel/boutique (combined 3.6%) offer potential for unique stay experiences.
Laie Airbnb Room Capacity Analysis (2026): Bedroom Distribution
Distribution of Listings by Number of Bedrooms
Room Capacity Insights for Laie
- The dominant room capacity in Laie is 1 bedroom listings, making up 28.6% of the market. This suggests a strong demand for properties suitable for couples or solo travelers.
- Together, 1 bedroom and 2 bedrooms properties represent 50.0% of the active Airbnb listings in Laie, indicating a high concentration in these sizes.
- A significant 42.9% of listings offer 3+ bedrooms, catering to larger groups and families seeking more space in Laie.
Laie Vacation Rental Guest Capacity Trends (2026)
Distribution of Listings by Guest Capacity
Guest Capacity Insights for Laie
- The most common guest capacity trend in Laie vacation rentals is listings accommodating 8+ guests (37.5%). This suggests the primary traveler segment is likely larger groups.
- Properties designed for 8+ guests and 4 guests dominate the Laie STR market, accounting for 55.4% of listings.
- 46.4% of properties accommodate 6+ guests, serving the market segment for larger families or group travel in Laie.
- On average, properties in Laie are equipped to host 5.4 guests.
Laie Airbnb Booking Patterns (2026): Available vs. Booked Days
Available Days Distribution
Booked Days Distribution
Booking Pattern Insights for Laie
- The most common availability pattern in Laie falls within the 271-366 days range, representing 60.7% of listings. This suggests many properties have significant open periods on their calendars.
- Approximately 76.8% of listings show high availability (181+ days open annually), indicating potential for increased bookings or specific owner usage patterns.
- For booked days, the 31-90 days range is most frequent in Laie (41.1%), reflecting common guest stay durations or potential owner blocking patterns.
- A notable 23.2% of properties secure long booking periods (181+ days booked per year), highlighting successful long-term rental strategies or significant owner usage.
Laie Airbnb Minimum Stay Requirements Analysis
Distribution of Listings by Minimum Night Requirement
1 Night
7 listings
12.5% of total
4-6 Nights
2 listings
3.6% of total
7-29 Nights
19 listings
33.9% of total
30+ Nights
28 listings
50% of total
Key Insights
- The most prevalent minimum stay requirement in Laie is 30+ Nights, adopted by 50% of listings. This highlights the market's preference for longer commitments.
- Very short stays (1-2 nights) are less common (12.5%), suggesting hosts prefer slightly longer bookings to optimize turnover.
- A significant segment (50%) caters to monthly stays (30+ nights) in Laie, pointing to opportunities in the extended-stay market.
Recommendations
- Align with the market by considering a 30+ Nights minimum stay, as 50% of Laie hosts use this setting.
- If feasible, allowing 1-night stays, especially midweek or during low season, could capture last-minute bookings, as only 12.5% currently do.
- Explore offering discounts for stays of 30+ nights to attract the 50% of the market seeking extended stays.
- Adjust minimum nights based on seasonality – potentially shorter during low season and longer during peak demand periods in Laie.
Laie Airbnb Cancellation Policy Trends Analysis (2026)
Super Strict 60 Days
11 listings
19.6% of total
Super Strict 30 Days
3 listings
5.4% of total
Moderate
10 listings
17.9% of total
Firm
19 listings
33.9% of total
Strict
13 listings
23.2% of total
Cancellation Policy Insights for Laie
- The prevailing Airbnb cancellation policy trend in Laie is Firm, used by 33.9% of listings.
- A majority (57.1%) of hosts in Laie utilize Firm or Strict policies, indicating a market where hosts prioritize booking security.
Recommendations for Hosts
- Consider adopting a Firm policy to align with the 33.9% market standard in Laie.
- Regularly review your cancellation policy against competitors and market demand shifts in Laie.
Laie STR Booking Lead Time Analysis (2026)
Average Booking Lead Time by Month
Booking Lead Time Insights for Laie
- The overall average booking lead time for vacation rentals in Laie is 90 days.
- Guests book furthest in advance for stays during October (average 108 days), likely coinciding with peak travel demand or local events.
- The shortest booking windows occur for stays in June (average 73 days), indicating more last-minute travel plans during this time.
- Seasonally, Fall (95 days avg.) sees the longest lead times, while Spring (79 days avg.) has the shortest, reflecting typical travel planning cycles.
Recommendations for Hosts
- Use the overall average lead time (90 days) as a baseline for your pricing and availability strategy in Laie.
- For October stays, consider implementing length-of-stay discounts or slightly higher rates for bookings made less than 108 days out to capitalize on advance planning.
- Target marketing efforts for the Fall season well in advance (at least 95 days) to capture early planners.
- Monitor your own booking lead times against these Laie averages to identify opportunities for dynamic pricing adjustments.
Popular & Essential Airbnb Amenities in Laie (2026)
Amenity Prevalence
Amenity Insights for Laie
- Popular amenities like Free parking on premises, Bed linens, Wifi are common but not universal. Offering these can provide a competitive edge.
- Warning: Wifi is not universally provided but is considered essential globally. Ensure reliable Wifi is offered.
Recommendations for Hosts
- Consider adding popular differentiators like Free parking on premises or Bed linens to increase appeal.
- Highlight unique or less common amenities you offer (e.g., hot tub, dedicated workspace, EV charger) in your listing description and photos.
- Regularly check competitor amenities in Laie to stay competitive.
Laie Airbnb Guest Demographics & Profile Analysis (2026)
Guest Profile Summary for Laie
- The typical guest profile for Airbnb in Laie consists of primarily domestic travelers (81%), often arriving from nearby Los Angeles, typically belonging to the Post-2000s (Gen Z/Alpha) group (50%), primarily speaking English or Spanish.
- Domestic travelers account for 80.5% of guests.
- Key international markets include United States (80.5%) and Canada (6.6%).
- Top languages spoken are English (60.1%) followed by Spanish (13.5%).
- A significant demographic segment is the Post-2000s (Gen Z/Alpha) group, representing 50% of guests.
Recommendations for Hosts
- Target domestic marketing efforts towards travelers from Los Angeles and Honolulu.
- Tailor amenities and listing descriptions to appeal to the dominant Post-2000s (Gen Z/Alpha) demographic (e.g., highlight fast WiFi, smart home features, local guides).
- Highlight unique local experiences or amenities relevant to the primary guest profile.
- Consider seasonal promotions aligned with peak travel times for key origin markets.
Nearby Short-Term Rental Market Comparison
How does the Laie Airbnb market stack up against its neighbors? Compare key performance metrics like average monthly revenue, ADR, and occupancy rates in surrounding areas to understand the broader regional STR landscape.
| Market | Active Properties | Monthly Revenue | Daily Rate | Avg. Occupancy |
|---|---|---|---|---|
| Mākaha Valley | 96 | $13,116 | $669.71 | 70% |
| Kahuku | 287 | $11,358 | $679.39 | 64% |
| Kula | 11 | $9,130 | $383.13 | 79% |
| Makawao | 19 | $7,315 | $437.12 | 67% |
| Kapalua | 297 | $7,140 | $741.15 | 42% |
| Paia | 88 | $6,942 | $546.66 | 49% |
| Wailea-Makena | 11 | $6,581 | $787.33 | 46% |
| Kapolei | 520 | $6,393 | $688.27 | 44% |
| Kaanapali | 1,624 | $6,028 | $838.76 | 38% |
| Haiku | 51 | $5,900 | $448.08 | 49% |