Kapaa Airbnb Market Analysis 2026: Short Term Rental Data & Vacation Rental Statistics in Hawaii, United States
Is Airbnb profitable in Kapaa in 2026? Explore comprehensive Airbnb analytics for Kapaa, Hawaii, United States to uncover income potential. This 2026 STR market report for Kapaa, based on AirROI data from February 2025 to January 2026, reveals key trends in the market of 233 active listings.
Whether you're considering an Airbnb investment in Kapaa, optimizing your existing vacation rental, or exploring rental arbitrage opportunities, understanding the Kapaa Airbnb data is crucial. Navigating the high regulation landscape is key to maximizing your short term rental income potential. Let's dive into the specifics.
Key Kapaa Airbnb Performance Metrics Overview
Monthly Airbnb Revenue Variations & Income Potential in Kapaa (2026)
Understanding the monthly revenue variations for Airbnb listings in Kapaa is key to maximizing your short term rental income potential. Seasonality significantly impacts earnings. Our analysis, based on data from the past 12 months, shows that the peak revenue month for STRs in Kapaa is typically March, while January often presents the lowest earnings, highlighting opportunities for strategic pricing adjustments during shoulder and low seasons. Explore the typical Airbnb income in Kapaa across different performance tiers:
- Best-in-class properties (Top 10%) achieve $13,599+ monthly, often utilizing dynamic pricing and superior guest experiences.
- Strong performing properties (Top 25%) earn $9,494 or more, indicating effective management and desirable locations/amenities.
- Typical properties (Median) generate around $6,054 per month, representing the average market performance.
- Entry-level properties (Bottom 25%) see earnings around $3,655, often with potential for optimization.
Average Monthly Airbnb Earnings Trend in Kapaa
Kapaa Airbnb Occupancy Rate Trends (2026)
Maximize your bookings by understanding the Kapaa STR occupancy trends. Seasonal demand shifts significantly influence how often properties are booked. Typically, Februarysees the highest demand (peak season occupancy), while January experiences the lowest (low season). Effective strategies, like adjusting minimum stays or offering promotions, can boost occupancy during slower periods. Here's how different property tiers perform in Kapaa:
- Best-in-class properties (Top 10%) achieve 91%+ occupancy, indicating high desirability and potentially optimized availability.
- Strong performing properties (Top 25%) maintain 82% or higher occupancy, suggesting good market fit and guest satisfaction.
- Typical properties (Median) have an occupancy rate around 65%.
- Entry-level properties (Bottom 25%) average 35% occupancy, potentially facing higher vacancy.
Average Monthly Occupancy Rate Trend in Kapaa
Average Daily Rate (ADR) Airbnb Trends in Kapaa (2026)
Effective short term rental pricing strategy in Kapaa involves understanding monthly ADR fluctuations. The Average Daily Rate (ADR) for Airbnb in Kapaa typically peaks in January and dips lowest during April. Leveraging Airbnb dynamic pricing tools or strategies based on this seasonality can significantly boost revenue. Here's a look at the typical nightly rates achieved:
- Best-in-class properties (Top 10%) command rates of $686+ per night, often due to premium features or locations.
- Strong performing properties (Top 25%) achieve nightly rates of $524 or more.
- Typical properties (Median) charge around $363 per night.
- Entry-level properties (Bottom 25%) earn around $282 per night.
Average Daily Rate (ADR) Trend by Month in Kapaa
Get Live Kapaa Market Intelligence 👇

Explore Real-time Analytics
Airbnb Seasonality Analysis & Trends in Kapaa (2026)
Peak Season (March, July, February)
- Revenue averages $8,185 per month
- Occupancy rates average 68.4%
- Daily rates average $413
Shoulder Season
- Revenue averages $6,892 per month
- Occupancy maintains around 58.5%
- Daily rates hold near $409
Low Season (January, September, December)
- Revenue drops to average $6,159 per month
- Occupancy decreases to average 48.5%
- Daily rates adjust to average $431
Seasonality Insights for Kapaa
- The Airbnb seasonality in Kapaa shows moderate seasonality with distinct peak and low periods. While the sections above show seasonal averages, it's also insightful to look at the extremes:
- During the high season, the absolute peak month showcases Kapaa's highest earning potential, with monthly revenues capable of climbing to $8,274, occupancy reaching a high of 71.8%, and ADRs peaking at $442.
- Conversely, the slowest single month of the year, typically falling within the low season, marks the market's lowest point. In this month, revenue might dip to $5,700, occupancy could drop to 42.2%, and ADRs may adjust down to $399.
- Understanding both the seasonal averages and these monthly peaks and troughs in revenue, occupancy, and ADR is crucial for maximizing your Airbnb profit potential in Kapaa.
Seasonal Strategies for Maximizing Profit
- Peak Season: Maximize revenue through premium pricing and potentially longer minimum stays. Ensure high availability.
- Low Season: Offer competitive pricing, special promotions (e.g., extended stay discounts), and flexible cancellation policies. Target off-season travelers like remote workers or budget-conscious guests.
- Shoulder Seasons: Implement dynamic pricing that balances peak and low rates. Target weekend travelers or specific events. Offer slightly more flexible terms than peak season.
- Regularly analyze your own performance against these Kapaa seasonality benchmarks and adjust your pricing and availability strategy accordingly.
Best Areas for Airbnb Investment in Kapaa (2026)
Exploring the top neighborhoods for short-term rentals in Kapaa? This section highlights key areas, outlining why they are attractive for hosts and guests, along with notable local attractions. Consider these locations based on your target guest profile and investment strategy.
| Neighborhood / Area | Why Host Here? (Target Guests & Appeal) | Key Attractions & Landmarks |
|---|---|---|
| Kealia Beach | Stunning beach known for its golden sands and ideal surfing conditions. Perfect for tourists looking to relax and enjoy water activities on the east coast of Kauai. | Kealia Beach, Kauai Path, Kauai Beachbox, Lydgate State Park, Opaekaa Falls |
| Lydgate State Park | Great family-friendly park with beautiful beaches and a large swimming area. Ideal for families wanting a safe and fun beach experience. | Lydgate State Park, Wailua River, Lydgate Beach, walking trails, picnic areas |
| Wailua Falls | A breathtaking waterfall that's a popular tourist spot. Offers stunning views and ideal for nature lovers and photographers. | Wailua Falls, Opaekaa Falls, Hiking trails, Horseback riding, Scenic overlook |
| Kapaa Town | Charming town with a local vibe, great local shops and restaurants. A great base for tourists looking to explore the east coast. | Kapaa Beach Park, Coconut Marketplace, local shops, restaurants, Kauai Bike Path |
| Donkey Beach | A quieter beach known for its scenic beauty and less crowded environment. Great for those looking to escape the busyness of typical tourist spots. | Donkey Beach, relaxing spots, scenic views, snorkeling, sunbathing |
| Opaekaa Falls Lookout | A stunning lookout point to one of Kauai's most beautiful waterfalls, a must-see for visitors to the island. | Opaekaa Falls, scenic views, photo opportunities, near hiking trails, nature walks |
| Noni Farms | Unique farm experiences that showcase local agriculture and culture. Great for tourists interested in sustainability and farm-to-table experiences. | Noni farm tours, agricultural experiences, local produce, workshops, nature |
| Sleeping Giant (Nounou Mountain) | A popular hiking destination offering trails and panoramic views. Perfect for hikers and nature enthusiasts. | Sleeping Giant trail, Hiking trails, Scenic views, Wildlife, Nature photography |
Understanding Airbnb License Requirements & STR Laws in Kapaa (2026)
Yes, Kapaa, Hawaii, United States enforces high STR regulations. Obtaining a license and ensuring compliance is almost certainly required according to current 2026 STR laws. Always verify the latest short term rental regulations and Airbnb license requirements directly with local government authorities for Kapaa to ensure full compliance before hosting.
(Source: AirROI data, 2026, based on 97% licensed listings)
Top Performing Airbnb Properties in Kapaa (2026)
Benchmark your potential! Explore examples of top-performing Airbnb properties in Kapaabased on Trailing Twelve Month (TTM) revenue. Analyze their characteristics, revenue, occupancy rate, and ADR to understand what drives success in this market.

Breathtaking Ocean View Waipouli Beach Resort AC
Entire Place • 3 bedrooms

Oceanfront Harmony- 4 Bds On the Beach! TVNC 4247
Entire Place • 4 bedrooms

Waipouli Oceanfront Condo! - Steps to the Beach
Entire Place • 2 bedrooms

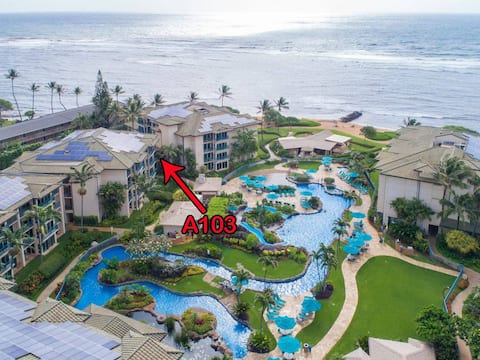
Paradise Awaits! Beachfront! Pool! Waterslides!
Entire Place • 2 bedrooms
Waipouli Beach Resort | Lazy River & Water Slides
Entire Place • 2 bedrooms
Aloha Beaches 1st floor Garden View steps to Beach
Entire Place • 2 bedrooms
Note: Performance varies based on location, size, amenities, seasonality, and management quality. Data reflects the past 12 months.
Top Performing Airbnb Hosts in Kapaa (2026)
Learn from the best! This table showcases top-performing Airbnb hosts in Kapaa based on the number of properties managed and estimated total revenue over the past year. Analyze their scale and performance metrics.
| Host Name | Properties | Grossing Revenue | Stay Reviews | Avg Rating |
|---|---|---|---|---|
| Kanani | 23 | $1,875,214 | 400 | 4.79/5.0 |
| Kaua’i | 22 | $1,775,369 | 616 | 4.87/5.0 |
| Kauai Calls | 21 | $788,736 | 85 | 4.85/5.0 |
| Tina | 8 | $732,629 | 302 | 4.85/5.0 |
| Margaret | 13 | $659,694 | 2791 | 4.87/5.0 |
| David | 7 | $536,934 | 404 | 4.79/5.0 |
| Pohaku Vacation Rentals | 12 | $461,551 | 527 | 4.70/5.0 |
| Mike | 2 | $376,424 | 124 | 4.97/5.0 |
| Kayla | 2 | $365,949 | 194 | 4.83/5.0 |
| Ellen | 2 | $353,033 | 296 | 4.91/5.0 |
Analyzing the strategies of top hosts, such as their property selection, pricing, and guest communication, can offer valuable lessons for optimizing your own Airbnb operations in Kapaa.
Dive Deeper: Advanced Kapaa STR Market Data (2026)
Ready to unlock more insights? AirROI provides access to advanced metrics and comprehensive Airbnb data for Kapaa. Explore detailed analytics beyond this report to refine your investment strategy, optimize pricing, and maximize your vacation rental profits.
Explore Advanced MetricsKapaa Short-Term Rental Market Composition (2026): Property & Room Types
Room Type Distribution
Property Type Distribution
Market Composition Insights for Kapaa
- The Kapaa Airbnb market composition is heavily skewed towards Entire Home/Apt listings, which make up 98.7% of the 233 active rentals. This indicates strong guest preference for privacy and space.
- Looking at the property type distribution in Kapaa, Apartment/Condo properties are the most common (93.1%), reflecting the local real estate landscape.
- Smaller segments like house, others, hotel/boutique (combined 6.9%) offer potential for unique stay experiences.
Kapaa Airbnb Room Capacity Analysis (2026): Bedroom Distribution
Distribution of Listings by Number of Bedrooms
Room Capacity Insights for Kapaa
- The dominant room capacity in Kapaa is 2 bedrooms listings, making up 54.9% of the market. This suggests a strong demand for properties suitable for couples or solo travelers.
- Together, 2 bedrooms and 1 bedroom properties represent 90.1% of the active Airbnb listings in Kapaa, indicating a high concentration in these sizes.
- Listings with 3+ bedrooms (3.9%) represent a smaller niche, potentially indicating an underserved market for larger group accommodations in Kapaa.
Kapaa Vacation Rental Guest Capacity Trends (2026)
Distribution of Listings by Guest Capacity
Guest Capacity Insights for Kapaa
- The most common guest capacity trend in Kapaa vacation rentals is listings accommodating 4 guests (42.9%). This suggests the primary traveler segment is likely small families or groups.
- Properties designed for 4 guests and 6 guests dominate the Kapaa STR market, accounting for 72.9% of listings.
- 39.0% of properties accommodate 6+ guests, serving the market segment for larger families or group travel in Kapaa.
- On average, properties in Kapaa are equipped to host 4.7 guests.
Kapaa Airbnb Booking Patterns (2026): Available vs. Booked Days
Available Days Distribution
Booked Days Distribution
Booking Pattern Insights for Kapaa
- The most common availability pattern in Kapaa falls within the 271-366 days range, representing 33.9% of listings. This suggests many properties have significant open periods on their calendars.
- Approximately 48.5% of listings show high availability (181+ days open annually), indicating potential for increased bookings or specific owner usage patterns.
- For booked days, the 181-270 days range is most frequent in Kapaa (30.5%), reflecting common guest stay durations or potential owner blocking patterns.
- A notable 52.4% of properties secure long booking periods (181+ days booked per year), highlighting successful long-term rental strategies or significant owner usage.
Kapaa Airbnb Minimum Stay Requirements Analysis
Distribution of Listings by Minimum Night Requirement
1 Night
35 listings
15% of total
2 Nights
21 listings
9% of total
3 Nights
33 listings
14.2% of total
4-6 Nights
27 listings
11.6% of total
7-29 Nights
3 listings
1.3% of total
30+ Nights
114 listings
48.9% of total
Key Insights
- The most prevalent minimum stay requirement in Kapaa is 30+ Nights, adopted by 48.9% of listings. This highlights the market's preference for longer commitments.
- A significant segment (48.9%) caters to monthly stays (30+ nights) in Kapaa, pointing to opportunities in the extended-stay market.
Recommendations
- Align with the market by considering a 30+ Nights minimum stay, as 48.9% of Kapaa hosts use this setting.
- If feasible, allowing 1-night stays, especially midweek or during low season, could capture last-minute bookings, as only 15% currently do.
- Explore offering discounts for stays of 30+ nights to attract the 48.9% of the market seeking extended stays.
- Adjust minimum nights based on seasonality – potentially shorter during low season and longer during peak demand periods in Kapaa.
Kapaa Airbnb Cancellation Policy Trends Analysis (2026)
Super Strict 30 Days
18 listings
7.8% of total
Limited
3 listings
1.3% of total
Super Strict 60 Days
56 listings
24.2% of total
Flexible
16 listings
6.9% of total
Moderate
26 listings
11.3% of total
Firm
93 listings
40.3% of total
Strict
19 listings
8.2% of total
Cancellation Policy Insights for Kapaa
- The prevailing Airbnb cancellation policy trend in Kapaa is Firm, used by 40.3% of listings.
- There's a relatively balanced mix between guest-friendly (18.2%) and stricter (48.5%) policies, offering choices for different guest needs.
- Strict cancellation policies are quite rare (8.2%), potentially making listings with this policy less competitive unless justified by high demand or property type.
Recommendations for Hosts
- Consider adopting a Firm policy to align with the 40.3% market standard in Kapaa.
- Using a Strict policy might deter some guests, as only 8.2% of listings use it. Evaluate if potential revenue protection outweighs possible lower booking rates.
- Regularly review your cancellation policy against competitors and market demand shifts in Kapaa.
Kapaa STR Booking Lead Time Analysis (2026)
Average Booking Lead Time by Month
Booking Lead Time Insights for Kapaa
- The overall average booking lead time for vacation rentals in Kapaa is 99 days.
- Guests book furthest in advance for stays during February (average 109 days), likely coinciding with peak travel demand or local events.
- The shortest booking windows occur for stays in August (average 84 days), indicating more last-minute travel plans during this time.
- Seasonally, Winter (103 days avg.) sees the longest lead times, while Summer (93 days avg.) has the shortest, reflecting typical travel planning cycles.
Recommendations for Hosts
- Use the overall average lead time (99 days) as a baseline for your pricing and availability strategy in Kapaa.
- Target marketing efforts for the Winter season well in advance (at least 103 days) to capture early planners.
- Monitor your own booking lead times against these Kapaa averages to identify opportunities for dynamic pricing adjustments.
Popular & Essential Airbnb Amenities in Kapaa (2026)
Amenity Prevalence
Amenity Insights for Kapaa
- Essential amenities in Kapaa that guests expect include: TV, Wifi, Hair dryer, Kitchen. Lacking these (any) could significantly impact bookings.
- Popular amenities like Microwave, BBQ grill, Coffee maker are common but not universal. Offering these can provide a competitive edge.
Recommendations for Hosts
- Ensure your listing includes all essential amenities for Kapaa: TV, Wifi, Hair dryer, Kitchen.
- Prioritize adding missing essentials: Hair dryer, Kitchen.
- Consider adding popular differentiators like Microwave or BBQ grill to increase appeal.
- Highlight unique or less common amenities you offer (e.g., hot tub, dedicated workspace, EV charger) in your listing description and photos.
- Regularly check competitor amenities in Kapaa to stay competitive.
Kapaa Airbnb Guest Demographics & Profile Analysis (2026)
Guest Profile Summary for Kapaa
- The typical guest profile for Airbnb in Kapaa consists of primarily domestic travelers (93%), often arriving from nearby Seattle, typically belonging to the Post-2000s (Gen Z/Alpha) group (50%), primarily speaking English or Spanish.
- Domestic travelers account for 92.5% of guests.
- Key international markets include United States (92.5%) and Canada (2.2%).
- Top languages spoken are English (69.3%) followed by Spanish (10.8%).
- A significant demographic segment is the Post-2000s (Gen Z/Alpha) group, representing 50% of guests.
Recommendations for Hosts
- Target domestic marketing efforts towards travelers from Seattle and San Diego.
- Tailor amenities and listing descriptions to appeal to the dominant Post-2000s (Gen Z/Alpha) demographic (e.g., highlight fast WiFi, smart home features, local guides).
- Highlight unique local experiences or amenities relevant to the primary guest profile.
- Consider seasonal promotions aligned with peak travel times for key origin markets.
Nearby Short-Term Rental Market Comparison
How does the Kapaa Airbnb market stack up against its neighbors? Compare key performance metrics like average monthly revenue, ADR, and occupancy rates in surrounding areas to understand the broader regional STR landscape.
| Market | Active Properties | Monthly Revenue | Daily Rate | Avg. Occupancy |
|---|---|---|---|---|
| Haena | 12 | $14,312 | $1130.41 | 51% |
| Anahola | 22 | $13,673 | $845.34 | 54% |
| Mākaha Valley | 96 | $13,116 | $669.71 | 70% |
| Kilauea | 45 | $9,733 | $1064.42 | 50% |
| Kekaha | 14 | $9,595 | $545.34 | 65% |
| Koloa | 266 | $8,991 | $942.59 | 48% |
| Hanalei | 426 | $6,937 | $560.08 | 50% |
| Poipu | 1,140 | $6,673 | $596.99 | 48% |
| Kapolei | 520 | $6,393 | $688.27 | 44% |
| Princeville | 1,362 | $5,590 | $429.56 | 50% |