Kailua Airbnb Market Analysis 2026: Short Term Rental Data & Vacation Rental Statistics in Hawaii, United States
Is Airbnb profitable in Kailua in 2026? Explore comprehensive Airbnb analytics for Kailua, Hawaii, United States to uncover income potential. This 2026 STR market report for Kailua, based on AirROI data from February 2025 to January 2026, reveals key trends in the market of 900 active listings.
Whether you're considering an Airbnb investment in Kailua, optimizing your existing vacation rental, or exploring rental arbitrage opportunities, understanding the Kailua Airbnb data is crucial. Navigating the high regulation landscape is key to maximizing your short term rental income potential. Let's dive into the specifics.
Key Kailua Airbnb Performance Metrics Overview
Monthly Airbnb Revenue Variations & Income Potential in Kailua (2026)
Understanding the monthly revenue variations for Airbnb listings in Kailua is key to maximizing your short term rental income potential. Seasonality significantly impacts earnings. Our analysis, based on data from the past 12 months, shows that the peak revenue month for STRs in Kailua is typically February, while September often presents the lowest earnings, highlighting opportunities for strategic pricing adjustments during shoulder and low seasons. Explore the typical Airbnb income in Kailua across different performance tiers:
- Best-in-class properties (Top 10%) achieve $9,563+ monthly, often utilizing dynamic pricing and superior guest experiences.
- Strong performing properties (Top 25%) earn $5,892 or more, indicating effective management and desirable locations/amenities.
- Typical properties (Median) generate around $3,781 per month, representing the average market performance.
- Entry-level properties (Bottom 25%) see earnings around $2,060, often with potential for optimization.
Average Monthly Airbnb Earnings Trend in Kailua
Kailua Airbnb Occupancy Rate Trends (2026)
Maximize your bookings by understanding the Kailua STR occupancy trends. Seasonal demand shifts significantly influence how often properties are booked. Typically, Februarysees the highest demand (peak season occupancy), while January experiences the lowest (low season). Effective strategies, like adjusting minimum stays or offering promotions, can boost occupancy during slower periods. Here's how different property tiers perform in Kailua:
- Best-in-class properties (Top 10%) achieve 89%+ occupancy, indicating high desirability and potentially optimized availability.
- Strong performing properties (Top 25%) maintain 78% or higher occupancy, suggesting good market fit and guest satisfaction.
- Typical properties (Median) have an occupancy rate around 55%.
- Entry-level properties (Bottom 25%) average 27% occupancy, potentially facing higher vacancy.
Average Monthly Occupancy Rate Trend in Kailua
Average Daily Rate (ADR) Airbnb Trends in Kailua (2026)
Effective short term rental pricing strategy in Kailua involves understanding monthly ADR fluctuations. The Average Daily Rate (ADR) for Airbnb in Kailua typically peaks in January and dips lowest during April. Leveraging Airbnb dynamic pricing tools or strategies based on this seasonality can significantly boost revenue. Here's a look at the typical nightly rates achieved:
- Best-in-class properties (Top 10%) command rates of $583+ per night, often due to premium features or locations.
- Strong performing properties (Top 25%) achieve nightly rates of $346 or more.
- Typical properties (Median) charge around $239 per night.
- Entry-level properties (Bottom 25%) earn around $176 per night.
Average Daily Rate (ADR) Trend by Month in Kailua
Get Live Kailua Market Intelligence 👇

Explore Real-time Analytics
Airbnb Seasonality Analysis & Trends in Kailua (2026)
Peak Season (February, December, March)
- Revenue averages $6,196 per month
- Occupancy rates average 61.0%
- Daily rates average $356
Shoulder Season
- Revenue averages $5,204 per month
- Occupancy maintains around 49.6%
- Daily rates hold near $354
Low Season (April, August, September)
- Revenue drops to average $4,627 per month
- Occupancy decreases to average 50.1%
- Daily rates adjust to average $333
Seasonality Insights for Kailua
- The Airbnb seasonality in Kailua shows moderate seasonality with distinct peak and low periods. While the sections above show seasonal averages, it's also insightful to look at the extremes:
- During the high season, the absolute peak month showcases Kailua's highest earning potential, with monthly revenues capable of climbing to $6,421, occupancy reaching a high of 70.0%, and ADRs peaking at $392.
- Conversely, the slowest single month of the year, typically falling within the low season, marks the market's lowest point. In this month, revenue might dip to $4,523, occupancy could drop to 48.3%, and ADRs may adjust down to $323.
- Understanding both the seasonal averages and these monthly peaks and troughs in revenue, occupancy, and ADR is crucial for maximizing your Airbnb profit potential in Kailua.
Seasonal Strategies for Maximizing Profit
- Peak Season: Maximize revenue through premium pricing and potentially longer minimum stays. Ensure high availability.
- Low Season: Offer competitive pricing, special promotions (e.g., extended stay discounts), and flexible cancellation policies. Target off-season travelers like remote workers or budget-conscious guests.
- Shoulder Seasons: Implement dynamic pricing that balances peak and low rates. Target weekend travelers or specific events. Offer slightly more flexible terms than peak season.
- Regularly analyze your own performance against these Kailua seasonality benchmarks and adjust your pricing and availability strategy accordingly.
Best Areas for Airbnb Investment in Kailua (2026)
Exploring the top neighborhoods for short-term rentals in Kailua? This section highlights key areas, outlining why they are attractive for hosts and guests, along with notable local attractions. Consider these locations based on your target guest profile and investment strategy.
| Neighborhood / Area | Why Host Here? (Target Guests & Appeal) | Key Attractions & Landmarks |
|---|---|---|
| Kailua Beach | Famous for its stunning turquoise waters and soft sandy shores, Kailua Beach is a top destination for beach lovers and families seeking relaxation and water activities. | Kailua Beach Park, Lanikai Beach, Kayaking to the Mokulua Islands, Sunset Beach, Kailua Farmers Market |
| Lanikai | Known for its picturesque beaches and clear waters, Lanikai is a tranquil neighborhood that attracts visitors looking for idyllic surroundings and outdoor adventures. | Lanikai Beach, Lanikai Pillbox hike, Mokolua Islands, Lanikai Kayak Rentals, Lanikai Wake-Up |
| Kailua Town | The charming town center of Kailua offers a mix of local shops, restaurants, and cafes, making it a popular spot for tourists to explore local culture and cuisine. | Kailua Town Center, Aloha Point Market, Kailua Cinemas, Buzz’s Lanikai, Island Snow |
| Kalapawai Park | This quaint park is a favorite among locals and visitors alike, offering ample space for picnics and access to Kailua Beach, perfect for families with children. | Kalapawai Park, Kailua Bike Path, Nearby coffee shops, Scenic beach views, Picnic areas |
| Kailua Marina | A central hub for water activities, Kailua Marina is ideal for tourists who enjoy boating, kayaking, and snorkeling in the beautiful waters of Kailua. | Kailua Marina, Kayak and paddleboard rentals, Scenic waterfront dining, Boat tours, Nearby beaches |
| Coconut Grove | This laid-back neighborhood features beautiful homes, lush vegetation, and a strong community vibe, appealing to visitors looking for a serene environment. | Coconut Grove Park, Hiking trails, Scenic viewpoints, Local eateries, Nature walks |
| Kailua Community Park | A well-equipped park that attracts families and active visitors, offering numerous sports facilities and easy access to outdoor activities like hiking and beach sports. | Playgrounds, Tennis courts, Basketball courts, Open fields, Walking paths |
| Lanikai Pillbox Hike | A popular hiking destination offering breathtaking views of the coast, this area attracts adventurous travelers and nature enthusiasts. | Pillbox lookout point, Stunning coastal views, Hiking trails, Sunrise/sunset views, Nearby beaches |
Understanding Airbnb License Requirements & STR Laws in Kailua (2026)
Yes, Kailua, Hawaii, United States enforces high STR regulations. Obtaining a license and ensuring compliance is almost certainly required according to current 2026 STR laws. Always verify the latest short term rental regulations and Airbnb license requirements directly with local government authorities for Kailua to ensure full compliance before hosting.
(Source: AirROI data, 2026, based on 55% licensed listings)
Top Performing Airbnb Properties in Kailua (2026)
Benchmark your potential! Explore examples of top-performing Airbnb properties in Kailuabased on Trailing Twelve Month (TTM) revenue. Analyze their characteristics, revenue, occupancy rate, and ADR to understand what drives success in this market.

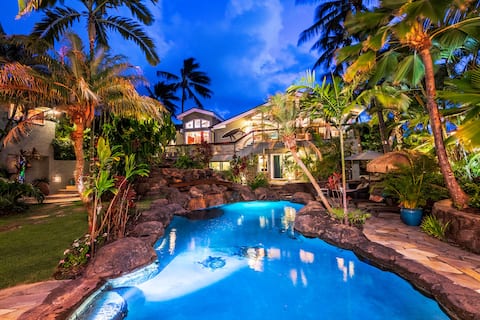
Luxury Kona Mansion: Infinity Pool & Epic Views
Entire Place • 7 bedrooms
Palione Papalani - Kailua License #1990/NUC-1787
Entire Place • 6 bedrooms
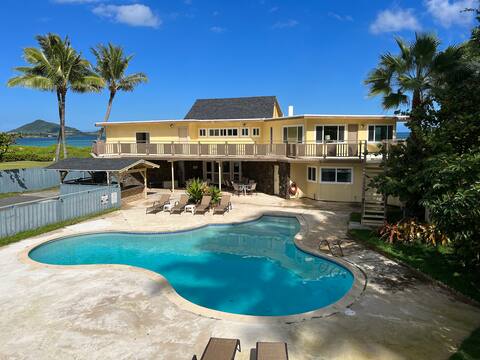
Kailua Beachfront Villa 1990/NUC-1798
Entire Place • 8 bedrooms
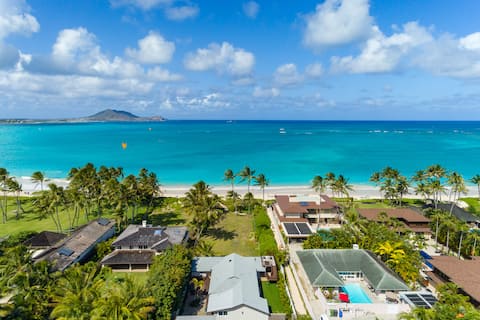
Hale Oahu Estate- Kailua BeachFront- Lic. Rental #
Entire Place • 6 bedrooms
Kailua Kai - Kailua Beach Front - Lic. Rental: #19
Entire Place • 4 bedrooms
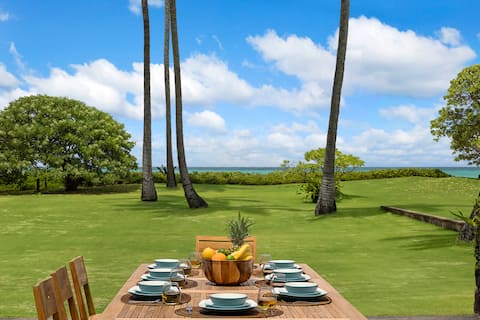
Luxury Oceanfront Estate
Entire Place • 5 bedrooms
Note: Performance varies based on location, size, amenities, seasonality, and management quality. Data reflects the past 12 months.
Top Performing Airbnb Hosts in Kailua (2026)
Learn from the best! This table showcases top-performing Airbnb hosts in Kailua based on the number of properties managed and estimated total revenue over the past year. Analyze their scale and performance metrics.
| Host Name | Properties | Grossing Revenue | Stay Reviews | Avg Rating |
|---|---|---|---|---|
| Private Homes Hawaii | 6 | $2,283,532 | 56 | 4.97/5.0 |
| Gather | 20 | $1,980,977 | 622 | 4.78/5.0 |
| Knutson & Associates | 50 | $1,959,374 | 506 | 4.65/5.0 |
| Evolve | 29 | $1,026,215 | 746 | 4.40/5.0 |
| Jason | 4 | $991,415 | 81 | 5.00/5.0 |
| Casago Kona | 23 | $910,528 | 857 | 4.57/5.0 |
| Koya | 4 | $728,978 | 164 | 4.92/5.0 |
| Jace | 3 | $661,196 | 117 | 4.70/5.0 |
| Kailua Surf And Sand | 2 | $643,764 | 221 | 4.76/5.0 |
| Coldwell Banker Island Vacatio | 13 | $559,255 | 262 | 4.57/5.0 |
Analyzing the strategies of top hosts, such as their property selection, pricing, and guest communication, can offer valuable lessons for optimizing your own Airbnb operations in Kailua.
Dive Deeper: Advanced Kailua STR Market Data (2026)
Ready to unlock more insights? AirROI provides access to advanced metrics and comprehensive Airbnb data for Kailua. Explore detailed analytics beyond this report to refine your investment strategy, optimize pricing, and maximize your vacation rental profits.
Explore Advanced MetricsKailua Short-Term Rental Market Composition (2026): Property & Room Types
Room Type Distribution
Property Type Distribution
Market Composition Insights for Kailua
- The Kailua Airbnb market composition is heavily skewed towards Entire Home/Apt listings, which make up 92.7% of the 900 active rentals. This indicates strong guest preference for privacy and space.
- Looking at the property type distribution in Kailua, Apartment/Condo properties are the most common (59.8%), reflecting the local real estate landscape.
- Houses represent a significant 26.2% portion, catering likely to families or larger groups.
- The presence of 7.4% Hotel/Boutique listings indicates integration with traditional hospitality.
- Smaller segments like outdoor/unique, unique stays (combined 0.3%) offer potential for unique stay experiences.
Kailua Airbnb Room Capacity Analysis (2026): Bedroom Distribution
Distribution of Listings by Number of Bedrooms
Room Capacity Insights for Kailua
- The dominant room capacity in Kailua is 1 bedroom listings, making up 46.3% of the market. This suggests a strong demand for properties suitable for couples or solo travelers.
- Together, 1 bedroom and 2 bedrooms properties represent 68.9% of the active Airbnb listings in Kailua, indicating a high concentration in these sizes.
Kailua Vacation Rental Guest Capacity Trends (2026)
Distribution of Listings by Guest Capacity
Guest Capacity Insights for Kailua
- The most common guest capacity trend in Kailua vacation rentals is listings accommodating 4 guests (31.3%). This suggests the primary traveler segment is likely small families or groups.
- Properties designed for 4 guests and 2 guests dominate the Kailua STR market, accounting for 56.5% of listings.
- 27.5% of properties accommodate 6+ guests, serving the market segment for larger families or group travel in Kailua.
- On average, properties in Kailua are equipped to host 4.0 guests.
Kailua Airbnb Booking Patterns (2026): Available vs. Booked Days
Available Days Distribution
Booked Days Distribution
Booking Pattern Insights for Kailua
- The most common availability pattern in Kailua falls within the 271-366 days range, representing 39.2% of listings. This suggests many properties have significant open periods on their calendars.
- Approximately 63.6% of listings show high availability (181+ days open annually), indicating potential for increased bookings or specific owner usage patterns.
- For booked days, the 91-180 days range is most frequent in Kailua (24.9%), reflecting common guest stay durations or potential owner blocking patterns.
- A notable 37.1% of properties secure long booking periods (181+ days booked per year), highlighting successful long-term rental strategies or significant owner usage.
Kailua Airbnb Minimum Stay Requirements Analysis
Distribution of Listings by Minimum Night Requirement
1 Night
82 listings
9.1% of total
2 Nights
121 listings
13.5% of total
3 Nights
82 listings
9.1% of total
4-6 Nights
91 listings
10.1% of total
7-29 Nights
54 listings
6% of total
30+ Nights
469 listings
52.2% of total
Key Insights
- The most prevalent minimum stay requirement in Kailua is 30+ Nights, adopted by 52.2% of listings. This highlights the market's preference for longer commitments.
- A significant segment (52.2%) caters to monthly stays (30+ nights) in Kailua, pointing to opportunities in the extended-stay market.
Recommendations
- Align with the market by considering a 30+ Nights minimum stay, as 52.2% of Kailua hosts use this setting.
- If feasible, allowing 1-night stays, especially midweek or during low season, could capture last-minute bookings, as only 9.1% currently do.
- Explore offering discounts for stays of 30+ nights to attract the 52.2% of the market seeking extended stays.
- Adjust minimum nights based on seasonality – potentially shorter during low season and longer during peak demand periods in Kailua.
Kailua Airbnb Cancellation Policy Trends Analysis (2026)
Limited
17 listings
1.9% of total
Super Strict 30 Days
31 listings
3.5% of total
Super Strict 60 Days
97 listings
10.8% of total
Flexible
46 listings
5.1% of total
Moderate
108 listings
12% of total
Firm
379 listings
42.2% of total
Strict
220 listings
24.5% of total
Cancellation Policy Insights for Kailua
- The prevailing Airbnb cancellation policy trend in Kailua is Firm, used by 42.2% of listings.
- A majority (66.7%) of hosts in Kailua utilize Firm or Strict policies, indicating a market where hosts prioritize booking security.
Recommendations for Hosts
- Consider adopting a Firm policy to align with the 42.2% market standard in Kailua.
- Regularly review your cancellation policy against competitors and market demand shifts in Kailua.
Kailua STR Booking Lead Time Analysis (2026)
Average Booking Lead Time by Month
Booking Lead Time Insights for Kailua
- The overall average booking lead time for vacation rentals in Kailua is 76 days.
- Guests book furthest in advance for stays during October (average 105 days), likely coinciding with peak travel demand or local events.
- The shortest booking windows occur for stays in August (average 66 days), indicating more last-minute travel plans during this time.
- Seasonally, Winter (86 days avg.) sees the longest lead times, while Spring (68 days avg.) has the shortest, reflecting typical travel planning cycles.
Recommendations for Hosts
- Use the overall average lead time (76 days) as a baseline for your pricing and availability strategy in Kailua.
- For October stays, consider implementing length-of-stay discounts or slightly higher rates for bookings made less than 105 days out to capitalize on advance planning.
- Target marketing efforts for the Winter season well in advance (at least 86 days) to capture early planners.
- Monitor your own booking lead times against these Kailua averages to identify opportunities for dynamic pricing adjustments.
Popular & Essential Airbnb Amenities in Kailua (2026)
Amenity Prevalence
Amenity Insights for Kailua
- Essential amenities in Kailua that guests expect include: Wifi, Smoke alarm, TV. Lacking these (any) could significantly impact bookings.
- Popular amenities like Free parking on premises, Hair dryer, Coffee maker are common but not universal. Offering these can provide a competitive edge.
Recommendations for Hosts
- Ensure your listing includes all essential amenities for Kailua: Wifi, Smoke alarm, TV.
- Prioritize adding missing essentials: Wifi, Smoke alarm, TV.
- Consider adding popular differentiators like Free parking on premises or Hair dryer to increase appeal.
- Highlight unique or less common amenities you offer (e.g., hot tub, dedicated workspace, EV charger) in your listing description and photos.
- Regularly check competitor amenities in Kailua to stay competitive.
Kailua Airbnb Guest Demographics & Profile Analysis (2026)
Guest Profile Summary for Kailua
- The typical guest profile for Airbnb in Kailua consists of primarily domestic travelers (85%), often arriving from nearby Seattle, typically belonging to the Post-2000s (Gen Z/Alpha) group (50%), primarily speaking English or Spanish.
- Domestic travelers account for 84.7% of guests.
- Key international markets include United States (84.7%) and Canada (4.9%).
- Top languages spoken are English (63.3%) followed by Spanish (10.1%).
- A significant demographic segment is the Post-2000s (Gen Z/Alpha) group, representing 50% of guests.
Recommendations for Hosts
- Target domestic marketing efforts towards travelers from Seattle and San Francisco.
- Tailor amenities and listing descriptions to appeal to the dominant Post-2000s (Gen Z/Alpha) demographic (e.g., highlight fast WiFi, smart home features, local guides).
- Highlight unique local experiences or amenities relevant to the primary guest profile.
- Consider seasonal promotions aligned with peak travel times for key origin markets.
Nearby Short-Term Rental Market Comparison
How does the Kailua Airbnb market stack up against its neighbors? Compare key performance metrics like average monthly revenue, ADR, and occupancy rates in surrounding areas to understand the broader regional STR landscape.
| Market | Active Properties | Monthly Revenue | Daily Rate | Avg. Occupancy |
|---|---|---|---|---|
| Kahuku | 287 | $11,358 | $679.39 | 64% |
| Kula | 11 | $9,130 | $383.13 | 79% |
| Waimea | 416 | $8,098 | $819.38 | 43% |
| Puakō | 62 | $7,820 | $874.88 | 44% |
| Hana | 68 | $7,791 | $413.38 | 65% |
| Makawao | 19 | $7,315 | $437.12 | 67% |
| Kapalua | 297 | $7,140 | $741.15 | 42% |
| Honalo | 24 | $7,044 | $410.83 | 56% |
| Paia | 88 | $6,942 | $546.66 | 49% |
| Wailea-Makena | 11 | $6,581 | $787.33 | 46% |