Kahuku Airbnb Market Analysis 2026: Short Term Rental Data & Vacation Rental Statistics in Hawaii, United States
Is Airbnb profitable in Kahuku in 2026? Explore comprehensive Airbnb analytics for Kahuku, Hawaii, United States to uncover income potential. This 2026 STR market report for Kahuku, based on AirROI data from February 2025 to January 2026, reveals key trends in the market of 287 active listings.
Whether you're considering an Airbnb investment in Kahuku, optimizing your existing vacation rental, or exploring rental arbitrage opportunities, understanding the Kahuku Airbnb data is crucial. Navigating the high regulation landscape is key to maximizing your short term rental income potential. Let's dive into the specifics.
Key Kahuku Airbnb Performance Metrics Overview
Monthly Airbnb Revenue Variations & Income Potential in Kahuku (2026)
Understanding the monthly revenue variations for Airbnb listings in Kahuku is key to maximizing your short term rental income potential. Seasonality significantly impacts earnings. Our analysis, based on data from the past 12 months, shows that the peak revenue month for STRs in Kahuku is typically July, while November often presents the lowest earnings, highlighting opportunities for strategic pricing adjustments during shoulder and low seasons. Explore the typical Airbnb income in Kahuku across different performance tiers:
- Best-in-class properties (Top 10%) achieve $25,812+ monthly, often utilizing dynamic pricing and superior guest experiences.
- Strong performing properties (Top 25%) earn $14,409 or more, indicating effective management and desirable locations/amenities.
- Typical properties (Median) generate around $10,154 per month, representing the average market performance.
- Entry-level properties (Bottom 25%) see earnings around $7,022, often with potential for optimization.
Average Monthly Airbnb Earnings Trend in Kahuku
Kahuku Airbnb Occupancy Rate Trends (2026)
Maximize your bookings by understanding the Kahuku STR occupancy trends. Seasonal demand shifts significantly influence how often properties are booked. Typically, Julysees the highest demand (peak season occupancy), while January experiences the lowest (low season). Effective strategies, like adjusting minimum stays or offering promotions, can boost occupancy during slower periods. Here's how different property tiers perform in Kahuku:
- Best-in-class properties (Top 10%) achieve 92%+ occupancy, indicating high desirability and potentially optimized availability.
- Strong performing properties (Top 25%) maintain 85% or higher occupancy, suggesting good market fit and guest satisfaction.
- Typical properties (Median) have an occupancy rate around 72%.
- Entry-level properties (Bottom 25%) average 52% occupancy, potentially facing higher vacancy.
Average Monthly Occupancy Rate Trend in Kahuku
Average Daily Rate (ADR) Airbnb Trends in Kahuku (2026)
Effective short term rental pricing strategy in Kahuku involves understanding monthly ADR fluctuations. The Average Daily Rate (ADR) for Airbnb in Kahuku typically peaks in December and dips lowest during April. Leveraging Airbnb dynamic pricing tools or strategies based on this seasonality can significantly boost revenue. Here's a look at the typical nightly rates achieved:
- Best-in-class properties (Top 10%) command rates of $1,353+ per night, often due to premium features or locations.
- Strong performing properties (Top 25%) achieve nightly rates of $696 or more.
- Typical properties (Median) charge around $484 per night.
- Entry-level properties (Bottom 25%) earn around $372 per night.
Average Daily Rate (ADR) Trend by Month in Kahuku
Get Live Kahuku Market Intelligence 👇

Explore Real-time Analytics
Airbnb Seasonality Analysis & Trends in Kahuku (2026)
Peak Season (July, June, March)
- Revenue averages $14,753 per month
- Occupancy rates average 72.1%
- Daily rates average $672
Shoulder Season
- Revenue averages $12,650 per month
- Occupancy maintains around 66.6%
- Daily rates hold near $649
Low Season (January, September, November)
- Revenue drops to average $10,918 per month
- Occupancy decreases to average 57.6%
- Daily rates adjust to average $661
Seasonality Insights for Kahuku
- The Airbnb seasonality in Kahuku shows moderate seasonality with distinct peak and low periods. While the sections above show seasonal averages, it's also insightful to look at the extremes:
- During the high season, the absolute peak month showcases Kahuku's highest earning potential, with monthly revenues capable of climbing to $15,375, occupancy reaching a high of 74.2%, and ADRs peaking at $740.
- Conversely, the slowest single month of the year, typically falling within the low season, marks the market's lowest point. In this month, revenue might dip to $10,840, occupancy could drop to 54.8%, and ADRs may adjust down to $618.
- Understanding both the seasonal averages and these monthly peaks and troughs in revenue, occupancy, and ADR is crucial for maximizing your Airbnb profit potential in Kahuku.
Seasonal Strategies for Maximizing Profit
- Peak Season: Maximize revenue through premium pricing and potentially longer minimum stays. Ensure high availability.
- Low Season: Offer competitive pricing, special promotions (e.g., extended stay discounts), and flexible cancellation policies. Target off-season travelers like remote workers or budget-conscious guests.
- Shoulder Seasons: Implement dynamic pricing that balances peak and low rates. Target weekend travelers or specific events. Offer slightly more flexible terms than peak season.
- Regularly analyze your own performance against these Kahuku seasonality benchmarks and adjust your pricing and availability strategy accordingly.
Best Areas for Airbnb Investment in Kahuku (2026)
Exploring the top neighborhoods for short-term rentals in Kahuku? This section highlights key areas, outlining why they are attractive for hosts and guests, along with notable local attractions. Consider these locations based on your target guest profile and investment strategy.
| Neighborhood / Area | Why Host Here? (Target Guests & Appeal) | Key Attractions & Landmarks |
|---|---|---|
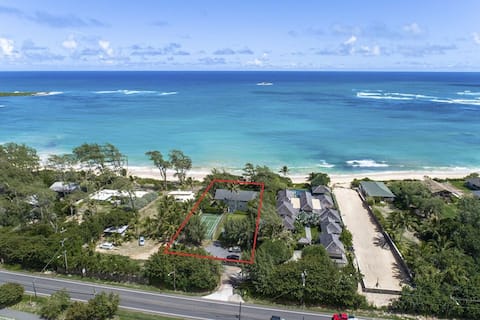
| Kahuku Shores | A beachfront community known for its stunning sunsets and proximity to local attractions. Ideal for families and travelers looking for a relaxing getaway near the ocean. | Kahuku Beach, Kahuku Point, Surfers Beach, Chun's Reef, Sunset Beach |
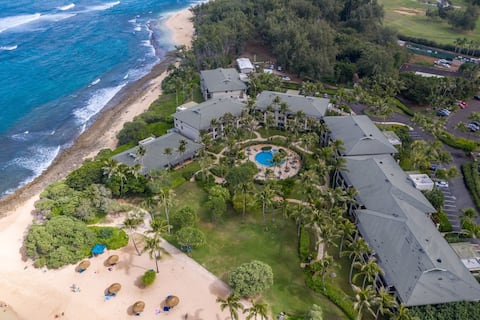
| Turtle Bay | Famous for the Turtle Bay Resort and beautiful beaches, this area attracts visitors seeking luxury and nature. Guests love the outdoor activities available, including hiking and water sports. | Turtle Bay Resort, Kawela Bay, Lockwood Beach, Turtle Bay Golf, Nature trails |
| Pipeline | Renowned for its legendary surf waves, this area draws surfers and beachgoers alike. A perfect spot for those wanting to experience the vibrant surf culture of Hawaii. | Pipeline Beach, Ehukai Beach Park, Sunset Beach, Waimea Bay, North Shore Surf Shops |
| Kahuku Village | A charming local community that offers a taste of authentic Hawaiian culture. Ideal for travelers looking for a more intimate experience away from touristy spots. | Kahuku Farms, Hukilau Marketplace, Cultural events, Food trucks, Nearby hiking trails |
| Laie | Close to the famous BYU Hawaii and the Polynesian Cultural Center, Laie attracts educational tourists and those interested in Polynesian culture. | Polynesian Cultural Center, Laie Point State Wayside, Brigham Young University, Laie Beach Park, Local shopping |
| Waialua | A quiet area known for its beautiful beaches and agricultural land, favored by families and those seeking peace and tranquility away from crowded areas. | Kawailoa Beach, Waialua Beach Park, Local farms, Historical sites, Water sports |
| Sunset Beach | Offering some of the best sunsets in the world, this area is perfect for visitors who appreciate stunning natural beauty and beach activities, especially surfing. | Sunset Beach Park, World surf competitions, Scenic viewpoints, Local eateries, Marine life |
| North Shore | Famous as a surfing hotspot, North Shore offers a unique lifestyle and is popular among nature lovers and outdoor enthusiasts year-round. | Haleiwa Town, Banzai Pipeline, Shark's Cove, North Shore Marketplace, Food trucks and shrimp trucks |
Understanding Airbnb License Requirements & STR Laws in Kahuku (2026)
Yes, Kahuku, Hawaii, United States enforces high STR regulations. Obtaining a license and ensuring compliance is almost certainly required according to current 2026 STR laws. Always verify the latest short term rental regulations and Airbnb license requirements directly with local government authorities for Kahuku to ensure full compliance before hosting.
(Source: AirROI data, 2026, based on 93% licensed listings)
Top Performing Airbnb Properties in Kahuku (2026)
Benchmark your potential! Explore examples of top-performing Airbnb properties in Kahukubased on Trailing Twelve Month (TTM) revenue. Analyze their characteristics, revenue, occupancy rate, and ADR to understand what drives success in this market.
Moani Kai - Beachfront,Gated,Hot tub,Pickleball Ct
Entire Place • 6 bedrooms
Massive North Shore 4BR Villa | Turtle Bay Beach!
Entire Place • 4 bedrooms

Luxury 4BR Largest Oceanfront Villa • Turtle Bay
Entire Place • 4 bedrooms
Holiday Sale! Turtle Bay Villas 205/206 by Gather
Entire Place • 4 bedrooms

Oceanfront 4BR for 10 • Luxury Resort+Beach+Pool
Entire Place • 4 bedrooms

Villa 106 Ocean View Turtle Bay
Entire Place • 3 bedrooms
Note: Performance varies based on location, size, amenities, seasonality, and management quality. Data reflects the past 12 months.
Top Performing Airbnb Hosts in Kahuku (2026)
Learn from the best! This table showcases top-performing Airbnb hosts in Kahuku based on the number of properties managed and estimated total revenue over the past year. Analyze their scale and performance metrics.
| Host Name | Properties | Grossing Revenue | Stay Reviews | Avg Rating |
|---|---|---|---|---|
| Gina (& Kim) | 21 | $4,877,089 | 669 | 4.92/5.0 |
| Gather Vacations | 16 | $3,579,407 | 526 | 4.84/5.0 |
| Helena | 16 | $2,547,854 | 1691 | 4.84/5.0 |
| Turtle Bay Condos And Realty | 13 | $1,423,891 | 561 | 4.76/5.0 |
| Aloha | 2 | $956,282 | 100 | 5.00/5.0 |
| Jacob | 3 | $801,343 | 183 | 4.73/5.0 |
| Royal Realty | 9 | $781,274 | 113 | 4.60/5.0 |
| Myra | 3 | $772,173 | 77 | 4.99/5.0 |
| K B M Resort Rentals Resorts | 2 | $687,238 | 30 | 4.63/5.0 |
| Hawaii Life Rentals | 5 | $598,162 | 189 | 4.86/5.0 |
Analyzing the strategies of top hosts, such as their property selection, pricing, and guest communication, can offer valuable lessons for optimizing your own Airbnb operations in Kahuku.
Dive Deeper: Advanced Kahuku STR Market Data (2026)
Ready to unlock more insights? AirROI provides access to advanced metrics and comprehensive Airbnb data for Kahuku. Explore detailed analytics beyond this report to refine your investment strategy, optimize pricing, and maximize your vacation rental profits.
Explore Advanced MetricsKahuku Short-Term Rental Market Composition (2026): Property & Room Types
Room Type Distribution
Property Type Distribution
Market Composition Insights for Kahuku
- The Kahuku Airbnb market composition is heavily skewed towards Entire Home/Apt listings, which make up 99.7% of the 287 active rentals. This indicates strong guest preference for privacy and space.
- Looking at the property type distribution in Kahuku, Apartment/Condo properties are the most common (71.8%), reflecting the local real estate landscape.
- Houses represent a significant 26.5% portion, catering likely to families or larger groups.
- Smaller segments like others, hotel/boutique, outdoor/unique (combined 1.6%) offer potential for unique stay experiences.
Kahuku Airbnb Room Capacity Analysis (2026): Bedroom Distribution
Distribution of Listings by Number of Bedrooms
Room Capacity Insights for Kahuku
- The dominant room capacity in Kahuku is 1 bedroom listings, making up 41.8% of the market. This suggests a strong demand for properties suitable for couples or solo travelers.
- Together, 1 bedroom and 2 bedrooms properties represent 67.9% of the active Airbnb listings in Kahuku, indicating a high concentration in these sizes.
- A significant 28.9% of listings offer 3+ bedrooms, catering to larger groups and families seeking more space in Kahuku.
Kahuku Vacation Rental Guest Capacity Trends (2026)
Distribution of Listings by Guest Capacity
Guest Capacity Insights for Kahuku
- The most common guest capacity trend in Kahuku vacation rentals is listings accommodating 4 guests (30%). This suggests the primary traveler segment is likely small families or groups.
- Properties designed for 4 guests and 6 guests dominate the Kahuku STR market, accounting for 57.5% of listings.
- 52.6% of properties accommodate 6+ guests, serving the market segment for larger families or group travel in Kahuku.
- On average, properties in Kahuku are equipped to host 5.3 guests.
Kahuku Airbnb Booking Patterns (2026): Available vs. Booked Days
Available Days Distribution
Booked Days Distribution
Booking Pattern Insights for Kahuku
- The most common availability pattern in Kahuku falls within the 91-180 days range, representing 42.5% of listings. This suggests many properties have significant open periods on their calendars.
- Approximately 29.6% of listings show high availability (181+ days open annually), indicating potential for increased bookings or specific owner usage patterns.
- For booked days, the 181-270 days range is most frequent in Kahuku (40.8%), reflecting common guest stay durations or potential owner blocking patterns.
- A notable 71.8% of properties secure long booking periods (181+ days booked per year), highlighting successful long-term rental strategies or significant owner usage.
Kahuku Airbnb Minimum Stay Requirements Analysis
Distribution of Listings by Minimum Night Requirement
1 Night
63 listings
22% of total
2 Nights
48 listings
16.7% of total
3 Nights
20 listings
7% of total
4-6 Nights
17 listings
5.9% of total
7-29 Nights
8 listings
2.8% of total
30+ Nights
131 listings
45.6% of total
Key Insights
- The most prevalent minimum stay requirement in Kahuku is 30+ Nights, adopted by 45.6% of listings. This highlights the market's preference for longer commitments.
- A significant segment (45.6%) caters to monthly stays (30+ nights) in Kahuku, pointing to opportunities in the extended-stay market.
Recommendations
- Align with the market by considering a 30+ Nights minimum stay, as 45.6% of Kahuku hosts use this setting.
- If feasible, allowing 1-night stays, especially midweek or during low season, could capture last-minute bookings, as only 22% currently do.
- Explore offering discounts for stays of 30+ nights to attract the 45.6% of the market seeking extended stays.
- Adjust minimum nights based on seasonality – potentially shorter during low season and longer during peak demand periods in Kahuku.
Kahuku Airbnb Cancellation Policy Trends Analysis (2026)
Limited
4 listings
1.4% of total
Super Strict 30 Days
49 listings
17.1% of total
Super Strict 60 Days
20 listings
7% of total
Flexible
4 listings
1.4% of total
Moderate
51 listings
17.8% of total
Firm
123 listings
42.9% of total
Strict
36 listings
12.5% of total
Cancellation Policy Insights for Kahuku
- The prevailing Airbnb cancellation policy trend in Kahuku is Firm, used by 42.9% of listings.
- A majority (55.4%) of hosts in Kahuku utilize Firm or Strict policies, indicating a market where hosts prioritize booking security.
Recommendations for Hosts
- Consider adopting a Firm policy to align with the 42.9% market standard in Kahuku.
- Using a Strict policy might deter some guests, as only 12.5% of listings use it. Evaluate if potential revenue protection outweighs possible lower booking rates.
- Regularly review your cancellation policy against competitors and market demand shifts in Kahuku.
Kahuku STR Booking Lead Time Analysis (2026)
Average Booking Lead Time by Month
Booking Lead Time Insights for Kahuku
- The overall average booking lead time for vacation rentals in Kahuku is 83 days.
- Guests book furthest in advance for stays during June (average 100 days), likely coinciding with peak travel demand or local events.
- The shortest booking windows occur for stays in February (average 77 days), indicating more last-minute travel plans during this time.
- Seasonally, Summer (93 days avg.) sees the longest lead times, while Spring (81 days avg.) has the shortest, reflecting typical travel planning cycles.
Recommendations for Hosts
- Use the overall average lead time (83 days) as a baseline for your pricing and availability strategy in Kahuku.
- For June stays, consider implementing length-of-stay discounts or slightly higher rates for bookings made less than 100 days out to capitalize on advance planning.
- Target marketing efforts for the Summer season well in advance (at least 93 days) to capture early planners.
- Monitor your own booking lead times against these Kahuku averages to identify opportunities for dynamic pricing adjustments.
Popular & Essential Airbnb Amenities in Kahuku (2026)
Amenity Prevalence
Amenity Insights for Kahuku
- Essential amenities in Kahuku that guests expect include: Wifi, TV, Washer, Air conditioning, Smoke alarm, Kitchen, Coffee maker, Refrigerator, Dryer. Lacking these (any) could significantly impact bookings.
- Popular amenities like Hair dryer are common but not universal. Offering these can provide a competitive edge.
Recommendations for Hosts
- Ensure your listing includes all essential amenities for Kahuku: Wifi, TV, Washer, Air conditioning, Smoke alarm, Kitchen, Coffee maker, Refrigerator, Dryer.
- Prioritize adding missing essentials: Wifi, TV, Washer, Air conditioning, Smoke alarm, Kitchen, Coffee maker, Refrigerator, Dryer.
- Consider adding popular differentiators like Hair dryer to increase appeal.
- Highlight unique or less common amenities you offer (e.g., hot tub, dedicated workspace, EV charger) in your listing description and photos.
- Regularly check competitor amenities in Kahuku to stay competitive.
Kahuku Airbnb Guest Demographics & Profile Analysis (2026)
Guest Profile Summary for Kahuku
- The typical guest profile for Airbnb in Kahuku consists of primarily domestic travelers (89%), often arriving from nearby Los Angeles, typically belonging to the Post-2000s (Gen Z/Alpha) group (50%), primarily speaking English or Spanish.
- Domestic travelers account for 88.6% of guests.
- Key international markets include United States (88.6%) and Canada (3.3%).
- Top languages spoken are English (67.3%) followed by Spanish (12.6%).
- A significant demographic segment is the Post-2000s (Gen Z/Alpha) group, representing 50% of guests.
Recommendations for Hosts
- Target domestic marketing efforts towards travelers from Los Angeles and Honolulu.
- Tailor amenities and listing descriptions to appeal to the dominant Post-2000s (Gen Z/Alpha) demographic (e.g., highlight fast WiFi, smart home features, local guides).
- Highlight unique local experiences or amenities relevant to the primary guest profile.
- Consider seasonal promotions aligned with peak travel times for key origin markets.
Nearby Short-Term Rental Market Comparison
How does the Kahuku Airbnb market stack up against its neighbors? Compare key performance metrics like average monthly revenue, ADR, and occupancy rates in surrounding areas to understand the broader regional STR landscape.
| Market | Active Properties | Monthly Revenue | Daily Rate | Avg. Occupancy |
|---|---|---|---|---|
| Mākaha Valley | 96 | $13,116 | $669.71 | 70% |
| Kula | 11 | $9,130 | $383.13 | 79% |
| Makawao | 19 | $7,315 | $437.12 | 67% |
| Kapalua | 297 | $7,140 | $741.15 | 42% |
| Paia | 88 | $6,942 | $546.66 | 49% |
| Wailea-Makena | 11 | $6,581 | $787.33 | 46% |
| Kapolei | 520 | $6,393 | $688.27 | 44% |
| Kaanapali | 1,624 | $6,028 | $838.76 | 38% |
| Haiku | 51 | $5,900 | $448.08 | 49% |
| Maalaea | 17 | $5,618 | $413.90 | 49% |