Honolulu Airbnb Market Analysis 2026: Short Term Rental Data & Vacation Rental Statistics in Hawaii, United States
Is Airbnb profitable in Honolulu in 2026? Explore comprehensive Airbnb analytics for Honolulu, Hawaii, United States to uncover income potential. This 2026 STR market report for Honolulu, based on AirROI data from February 2025 to January 2026, reveals key trends in the bustling market of 5,518 active listings.
Whether you're considering an Airbnb investment in Honolulu, optimizing your existing vacation rental, or exploring rental arbitrage opportunities, understanding the Honolulu Airbnb data is crucial. Navigating the high regulation landscape is key to maximizing your short term rental income potential. Let's dive into the specifics.
Key Honolulu Airbnb Performance Metrics Overview
Monthly Airbnb Revenue Variations & Income Potential in Honolulu (2026)
Understanding the monthly revenue variations for Airbnb listings in Honolulu is key to maximizing your short term rental income potential. Seasonality significantly impacts earnings. Our analysis, based on data from the past 12 months, shows that the peak revenue month for STRs in Honolulu is typically July, while January often presents the lowest earnings, highlighting opportunities for strategic pricing adjustments during shoulder and low seasons. Explore the typical Airbnb income in Honolulu across different performance tiers:
- Best-in-class properties (Top 10%) achieve $9,003+ monthly, often utilizing dynamic pricing and superior guest experiences.
- Strong performing properties (Top 25%) earn $6,300 or more, indicating effective management and desirable locations/amenities.
- Typical properties (Median) generate around $4,122 per month, representing the average market performance.
- Entry-level properties (Bottom 25%) see earnings around $2,352, often with potential for optimization.
Average Monthly Airbnb Earnings Trend in Honolulu
Honolulu Airbnb Occupancy Rate Trends (2026)
Maximize your bookings by understanding the Honolulu STR occupancy trends. Seasonal demand shifts significantly influence how often properties are booked. Typically, Februarysees the highest demand (peak season occupancy), while January experiences the lowest (low season). Effective strategies, like adjusting minimum stays or offering promotions, can boost occupancy during slower periods. Here's how different property tiers perform in Honolulu:
- Best-in-class properties (Top 10%) achieve 93%+ occupancy, indicating high desirability and potentially optimized availability.
- Strong performing properties (Top 25%) maintain 85% or higher occupancy, suggesting good market fit and guest satisfaction.
- Typical properties (Median) have an occupancy rate around 70%.
- Entry-level properties (Bottom 25%) average 39% occupancy, potentially facing higher vacancy.
Average Monthly Occupancy Rate Trend in Honolulu
Average Daily Rate (ADR) Airbnb Trends in Honolulu (2026)
Effective short term rental pricing strategy in Honolulu involves understanding monthly ADR fluctuations. The Average Daily Rate (ADR) for Airbnb in Honolulu typically peaks in December and dips lowest during April. Leveraging Airbnb dynamic pricing tools or strategies based on this seasonality can significantly boost revenue. Here's a look at the typical nightly rates achieved:
- Best-in-class properties (Top 10%) command rates of $439+ per night, often due to premium features or locations.
- Strong performing properties (Top 25%) achieve nightly rates of $299 or more.
- Typical properties (Median) charge around $213 per night.
- Entry-level properties (Bottom 25%) earn around $153 per night.
Average Daily Rate (ADR) Trend by Month in Honolulu
Get Live Honolulu Market Intelligence 👇

Explore Real-time Analytics
Airbnb Seasonality Analysis & Trends in Honolulu (2026)
Peak Season (July, December, August)
- Revenue averages $5,433 per month
- Occupancy rates average 62.9%
- Daily rates average $271
Shoulder Season
- Revenue averages $4,808 per month
- Occupancy maintains around 61.8%
- Daily rates hold near $260
Low Season (January, April, May)
- Revenue drops to average $4,489 per month
- Occupancy decreases to average 58.0%
- Daily rates adjust to average $258
Seasonality Insights for Honolulu
- The Airbnb seasonality in Honolulu shows relatively stable year-round demand. While the sections above show seasonal averages, it's also insightful to look at the extremes:
- During the high season, the absolute peak month showcases Honolulu's highest earning potential, with monthly revenues capable of climbing to $5,572, occupancy reaching a high of 70.1%, and ADRs peaking at $293.
- Conversely, the slowest single month of the year, typically falling within the low season, marks the market's lowest point. In this month, revenue might dip to $4,417, occupancy could drop to 50.2%, and ADRs may adjust down to $241.
- Understanding both the seasonal averages and these monthly peaks and troughs in revenue, occupancy, and ADR is crucial for maximizing your Airbnb profit potential in Honolulu.
Seasonal Strategies for Maximizing Profit
- Peak Season: Maximize revenue through premium pricing and potentially longer minimum stays. Ensure high availability.
- Low Season: Offer competitive pricing, special promotions (e.g., extended stay discounts), and flexible cancellation policies. Target off-season travelers like remote workers or budget-conscious guests.
- Shoulder Seasons: Implement dynamic pricing that balances peak and low rates. Target weekend travelers or specific events. Offer slightly more flexible terms than peak season.
- Regularly analyze your own performance against these Honolulu seasonality benchmarks and adjust your pricing and availability strategy accordingly.
Best Areas for Airbnb Investment in Honolulu (2026)
Exploring the top neighborhoods for short-term rentals in Honolulu? This section highlights key areas, outlining why they are attractive for hosts and guests, along with notable local attractions. Consider these locations based on your target guest profile and investment strategy.
| Neighborhood / Area | Why Host Here? (Target Guests & Appeal) | Key Attractions & Landmarks |
|---|---|---|
| Waikiki | Famous world-renowned beach destination with a vibrant atmosphere, luxury shopping, and numerous dining options. A prime location for tourists looking for sun, sand, and surf. | Waikiki Beach, Diamond Head, Waikiki Aquarium, International Market Place, Kuhio Beach Park, Honolulu Zoo |
| Kailua | Charming beach town known for its beautiful beaches and laid-back vibe. Popular with families and those seeking outdoor activities like kayaking and hiking. | Kailua Beach, Lanikai Beach, Lanikai Pillbox Hike, Kailua Town, Kamakana Playground |
| North Shore | Famous for its big waves and surf culture, attracting surfers and beachgoers from around the world. Offers a more relaxed and picturesque experience away from the city. | Waimea Bay, Sunset Beach, Haleiwa Town, Sharks Cove, Ehukai Beach Park |
| Haleiwa | Historic town on the North Shore with a charming surf town vibe, appealing to travelers looking for local culture and arts. | Haleiwa Beach Park, Sharks Cove, Ali'i Beach Park, Matsumoto Shave Ice, Haleiwa Shopping Center |
| Manoa | Close to nature and home to beautiful hiking trails, including the famous Manoa Falls Trail. Attracts nature lovers and hikers. | Manoa Falls, University of Hawaii at Manoa, Waikiki Shell, Honolulu Museum of Art, Tantalus Lookout |
| Downtown Honolulu | The cultural and historical center of Honolulu, offering a blend of historic sites, government buildings, and modern amenities, appealing to business travelers and those interested in history. | Iolani Palace, Bishop Museum, Aloha Tower, Chinatown, Punchbowl Crater |
| Kaka'ako | Trendy neighborhood known for its street art, local markets, and craft breweries. Popular among young travelers seeking a vibrant scene. | Kaka'ako Park, Salt at Our Kaka'ako, Street art murals, On1 Marketplace, Hawaiian Aroma Caffe |
| Mililani | Suburban community providing a quieter, family-friendly atmosphere while still offering access to local attractions and outdoor activities, appealing to longer-term visitors. | Mililani Town Center, Schofield Barracks, Dole Plantation, Wahiawa Botanical Garden, Kuaokala Trail |
Understanding Airbnb License Requirements & STR Laws in Honolulu (2026)
Yes, Honolulu, Hawaii, United States enforces high STR regulations. Obtaining a license and ensuring compliance is almost certainly required according to current 2026 STR laws. Always verify the latest short term rental regulations and Airbnb license requirements directly with local government authorities for Honolulu to ensure full compliance before hosting.
(Source: AirROI data, 2026, based on 86% licensed listings)
Top Performing Airbnb Properties in Honolulu (2026)
Benchmark your potential! Explore examples of top-performing Airbnb properties in Honolulubased on Trailing Twelve Month (TTM) revenue. Analyze their characteristics, revenue, occupancy rate, and ADR to understand what drives success in this market.
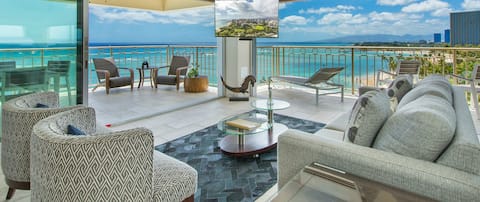
A View to Die for! 3bedroom 3bath on Waikiki Beach
Entire Place • 3 bedrooms
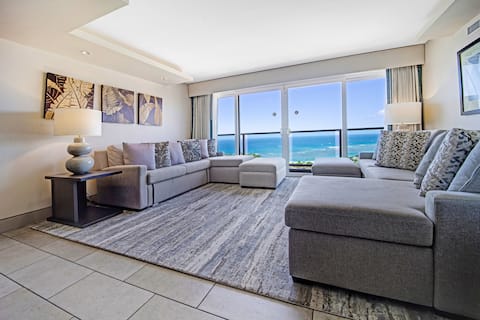
Ala Moana Hotelcondo 3307 Presidential Suite 4/4
Entire Place • 4 bedrooms
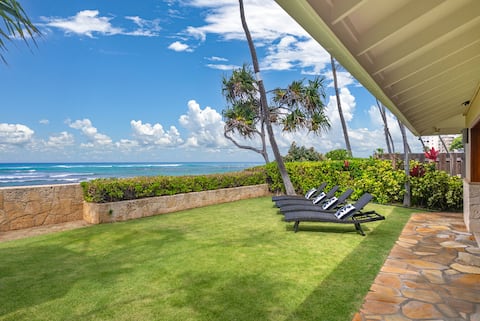
Hale Makai at Diamond Head: Stunning Oceanfront
Entire Place • 3 bedrooms
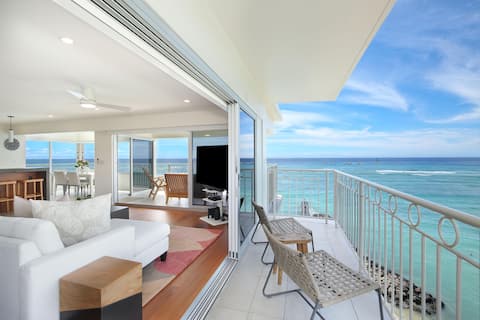
LUXURY DIRECT OCEANFRONT! Renovated 2021! WS700
Entire Place • 2 bedrooms

* South Shore 35 - Beach Front w/Hot Tub Honolulu
Entire Place • 4 bedrooms

Two 2BR Condos @ Hilton Lagoon Tower
Entire Place • 4 bedrooms
Note: Performance varies based on location, size, amenities, seasonality, and management quality. Data reflects the past 12 months.
Top Performing Airbnb Hosts in Honolulu (2026)
Learn from the best! This table showcases top-performing Airbnb hosts in Honolulu based on the number of properties managed and estimated total revenue over the past year. Analyze their scale and performance metrics.
| Host Name | Properties | Grossing Revenue | Stay Reviews | Avg Rating |
|---|---|---|---|---|
| Jayden | VYBE Hawaii | 148 | $11,787,074 | 10510 | 4.91/5.0 |
| Captain Cook Resorts | 175 | $10,659,854 | 4431 | 4.76/5.0 |
| Mark | 228 | $8,827,384 | 12946 | 4.61/5.0 |
| Midway Vacations | 109 | $7,882,190 | 5963 | 4.83/5.0 |
| Aloha By Charlie | 133 | $7,202,648 | 8276 | 4.85/5.0 |
| Nick & DeAnna | 59 | $4,521,820 | 4651 | 4.72/5.0 |
| Ali’i Beach Rentals | 97 | $3,866,732 | 2830 | 4.66/5.0 |
| Mark | 79 | $3,629,992 | 2594 | 4.61/5.0 |
| Weili | 22 | $2,680,985 | 1770 | 4.92/5.0 |
| Jong | 37 | $2,394,377 | 2888 | 4.67/5.0 |
Analyzing the strategies of top hosts, such as their property selection, pricing, and guest communication, can offer valuable lessons for optimizing your own Airbnb operations in Honolulu.
Dive Deeper: Advanced Honolulu STR Market Data (2026)
Ready to unlock more insights? AirROI provides access to advanced metrics and comprehensive Airbnb data for Honolulu. Explore detailed analytics beyond this report to refine your investment strategy, optimize pricing, and maximize your vacation rental profits.
Explore Advanced MetricsHonolulu Short-Term Rental Market Composition (2026): Property & Room Types
Room Type Distribution
Property Type Distribution
Market Composition Insights for Honolulu
- The Honolulu Airbnb market composition is heavily skewed towards Entire Home/Apt listings, which make up 91.3% of the 5,518 active rentals. This indicates strong guest preference for privacy and space.
- Looking at the property type distribution in Honolulu, Apartment/Condo properties are the most common (89.3%), reflecting the local real estate landscape.
- The presence of 5.5% Hotel/Boutique listings indicates integration with traditional hospitality.
- Smaller segments like house, others (combined 5.2%) offer potential for unique stay experiences.
Honolulu Airbnb Room Capacity Analysis (2026): Bedroom Distribution
Distribution of Listings by Number of Bedrooms
Room Capacity Insights for Honolulu
- The dominant room capacity in Honolulu is 1 bedroom listings, making up 49.8% of the market. This suggests a strong demand for properties suitable for couples or solo travelers.
- Together, 1 bedroom and 2 bedrooms properties represent 64.4% of the active Airbnb listings in Honolulu, indicating a high concentration in these sizes.
- Listings with 3+ bedrooms (3.9%) represent a smaller niche, potentially indicating an underserved market for larger group accommodations in Honolulu.
Honolulu Vacation Rental Guest Capacity Trends (2026)
Distribution of Listings by Guest Capacity
Guest Capacity Insights for Honolulu
- The most common guest capacity trend in Honolulu vacation rentals is listings accommodating 4 guests (36.8%). This suggests the primary traveler segment is likely small families or groups.
- Properties designed for 4 guests and 2 guests dominate the Honolulu STR market, accounting for 63.1% of listings.
- 17.1% of properties accommodate 6+ guests, serving the market segment for larger families or group travel in Honolulu.
- On average, properties in Honolulu are equipped to host 3.7 guests.
Honolulu Airbnb Booking Patterns (2026): Available vs. Booked Days
Available Days Distribution
Booked Days Distribution
Booking Pattern Insights for Honolulu
- The most common availability pattern in Honolulu falls within the 271-366 days range, representing 31.2% of listings. This suggests many properties have significant open periods on their calendars.
- Approximately 52.3% of listings show high availability (181+ days open annually), indicating potential for increased bookings or specific owner usage patterns.
- For booked days, the 181-270 days range is most frequent in Honolulu (24.5%), reflecting common guest stay durations or potential owner blocking patterns.
- A notable 48.7% of properties secure long booking periods (181+ days booked per year), highlighting successful long-term rental strategies or significant owner usage.
Honolulu Airbnb Minimum Stay Requirements Analysis
Distribution of Listings by Minimum Night Requirement
1 Night
1794 listings
32.5% of total
2 Nights
847 listings
15.4% of total
3 Nights
360 listings
6.5% of total
4-6 Nights
149 listings
2.7% of total
7-29 Nights
396 listings
7.2% of total
30+ Nights
1970 listings
35.7% of total
Key Insights
- The most prevalent minimum stay requirement in Honolulu is 30+ Nights, adopted by 35.7% of listings. This highlights the market's preference for longer commitments.
- A significant segment (35.7%) caters to monthly stays (30+ nights) in Honolulu, pointing to opportunities in the extended-stay market.
Recommendations
- Align with the market by considering a 30+ Nights minimum stay, as 35.7% of Honolulu hosts use this setting.
- Explore offering discounts for stays of 30+ nights to attract the 35.7% of the market seeking extended stays.
- Adjust minimum nights based on seasonality – potentially shorter during low season and longer during peak demand periods in Honolulu.
Honolulu Airbnb Cancellation Policy Trends Analysis (2026)
Super Strict 30 Days
269 listings
4.9% of total
Non-refundable
5 listings
0.1% of total
Super Strict 60 Days
281 listings
5.1% of total
Limited
56 listings
1% of total
Refundable
3 listings
0.1% of total
Flexible
299 listings
5.5% of total
Moderate
1104 listings
20.1% of total
Firm
2088 listings
38.1% of total
Strict
1378 listings
25.1% of total
Cancellation Policy Insights for Honolulu
- The prevailing Airbnb cancellation policy trend in Honolulu is Firm, used by 38.1% of listings.
- A majority (63.2%) of hosts in Honolulu utilize Firm or Strict policies, indicating a market where hosts prioritize booking security.
Recommendations for Hosts
- Consider adopting a Firm policy to align with the 38.1% market standard in Honolulu.
- Regularly review your cancellation policy against competitors and market demand shifts in Honolulu.
Honolulu STR Booking Lead Time Analysis (2026)
Average Booking Lead Time by Month
Booking Lead Time Insights for Honolulu
- The overall average booking lead time for vacation rentals in Honolulu is 61 days.
- Guests book furthest in advance for stays during December (average 82 days), likely coinciding with peak travel demand or local events.
- The shortest booking windows occur for stays in March (average 55 days), indicating more last-minute travel plans during this time.
- Seasonally, Winter (68 days avg.) sees the longest lead times, while Spring (56 days avg.) has the shortest, reflecting typical travel planning cycles.
Recommendations for Hosts
- Use the overall average lead time (61 days) as a baseline for your pricing and availability strategy in Honolulu.
- For December stays, consider implementing length-of-stay discounts or slightly higher rates for bookings made less than 82 days out to capitalize on advance planning.
- Target marketing efforts for the Winter season well in advance (at least 68 days) to capture early planners.
- Monitor your own booking lead times against these Honolulu averages to identify opportunities for dynamic pricing adjustments.
Popular & Essential Airbnb Amenities in Honolulu (2026)
Amenity Prevalence
Amenity Insights for Honolulu
- Essential amenities in Honolulu that guests expect include: Wifi, TV, Air conditioning. Lacking these (any) could significantly impact bookings.
- Popular amenities like Smoke alarm, Hair dryer, Microwave are common but not universal. Offering these can provide a competitive edge.
Recommendations for Hosts
- Ensure your listing includes all essential amenities for Honolulu: Wifi, TV, Air conditioning.
- Prioritize adding missing essentials: Wifi, TV, Air conditioning.
- Consider adding popular differentiators like Smoke alarm or Hair dryer to increase appeal.
- Highlight unique or less common amenities you offer (e.g., hot tub, dedicated workspace, EV charger) in your listing description and photos.
- Regularly check competitor amenities in Honolulu to stay competitive.
Honolulu Airbnb Guest Demographics & Profile Analysis (2026)
Guest Profile Summary for Honolulu
- The typical guest profile for Airbnb in Honolulu consists of primarily domestic travelers (80%), often arriving from nearby Los Angeles, typically belonging to the Post-2000s (Gen Z/Alpha) group (50%), primarily speaking English or Spanish.
- Domestic travelers account for 79.5% of guests.
- Key international markets include United States (79.5%) and Canada (6.3%).
- Top languages spoken are English (60.2%) followed by Spanish (12.8%).
- A significant demographic segment is the Post-2000s (Gen Z/Alpha) group, representing 50% of guests.
Recommendations for Hosts
- Target domestic marketing efforts towards travelers from Los Angeles and San Francisco.
- Tailor amenities and listing descriptions to appeal to the dominant Post-2000s (Gen Z/Alpha) demographic (e.g., highlight fast WiFi, smart home features, local guides).
- Highlight unique local experiences or amenities relevant to the primary guest profile.
- Consider seasonal promotions aligned with peak travel times for key origin markets.
Nearby Short-Term Rental Market Comparison
How does the Honolulu Airbnb market stack up against its neighbors? Compare key performance metrics like average monthly revenue, ADR, and occupancy rates in surrounding areas to understand the broader regional STR landscape.
| Market | Active Properties | Monthly Revenue | Daily Rate | Avg. Occupancy |
|---|---|---|---|---|
| Mākaha Valley | 96 | $13,116 | $669.71 | 70% |
| Kahuku | 287 | $11,358 | $679.39 | 64% |
| Kula | 11 | $9,130 | $383.13 | 79% |
| Makawao | 19 | $7,315 | $437.12 | 67% |
| Kapalua | 297 | $7,140 | $741.15 | 42% |
| Paia | 88 | $6,942 | $546.66 | 49% |
| Wailea-Makena | 11 | $6,581 | $787.33 | 46% |
| Kapolei | 520 | $6,393 | $688.27 | 44% |
| Kaanapali | 1,624 | $6,028 | $838.76 | 38% |
| Haiku | 51 | $5,900 | $448.08 | 49% |