Hawaiian Paradise Park Airbnb Market Analysis 2026: Short Term Rental Data & Vacation Rental Statistics in Hawaii, United States
Is Airbnb profitable in Hawaiian Paradise Park in 2026? Explore comprehensive Airbnb analytics for Hawaiian Paradise Park, Hawaii, United States to uncover income potential. This 2026 STR market report for Hawaiian Paradise Park, based on AirROI data from February 2025 to January 2026, reveals key trends in the niche market of 117 active listings.
Whether you're considering an Airbnb investment in Hawaiian Paradise Park, optimizing your existing vacation rental, or exploring rental arbitrage opportunities, understanding the Hawaiian Paradise Park Airbnb data is crucial. Navigating the high regulation landscape is key to maximizing your short term rental income potential. Let's dive into the specifics.
Key Hawaiian Paradise Park Airbnb Performance Metrics Overview
Monthly Airbnb Revenue Variations & Income Potential in Hawaiian Paradise Park (2026)
Understanding the monthly revenue variations for Airbnb listings in Hawaiian Paradise Park is key to maximizing your short term rental income potential. Seasonality significantly impacts earnings. Our analysis, based on data from the past 12 months, shows that the peak revenue month for STRs in Hawaiian Paradise Park is typically December, while September often presents the lowest earnings, highlighting opportunities for strategic pricing adjustments during shoulder and low seasons. Explore the typical Airbnb income in Hawaiian Paradise Park across different performance tiers:
- Best-in-class properties (Top 10%) achieve $6,041+ monthly, often utilizing dynamic pricing and superior guest experiences.
- Strong performing properties (Top 25%) earn $4,189 or more, indicating effective management and desirable locations/amenities.
- Typical properties (Median) generate around $2,692 per month, representing the average market performance.
- Entry-level properties (Bottom 25%) see earnings around $1,565, often with potential for optimization.
Average Monthly Airbnb Earnings Trend in Hawaiian Paradise Park
Hawaiian Paradise Park Airbnb Occupancy Rate Trends (2026)
Maximize your bookings by understanding the Hawaiian Paradise Park STR occupancy trends. Seasonal demand shifts significantly influence how often properties are booked. Typically, Februarysees the highest demand (peak season occupancy), while September experiences the lowest (low season). Effective strategies, like adjusting minimum stays or offering promotions, can boost occupancy during slower periods. Here's how different property tiers perform in Hawaiian Paradise Park:
- Best-in-class properties (Top 10%) achieve 89%+ occupancy, indicating high desirability and potentially optimized availability.
- Strong performing properties (Top 25%) maintain 80% or higher occupancy, suggesting good market fit and guest satisfaction.
- Typical properties (Median) have an occupancy rate around 61%.
- Entry-level properties (Bottom 25%) average 37% occupancy, potentially facing higher vacancy.
Average Monthly Occupancy Rate Trend in Hawaiian Paradise Park
Average Daily Rate (ADR) Airbnb Trends in Hawaiian Paradise Park (2026)
Effective short term rental pricing strategy in Hawaiian Paradise Park involves understanding monthly ADR fluctuations. The Average Daily Rate (ADR) for Airbnb in Hawaiian Paradise Park typically peaks in January and dips lowest during April. Leveraging Airbnb dynamic pricing tools or strategies based on this seasonality can significantly boost revenue. Here's a look at the typical nightly rates achieved:
- Best-in-class properties (Top 10%) command rates of $298+ per night, often due to premium features or locations.
- Strong performing properties (Top 25%) achieve nightly rates of $217 or more.
- Typical properties (Median) charge around $155 per night.
- Entry-level properties (Bottom 25%) earn around $110 per night.
Average Daily Rate (ADR) Trend by Month in Hawaiian Paradise Park
Get Live Hawaiian Paradise Park Market Intelligence 👇

Explore Real-time Analytics
Airbnb Seasonality Analysis & Trends in Hawaiian Paradise Park (2026)
Peak Season (December, March, February)
- Revenue averages $3,499 per month
- Occupancy rates average 62.7%
- Daily rates average $174
Shoulder Season
- Revenue averages $3,111 per month
- Occupancy maintains around 56.6%
- Daily rates hold near $175
Low Season (August, September, October)
- Revenue drops to average $2,819 per month
- Occupancy decreases to average 52.9%
- Daily rates adjust to average $180
Seasonality Insights for Hawaiian Paradise Park
- The Airbnb seasonality in Hawaiian Paradise Park shows relatively stable year-round demand. While the sections above show seasonal averages, it's also insightful to look at the extremes:
- During the high season, the absolute peak month showcases Hawaiian Paradise Park's highest earning potential, with monthly revenues capable of climbing to $3,522, occupancy reaching a high of 69.8%, and ADRs peaking at $196.
- Conversely, the slowest single month of the year, typically falling within the low season, marks the market's lowest point. In this month, revenue might dip to $2,727, occupancy could drop to 52.0%, and ADRs may adjust down to $160.
- Understanding both the seasonal averages and these monthly peaks and troughs in revenue, occupancy, and ADR is crucial for maximizing your Airbnb profit potential in Hawaiian Paradise Park.
Seasonal Strategies for Maximizing Profit
- Peak Season: Maximize revenue through premium pricing and potentially longer minimum stays. Ensure high availability.
- Low Season: Offer competitive pricing, special promotions (e.g., extended stay discounts), and flexible cancellation policies. Target off-season travelers like remote workers or budget-conscious guests.
- Shoulder Seasons: Implement dynamic pricing that balances peak and low rates. Target weekend travelers or specific events. Offer slightly more flexible terms than peak season.
- Regularly analyze your own performance against these Hawaiian Paradise Park seasonality benchmarks and adjust your pricing and availability strategy accordingly.
Best Areas for Airbnb Investment in Hawaiian Paradise Park (2026)
Exploring the top neighborhoods for short-term rentals in Hawaiian Paradise Park? This section highlights key areas, outlining why they are attractive for hosts and guests, along with notable local attractions. Consider these locations based on your target guest profile and investment strategy.
| Neighborhood / Area | Why Host Here? (Target Guests & Appeal) | Key Attractions & Landmarks |
|---|---|---|
| Hawaiian Beaches | A beachfront community that offers stunning ocean views and easy access to the beach. Popular with tourists for swimming, surfing, and relaxation, making it attractive for short-term rental investments. | Hawaiian Beaches Park, Punalu'u Black Sand Beach, Kalapana Lava Viewing Area, Lava Tree State Monument |
| Keaau | A small town close to Hilo, Keaau offers a blend of local charm and proximity to amenities and attractions. It's a quieter area that's gaining popularity among Airbnb hosts looking for a peaceful retreat. | Keaau Village, Hilo Tropical Botanical Garden, Hawaii Volcanoes National Park, Panaewa Rainforest Zoo |
| Hilo | The largest town on the island of Hawaii, Hilo features a mix of culture, history, and stunning natural scenery. It's a popular location for tourists exploring the east side of the Big Island. | Rainbow Falls, Liliuokalani Gardens, Pacific Tsunami Museum, Hilo Farmers Market |
| Pahoa | Known for its bohemian vibe and proximity to volcanic activity, Pahoa attracts visitors looking for unique experiences. It's a growing area for Airbnb listings aiming to capture the adventurous spirit of tourists. | Pahoa Village Park, Kaimu Black Sand Beach, Lava Tree State Monument, Ahalanui Park, Kapoho Tide Pools |
| Volcano Village | Located near Hawaii Volcanoes National Park, this small village is perfect for tourists wanting to explore the park. It's a quiet, picturesque area ideal for nature lovers and hikers. | Hawaii Volcanoes National Park, Thomas A. Jaggar Museum, Punalu'u Black Sand Beach, Volcano Art Center |
| Waikoloa Village | This upscale resort area offers a range of golfing, shopping, and dining experiences. It's attractive for visitors seeking a more luxurious stay on the Big Island. | Waikoloa Beach Resort, Anaeho'omalu Bay, Kings Shops, Waikoloa Village Golf Club |
| Captain Cook | Situated on the west side of the Big Island, Captain Cook is known for its coffee plantations and beautiful ocean views. It's a quieter area that appeals to guests looking for a more tranquil stay. | Pu'uhonua o Honaunau National Historical Park, Green Sand Beach, Coffee farms, Kealakekua Bay |
| North Kona | Famous for its stunning beaches, snorkeling spots, and vibrant nightlife. North Kona attracts tourists looking for a mix of adventure and relaxation, making it ideal for Airbnb options. | Kona Coffee Living History Farm, Honuʻea Beach, Magic Sands Beach, Kona Brewing Company |
Understanding Airbnb License Requirements & STR Laws in Hawaiian Paradise Park (2026)
Yes, Hawaiian Paradise Park, Hawaii, United States enforces high STR regulations. Obtaining a license and ensuring compliance is almost certainly required according to current 2026 STR laws. Always verify the latest short term rental regulations and Airbnb license requirements directly with local government authorities for Hawaiian Paradise Park to ensure full compliance before hosting.
(Source: AirROI data, 2026, based on 33% licensed listings)
Top Performing Airbnb Properties in Hawaiian Paradise Park (2026)
Benchmark your potential! Explore examples of top-performing Airbnb properties in Hawaiian Paradise Parkbased on Trailing Twelve Month (TTM) revenue. Analyze their characteristics, revenue, occupancy rate, and ADR to understand what drives success in this market.
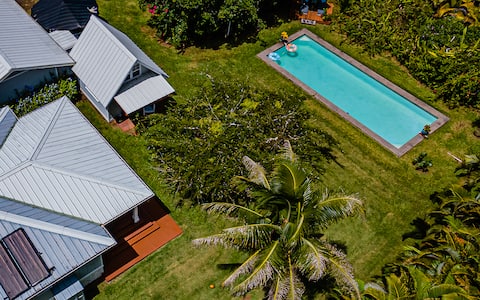
Jungle Estate 2 Acres, 3 Cottages + Pool Sleeps 9
Entire Place • 3 bedrooms
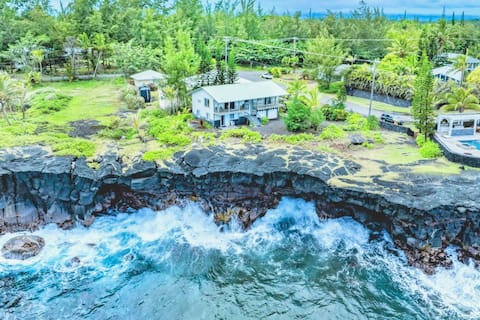
Mele Kohola "Song Of The Whales"
Entire Place • 4 bedrooms
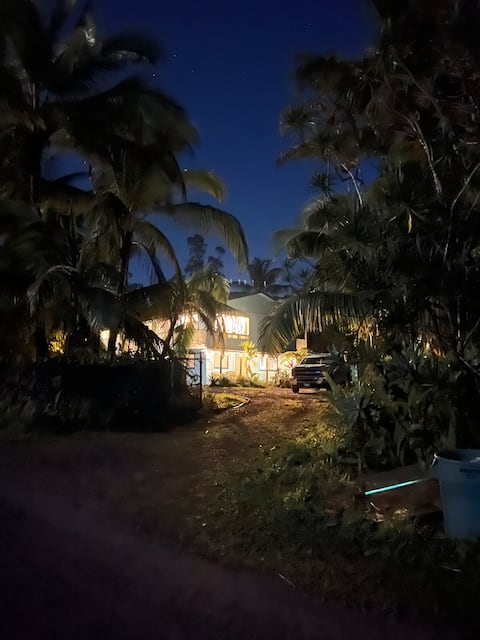
Jungle House w/Game Rooms Sleeps 17 "Whole Home"
Entire Place • 4 bedrooms

Big Island "Whole House" 5BR/2BA - sleeps 16
Entire Place • 5 bedrooms

BRAND NEW 3 Bed 2 Bath w/Studio
Entire Place • 4 bedrooms

Peaceful Petfriendly Paradise Home | with A/C
Entire Place • 4 bedrooms
Note: Performance varies based on location, size, amenities, seasonality, and management quality. Data reflects the past 12 months.
Top Performing Airbnb Hosts in Hawaiian Paradise Park (2026)
Learn from the best! This table showcases top-performing Airbnb hosts in Hawaiian Paradise Park based on the number of properties managed and estimated total revenue over the past year. Analyze their scale and performance metrics.
| Host Name | Properties | Grossing Revenue | Stay Reviews | Avg Rating |
|---|---|---|---|---|
| Mele | 5 | $201,188 | 310 | 4.83/5.0 |
| Levi | 4 | $176,843 | 677 | 4.89/5.0 |
| Jessica | 2 | $141,127 | 36 | 4.91/5.0 |
| Laura And Aki | 3 | $106,358 | 213 | 4.96/5.0 |
| Joy | 2 | $93,634 | 29 | 4.61/5.0 |
| Hawaii Life Rentals | 4 | $93,052 | 98 | 4.62/5.0 |
| Kendi | 1 | $92,965 | 46 | 4.93/5.0 |
| Evolve | 4 | $87,938 | 58 | 4.74/5.0 |
| Hale Hialoa | 3 | $84,554 | 200 | 4.84/5.0 |
| Gina | 2 | $79,658 | 159 | 4.89/5.0 |
Analyzing the strategies of top hosts, such as their property selection, pricing, and guest communication, can offer valuable lessons for optimizing your own Airbnb operations in Hawaiian Paradise Park.
Dive Deeper: Advanced Hawaiian Paradise Park STR Market Data (2026)
Ready to unlock more insights? AirROI provides access to advanced metrics and comprehensive Airbnb data for Hawaiian Paradise Park. Explore detailed analytics beyond this report to refine your investment strategy, optimize pricing, and maximize your vacation rental profits.
Explore Advanced MetricsHawaiian Paradise Park Short-Term Rental Market Composition (2026): Property & Room Types
Room Type Distribution
Property Type Distribution
Market Composition Insights for Hawaiian Paradise Park
- The Hawaiian Paradise Park Airbnb market composition is heavily skewed towards Entire Home/Apt listings, which make up 90.6% of the 117 active rentals. This indicates strong guest preference for privacy and space.
- Looking at the property type distribution in Hawaiian Paradise Park, House properties are the most common (68.4%), reflecting the local real estate landscape.
- Houses represent a significant 68.4% portion, catering likely to families or larger groups.
- The presence of 10.3% Hotel/Boutique listings indicates integration with traditional hospitality.
- Smaller segments like outdoor/unique (combined 2.6%) offer potential for unique stay experiences.
Hawaiian Paradise Park Airbnb Room Capacity Analysis (2026): Bedroom Distribution
Distribution of Listings by Number of Bedrooms
Room Capacity Insights for Hawaiian Paradise Park
- The dominant room capacity in Hawaiian Paradise Park is 1 bedroom listings, making up 33.3% of the market. This suggests a strong demand for properties suitable for couples or solo travelers.
- Together, 1 bedroom and 3 bedrooms properties represent 58.1% of the active Airbnb listings in Hawaiian Paradise Park, indicating a high concentration in these sizes.
- A significant 35.0% of listings offer 3+ bedrooms, catering to larger groups and families seeking more space in Hawaiian Paradise Park.
Hawaiian Paradise Park Vacation Rental Guest Capacity Trends (2026)
Distribution of Listings by Guest Capacity
Guest Capacity Insights for Hawaiian Paradise Park
- The most common guest capacity trend in Hawaiian Paradise Park vacation rentals is listings accommodating 2 guests (21.4%). This suggests the primary traveler segment is likely couples or solo travelers.
- Properties designed for 2 guests and 8+ guests dominate the Hawaiian Paradise Park STR market, accounting for 42.8% of listings.
- 38.5% of properties accommodate 6+ guests, serving the market segment for larger families or group travel in Hawaiian Paradise Park.
- On average, properties in Hawaiian Paradise Park are equipped to host 4.5 guests.
Hawaiian Paradise Park Airbnb Booking Patterns (2026): Available vs. Booked Days
Available Days Distribution
Booked Days Distribution
Booking Pattern Insights for Hawaiian Paradise Park
- The most common availability pattern in Hawaiian Paradise Park falls within the 91-180 days range, representing 41.9% of listings. This suggests many properties have significant open periods on their calendars.
- Approximately 41.9% of listings show high availability (181+ days open annually), indicating potential for increased bookings or specific owner usage patterns.
- For booked days, the 181-270 days range is most frequent in Hawaiian Paradise Park (41.9%), reflecting common guest stay durations or potential owner blocking patterns.
- A notable 58.1% of properties secure long booking periods (181+ days booked per year), highlighting successful long-term rental strategies or significant owner usage.
Hawaiian Paradise Park Airbnb Minimum Stay Requirements Analysis
Distribution of Listings by Minimum Night Requirement
1 Night
30 listings
25.6% of total
2 Nights
29 listings
24.8% of total
3 Nights
17 listings
14.5% of total
4-6 Nights
4 listings
3.4% of total
7-29 Nights
1 listings
0.9% of total
30+ Nights
36 listings
30.8% of total
Key Insights
- The most prevalent minimum stay requirement in Hawaiian Paradise Park is 30+ Nights, adopted by 30.8% of listings. This highlights the market's preference for longer commitments.
- A significant segment (30.8%) caters to monthly stays (30+ nights) in Hawaiian Paradise Park, pointing to opportunities in the extended-stay market.
Recommendations
- Align with the market by considering a 30+ Nights minimum stay, as 30.8% of Hawaiian Paradise Park hosts use this setting.
- If feasible, allowing 1-night stays, especially midweek or during low season, could capture last-minute bookings, as only 25.6% currently do.
- Explore offering discounts for stays of 30+ nights to attract the 30.8% of the market seeking extended stays.
- Adjust minimum nights based on seasonality – potentially shorter during low season and longer during peak demand periods in Hawaiian Paradise Park.
Hawaiian Paradise Park Airbnb Cancellation Policy Trends Analysis (2026)
Super Strict 30 Days
1 listings
0.9% of total
Flexible
19 listings
16.2% of total
Moderate
19 listings
16.2% of total
Firm
63 listings
53.8% of total
Strict
15 listings
12.8% of total
Cancellation Policy Insights for Hawaiian Paradise Park
- The prevailing Airbnb cancellation policy trend in Hawaiian Paradise Park is Firm, used by 53.8% of listings.
- A majority (66.6%) of hosts in Hawaiian Paradise Park utilize Firm or Strict policies, indicating a market where hosts prioritize booking security.
Recommendations for Hosts
- Consider adopting a Firm policy to align with the 53.8% market standard in Hawaiian Paradise Park.
- Using a Strict policy might deter some guests, as only 12.8% of listings use it. Evaluate if potential revenue protection outweighs possible lower booking rates.
- Regularly review your cancellation policy against competitors and market demand shifts in Hawaiian Paradise Park.
Hawaiian Paradise Park STR Booking Lead Time Analysis (2026)
Average Booking Lead Time by Month
Booking Lead Time Insights for Hawaiian Paradise Park
- The overall average booking lead time for vacation rentals in Hawaiian Paradise Park is 62 days.
- Guests book furthest in advance for stays during April (average 89 days), likely coinciding with peak travel demand or local events.
- The shortest booking windows occur for stays in March (average 44 days), indicating more last-minute travel plans during this time.
- Seasonally, Winter (69 days avg.) sees the longest lead times, while Summer (60 days avg.) has the shortest, reflecting typical travel planning cycles.
Recommendations for Hosts
- Use the overall average lead time (62 days) as a baseline for your pricing and availability strategy in Hawaiian Paradise Park.
- For April stays, consider implementing length-of-stay discounts or slightly higher rates for bookings made less than 89 days out to capitalize on advance planning.
- Target marketing efforts for the Winter season well in advance (at least 69 days) to capture early planners.
- Monitor your own booking lead times against these Hawaiian Paradise Park averages to identify opportunities for dynamic pricing adjustments.
Popular & Essential Airbnb Amenities in Hawaiian Paradise Park (2026)
Amenity Prevalence
Amenity Insights for Hawaiian Paradise Park
- Essential amenities in Hawaiian Paradise Park that guests expect include: Free parking on premises, Wifi, Coffee maker. Lacking these (any) could significantly impact bookings.
- Popular amenities like Dishes and silverware, Cooking basics, Smoke alarm are common but not universal. Offering these can provide a competitive edge.
Recommendations for Hosts
- Ensure your listing includes all essential amenities for Hawaiian Paradise Park: Free parking on premises, Wifi, Coffee maker.
- Prioritize adding missing essentials: Free parking on premises, Wifi, Coffee maker.
- Consider adding popular differentiators like Dishes and silverware or Cooking basics to increase appeal.
- Highlight unique or less common amenities you offer (e.g., hot tub, dedicated workspace, EV charger) in your listing description and photos.
- Regularly check competitor amenities in Hawaiian Paradise Park to stay competitive.
Hawaiian Paradise Park Airbnb Guest Demographics & Profile Analysis (2026)
Guest Profile Summary for Hawaiian Paradise Park
- The typical guest profile for Airbnb in Hawaiian Paradise Park consists of primarily domestic travelers (83%), often arriving from nearby Honolulu, typically belonging to the Post-2000s (Gen Z/Alpha) group (50%), primarily speaking English or Spanish.
- Domestic travelers account for 83.2% of guests.
- Key international markets include United States (83.2%) and Canada (5%).
- Top languages spoken are English (60.2%) followed by Spanish (9.6%).
- A significant demographic segment is the Post-2000s (Gen Z/Alpha) group, representing 50% of guests.
Recommendations for Hosts
- Target domestic marketing efforts towards travelers from Honolulu and Los Angeles.
- Tailor amenities and listing descriptions to appeal to the dominant Post-2000s (Gen Z/Alpha) demographic (e.g., highlight fast WiFi, smart home features, local guides).
- Highlight unique local experiences or amenities relevant to the primary guest profile.
- Consider seasonal promotions aligned with peak travel times for key origin markets.
Nearby Short-Term Rental Market Comparison
How does the Hawaiian Paradise Park Airbnb market stack up against its neighbors? Compare key performance metrics like average monthly revenue, ADR, and occupancy rates in surrounding areas to understand the broader regional STR landscape.
| Market | Active Properties | Monthly Revenue | Daily Rate | Avg. Occupancy |
|---|---|---|---|---|
| Waimea | 416 | $8,098 | $819.38 | 43% |
| Puakō | 62 | $7,820 | $874.88 | 44% |
| Hana | 68 | $7,791 | $413.38 | 65% |
| Honalo | 24 | $7,044 | $410.83 | 56% |
| Waikoloa Beach Resort | 27 | $6,060 | $544.82 | 46% |
| Kamuela | 93 | $5,561 | $1009.77 | 30% |
| Wainaku | 21 | $4,722 | $344.15 | 49% |
| Kahaluu-Keauhou | 767 | $4,704 | $402.19 | 45% |
| Kailua-Kona | 364 | $4,330 | $431.23 | 51% |
| Kapalaoa | 366 | $4,260 | $423.53 | 43% |