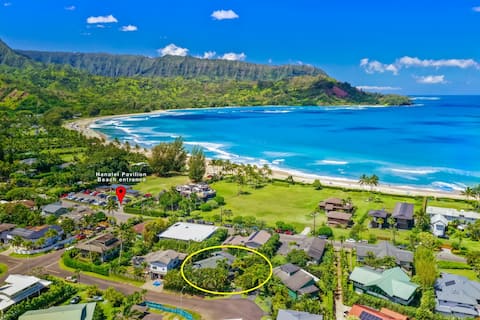
Hanalei Airbnb Market Analysis 2026: Short Term Rental Data & Vacation Rental Statistics in Hawaii, United States
Is Airbnb profitable in Hanalei in 2026? Explore comprehensive Airbnb analytics for Hanalei, Hawaii, United States to uncover income potential. This 2026 STR market report for Hanalei, based on AirROI data from February 2025 to January 2026, reveals key trends in the market of 426 active listings.
Whether you're considering an Airbnb investment in Hanalei, optimizing your existing vacation rental, or exploring rental arbitrage opportunities, understanding the Hanalei Airbnb data is crucial. Navigating the high regulation landscape is key to maximizing your short term rental income potential. Let's dive into the specifics.
Key Hanalei Airbnb Performance Metrics Overview
Monthly Airbnb Revenue Variations & Income Potential in Hanalei (2026)
Understanding the monthly revenue variations for Airbnb listings in Hanalei is key to maximizing your short term rental income potential. Seasonality significantly impacts earnings. Our analysis, based on data from the past 12 months, shows that the peak revenue month for STRs in Hanalei is typically July, while January often presents the lowest earnings, highlighting opportunities for strategic pricing adjustments during shoulder and low seasons. Explore the typical Airbnb income in Hanalei across different performance tiers:
- Best-in-class properties (Top 10%) achieve $21,732+ monthly, often utilizing dynamic pricing and superior guest experiences.
- Strong performing properties (Top 25%) earn $11,575 or more, indicating effective management and desirable locations/amenities.
- Typical properties (Median) generate around $6,327 per month, representing the average market performance.
- Entry-level properties (Bottom 25%) see earnings around $2,927, often with potential for optimization.
Average Monthly Airbnb Earnings Trend in Hanalei
Hanalei Airbnb Occupancy Rate Trends (2026)
Maximize your bookings by understanding the Hanalei STR occupancy trends. Seasonal demand shifts significantly influence how often properties are booked. Typically, Julysees the highest demand (peak season occupancy), while January experiences the lowest (low season). Effective strategies, like adjusting minimum stays or offering promotions, can boost occupancy during slower periods. Here's how different property tiers perform in Hanalei:
- Best-in-class properties (Top 10%) achieve 91%+ occupancy, indicating high desirability and potentially optimized availability.
- Strong performing properties (Top 25%) maintain 80% or higher occupancy, suggesting good market fit and guest satisfaction.
- Typical properties (Median) have an occupancy rate around 61%.
- Entry-level properties (Bottom 25%) average 30% occupancy, potentially facing higher vacancy.
Average Monthly Occupancy Rate Trend in Hanalei
Average Daily Rate (ADR) Airbnb Trends in Hanalei (2026)
Effective short term rental pricing strategy in Hanalei involves understanding monthly ADR fluctuations. The Average Daily Rate (ADR) for Airbnb in Hanalei typically peaks in December and dips lowest during April. Leveraging Airbnb dynamic pricing tools or strategies based on this seasonality can significantly boost revenue. Here's a look at the typical nightly rates achieved:
- Best-in-class properties (Top 10%) command rates of $1,192+ per night, often due to premium features or locations.
- Strong performing properties (Top 25%) achieve nightly rates of $643 or more.
- Typical properties (Median) charge around $382 per night.
- Entry-level properties (Bottom 25%) earn around $240 per night.
Average Daily Rate (ADR) Trend by Month in Hanalei
Get Live Hanalei Market Intelligence 👇

Explore Real-time Analytics
Airbnb Seasonality Analysis & Trends in Hanalei (2026)
Peak Season (July, June, March)
- Revenue averages $10,723 per month
- Occupancy rates average 61.5%
- Daily rates average $545
Shoulder Season
- Revenue averages $9,355 per month
- Occupancy maintains around 56.4%
- Daily rates hold near $557
Low Season (January, September, November)
- Revenue drops to average $8,058 per month
- Occupancy decreases to average 47.0%
- Daily rates adjust to average $593
Seasonality Insights for Hanalei
- The Airbnb seasonality in Hanalei shows moderate seasonality with distinct peak and low periods. While the sections above show seasonal averages, it's also insightful to look at the extremes:
- During the high season, the absolute peak month showcases Hanalei's highest earning potential, with monthly revenues capable of climbing to $11,788, occupancy reaching a high of 64.1%, and ADRs peaking at $640.
- Conversely, the slowest single month of the year, typically falling within the low season, marks the market's lowest point. In this month, revenue might dip to $7,501, occupancy could drop to 39.1%, and ADRs may adjust down to $517.
- Understanding both the seasonal averages and these monthly peaks and troughs in revenue, occupancy, and ADR is crucial for maximizing your Airbnb profit potential in Hanalei.
Seasonal Strategies for Maximizing Profit
- Peak Season: Maximize revenue through premium pricing and potentially longer minimum stays. Ensure high availability.
- Low Season: Offer competitive pricing, special promotions (e.g., extended stay discounts), and flexible cancellation policies. Target off-season travelers like remote workers or budget-conscious guests.
- Shoulder Seasons: Implement dynamic pricing that balances peak and low rates. Target weekend travelers or specific events. Offer slightly more flexible terms than peak season.
- Regularly analyze your own performance against these Hanalei seasonality benchmarks and adjust your pricing and availability strategy accordingly.
Best Areas for Airbnb Investment in Hanalei (2026)
Exploring the top neighborhoods for short-term rentals in Hanalei? This section highlights key areas, outlining why they are attractive for hosts and guests, along with notable local attractions. Consider these locations based on your target guest profile and investment strategy.
| Neighborhood / Area | Why Host Here? (Target Guests & Appeal) | Key Attractions & Landmarks |
|---|---|---|
| Hanalei Bay | Stunning natural beauty with breathtaking views and a perfect beach setting. Attracts tourists looking for relaxation, water sports, and scenic landscapes. | Hanalei National Wildlife Refuge, Na Pali Coast State Park, Hanalei National Historic Landmark District, Hanalei River, Hanalei Pier |
| Lumaha'i Beach | Famous for its picturesque scenery and featured in popular films. Ideal for those wishing to enjoy a quieter beach experience with stunning views. | Lumaha'i Beach, Wai'oli Beach Park, Kayaking at Hanalei River, Scenic hikes around the area |
| Kauai's North Shore | Known for its lush tropical landscapes and outdoor activities. Attracts nature lovers and adventure seekers, with plenty of hiking and exploration options. | Princeville Botanical Gardens, Napali Coast Hiking Trails, Kauai ATV Tours, St. Regis Hotel |
| Princeville | Upscale resort community known for luxury accommodations and stunning ocean views. Appeals to high-end travelers looking for a serene getaway. | Princeville Golf Club, Hanalei Bay Resort, Shopping galleries, Local dining spots |
| Pu'u Po'a Beach | Less crowded sandy beach perfect for sunbathing and snorkeling. A tranquil spot favored by those seeking peace and tranquility. | Pu'u Po'a Beach, Tunnels Beach, Makena Beach, Local snorkeling spots |
| Kalalau Trail | Famous hiking trail that offers stunning views of the Na Pali Coast. Attracts adventurous travelers looking for hiking and breathtaking scenery. | Na Pali Coast, Kalalau Beach, Sea Cave Exploration, Scenic viewpoints along the trail |
| Hanalei National Wildlife Refuge | Unique wildlife habitat that provides excellent birdwatching and photography opportunities. Ideal for eco-tourists and nature enthusiasts. | Various bird species, Guided tours, Nature trails, Scenic vistas |
| Old Kilauea Lighthouse | Historic lighthouse providing panoramic views of the coast. A popular spot for sightseeing and photography, drawing history buffs and tourists alike. | Kilauea Lighthouse, Kauai Mini Golf, Kilauea Point National Wildlife Refuge, Scenic lookout areas |
Understanding Airbnb License Requirements & STR Laws in Hanalei (2026)
Yes, Hanalei, Hawaii, United States enforces high STR regulations. Obtaining a license and ensuring compliance is almost certainly required according to current 2026 STR laws. Always verify the latest short term rental regulations and Airbnb license requirements directly with local government authorities for Hanalei to ensure full compliance before hosting.
(Source: AirROI data, 2026, based on 96% licensed listings)
Top Performing Airbnb Properties in Hanalei (2026)
Benchmark your potential! Explore examples of top-performing Airbnb properties in Hanaleibased on Trailing Twelve Month (TTM) revenue. Analyze their characteristics, revenue, occupancy rate, and ADR to understand what drives success in this market.
Hoaloha- Few Steps to Hanalei Bay+AC & Hot Tub
Entire Place • 5 bedrooms

Oceanfront Dolphin House Hanalei
Entire Place • 7 bedrooms

Newly remodeled Hanalei Bluff Modern is gorgeous!
Entire Place • 4 bedrooms
Haena Beach House: Luxe Beachfront Amazing Views
Entire Place • 5 bedrooms
Hanalei Plantation Villa: Pool, Hot Tub, AC & View
Entire Place • 4 bedrooms

Hanalei Getaway~Walk to Hanalei Bay/town. TVNC1109
Entire Place • 3 bedrooms
Note: Performance varies based on location, size, amenities, seasonality, and management quality. Data reflects the past 12 months.
Top Performing Airbnb Hosts in Hanalei (2026)
Learn from the best! This table showcases top-performing Airbnb hosts in Hanalei based on the number of properties managed and estimated total revenue over the past year. Analyze their scale and performance metrics.
| Host Name | Properties | Grossing Revenue | Stay Reviews | Avg Rating |
|---|---|---|---|---|
| Hawaii Life Rentals | 17 | $2,633,924 | 238 | 4.87/5.0 |
| Gather Vacations | 10 | $2,472,063 | 434 | 4.93/5.0 |
| Lisa | 9 | $2,276,390 | 470 | 4.94/5.0 |
| Kauai Kahuna Vacation Rentals | 24 | $2,020,274 | 861 | 4.68/5.0 |
| Makana Kauai Properties | 11 | $1,371,451 | 136 | 4.95/5.0 |
| HawaiiNorth | 2 | $788,945 | 135 | 4.90/5.0 |
| Donna | 7 | $753,113 | 177 | 4.70/5.0 |
| Jane | 11 | $718,124 | 185 | 4.90/5.0 |
| Kauai Palms Real Estate Co. | 4 | $643,537 | 113 | 4.97/5.0 |
| Kauai Vacation Rentals | 6 | $631,379 | 27 | 5.00/5.0 |
Analyzing the strategies of top hosts, such as their property selection, pricing, and guest communication, can offer valuable lessons for optimizing your own Airbnb operations in Hanalei.
Dive Deeper: Advanced Hanalei STR Market Data (2026)
Ready to unlock more insights? AirROI provides access to advanced metrics and comprehensive Airbnb data for Hanalei. Explore detailed analytics beyond this report to refine your investment strategy, optimize pricing, and maximize your vacation rental profits.
Explore Advanced MetricsHanalei Short-Term Rental Market Composition (2026): Property & Room Types
Room Type Distribution
Property Type Distribution
Market Composition Insights for Hanalei
- The Hanalei Airbnb market composition is heavily skewed towards Entire Home/Apt listings, which make up 95.8% of the 426 active rentals. This indicates strong guest preference for privacy and space.
- Looking at the property type distribution in Hanalei, Apartment/Condo properties are the most common (55.6%), reflecting the local real estate landscape.
- Houses represent a significant 39% portion, catering likely to families or larger groups.
- Smaller segments like hotel/boutique, others, outdoor/unique (combined 5.4%) offer potential for unique stay experiences.
Hanalei Airbnb Room Capacity Analysis (2026): Bedroom Distribution
Distribution of Listings by Number of Bedrooms
Room Capacity Insights for Hanalei
- The dominant room capacity in Hanalei is 2 bedrooms listings, making up 35.9% of the market. This suggests a strong demand for properties suitable for couples or solo travelers.
- Together, 2 bedrooms and 3 bedrooms properties represent 52.6% of the active Airbnb listings in Hanalei, indicating a high concentration in these sizes.
- A significant 26.8% of listings offer 3+ bedrooms, catering to larger groups and families seeking more space in Hanalei.
Hanalei Vacation Rental Guest Capacity Trends (2026)
Distribution of Listings by Guest Capacity
Guest Capacity Insights for Hanalei
- The most common guest capacity trend in Hanalei vacation rentals is listings accommodating 6 guests (30.3%). This suggests the primary traveler segment is likely larger groups.
- Properties designed for 6 guests and 4 guests dominate the Hanalei STR market, accounting for 56.1% of listings.
- 46.8% of properties accommodate 6+ guests, serving the market segment for larger families or group travel in Hanalei.
- On average, properties in Hanalei are equipped to host 4.8 guests.
Hanalei Airbnb Booking Patterns (2026): Available vs. Booked Days
Available Days Distribution
Booked Days Distribution
Booking Pattern Insights for Hanalei
- The most common availability pattern in Hanalei falls within the 271-366 days range, representing 38% of listings. This suggests many properties have significant open periods on their calendars.
- Approximately 57.5% of listings show high availability (181+ days open annually), indicating potential for increased bookings or specific owner usage patterns.
- For booked days, the 181-270 days range is most frequent in Hanalei (26.5%), reflecting common guest stay durations or potential owner blocking patterns.
- A notable 43.9% of properties secure long booking periods (181+ days booked per year), highlighting successful long-term rental strategies or significant owner usage.
Hanalei Airbnb Minimum Stay Requirements Analysis
Distribution of Listings by Minimum Night Requirement
1 Night
54 listings
12.7% of total
2 Nights
100 listings
23.5% of total
3 Nights
24 listings
5.6% of total
4-6 Nights
34 listings
8% of total
7-29 Nights
7 listings
1.6% of total
30+ Nights
206 listings
48.5% of total
Key Insights
- The most prevalent minimum stay requirement in Hanalei is 30+ Nights, adopted by 48.5% of listings. This highlights the market's preference for longer commitments.
- A significant segment (48.5%) caters to monthly stays (30+ nights) in Hanalei, pointing to opportunities in the extended-stay market.
Recommendations
- Align with the market by considering a 30+ Nights minimum stay, as 48.5% of Hanalei hosts use this setting.
- If feasible, allowing 1-night stays, especially midweek or during low season, could capture last-minute bookings, as only 12.7% currently do.
- Explore offering discounts for stays of 30+ nights to attract the 48.5% of the market seeking extended stays.
- Adjust minimum nights based on seasonality – potentially shorter during low season and longer during peak demand periods in Hanalei.
Hanalei Airbnb Cancellation Policy Trends Analysis (2026)
Super Strict 60 Days
40 listings
9.5% of total
Super Strict 30 Days
48 listings
11.3% of total
Limited
1 listings
0.2% of total
Flexible
5 listings
1.2% of total
Moderate
23 listings
5.4% of total
Firm
150 listings
35.5% of total
Strict
156 listings
36.9% of total
Cancellation Policy Insights for Hanalei
- The prevailing Airbnb cancellation policy trend in Hanalei is Strict, used by 36.9% of listings.
- A majority (72.4%) of hosts in Hanalei utilize Firm or Strict policies, indicating a market where hosts prioritize booking security.
Recommendations for Hosts
- Consider adopting a Strict policy to align with the 36.9% market standard in Hanalei.
- With 36.9% using Strict terms, this is a viable option in Hanalei, particularly for high-value properties or during peak demand periods.
- Regularly review your cancellation policy against competitors and market demand shifts in Hanalei.
Hanalei STR Booking Lead Time Analysis (2026)
Average Booking Lead Time by Month
Booking Lead Time Insights for Hanalei
- The overall average booking lead time for vacation rentals in Hanalei is 74 days.
- Guests book furthest in advance for stays during December (average 85 days), likely coinciding with peak travel demand or local events.
- The shortest booking windows occur for stays in February (average 63 days), indicating more last-minute travel plans during this time.
- Seasonally, Fall (79 days avg.) sees the longest lead times, while Spring (74 days avg.) has the shortest, reflecting typical travel planning cycles.
Recommendations for Hosts
- Use the overall average lead time (74 days) as a baseline for your pricing and availability strategy in Hanalei.
- For December stays, consider implementing length-of-stay discounts or slightly higher rates for bookings made less than 85 days out to capitalize on advance planning.
- Target marketing efforts for the Fall season well in advance (at least 79 days) to capture early planners.
- Monitor your own booking lead times against these Hanalei averages to identify opportunities for dynamic pricing adjustments.
Popular & Essential Airbnb Amenities in Hanalei (2026)
Amenity Prevalence
Amenity Insights for Hanalei
- Essential amenities in Hanalei that guests expect include: Wifi, Smoke alarm, TV, Hair dryer. Lacking these (any) could significantly impact bookings.
- Popular amenities like Free parking on premises, Essentials, Coffee maker are common but not universal. Offering these can provide a competitive edge.
Recommendations for Hosts
- Ensure your listing includes all essential amenities for Hanalei: Wifi, Smoke alarm, TV, Hair dryer.
- Prioritize adding missing essentials: Wifi, Smoke alarm, TV, Hair dryer.
- Consider adding popular differentiators like Free parking on premises or Essentials to increase appeal.
- Highlight unique or less common amenities you offer (e.g., hot tub, dedicated workspace, EV charger) in your listing description and photos.
- Regularly check competitor amenities in Hanalei to stay competitive.
Hanalei Airbnb Guest Demographics & Profile Analysis (2026)
Guest Profile Summary for Hanalei
- The typical guest profile for Airbnb in Hanalei consists of primarily domestic travelers (91%), often arriving from nearby San Francisco, typically belonging to the Post-2000s (Gen Z/Alpha) group (50%), primarily speaking English or Spanish.
- Domestic travelers account for 91.1% of guests.
- Key international markets include United States (91.1%) and Canada (2.4%).
- Top languages spoken are English (63.7%) followed by Spanish (11.3%).
- A significant demographic segment is the Post-2000s (Gen Z/Alpha) group, representing 50% of guests.
Recommendations for Hosts
- Target domestic marketing efforts towards travelers from San Francisco and Los Angeles.
- Tailor amenities and listing descriptions to appeal to the dominant Post-2000s (Gen Z/Alpha) demographic (e.g., highlight fast WiFi, smart home features, local guides).
- Highlight unique local experiences or amenities relevant to the primary guest profile.
- Consider seasonal promotions aligned with peak travel times for key origin markets.
Nearby Short-Term Rental Market Comparison
How does the Hanalei Airbnb market stack up against its neighbors? Compare key performance metrics like average monthly revenue, ADR, and occupancy rates in surrounding areas to understand the broader regional STR landscape.
| Market | Active Properties | Monthly Revenue | Daily Rate | Avg. Occupancy |
|---|---|---|---|---|
| Haena | 12 | $14,312 | $1130.41 | 51% |
| Anahola | 22 | $13,673 | $845.34 | 54% |
| Mākaha Valley | 96 | $13,116 | $669.71 | 70% |
| Kilauea | 45 | $9,733 | $1064.42 | 50% |
| Kekaha | 14 | $9,595 | $545.34 | 65% |
| Koloa | 266 | $8,991 | $942.59 | 48% |
| Poipu | 1,140 | $6,673 | $596.99 | 48% |
| Kapolei | 520 | $6,393 | $688.27 | 44% |
| Kapaa | 233 | $5,645 | $425.03 | 53% |
| Princeville | 1,362 | $5,590 | $429.56 | 50% |