Anahola Airbnb Market Analysis 2026: Short Term Rental Data & Vacation Rental Statistics in Hawaii, United States
Is Airbnb profitable in Anahola in 2026? Explore comprehensive Airbnb analytics for Anahola, Hawaii, United States to uncover income potential. This 2026 STR market report for Anahola, based on AirROI data from February 2025 to January 2026, reveals key trends in the niche market of 22 active listings.
Whether you're considering an Airbnb investment in Anahola, optimizing your existing vacation rental, or exploring rental arbitrage opportunities, understanding the Anahola Airbnb data is crucial. Navigating the high regulation landscape is key to maximizing your short term rental income potential. Let's dive into the specifics.
Key Anahola Airbnb Performance Metrics Overview
Monthly Airbnb Revenue Variations & Income Potential in Anahola (2026)
Understanding the monthly revenue variations for Airbnb listings in Anahola is key to maximizing your short term rental income potential. Seasonality significantly impacts earnings. Our analysis, based on data from the past 12 months, shows that the peak revenue month for STRs in Anahola is typically December, while April often presents the lowest earnings, highlighting opportunities for strategic pricing adjustments during shoulder and low seasons. Explore the typical Airbnb income in Anahola across different performance tiers:
- Best-in-class properties (Top 10%) achieve $34,808+ monthly, often utilizing dynamic pricing and superior guest experiences.
- Strong performing properties (Top 25%) earn $23,973 or more, indicating effective management and desirable locations/amenities.
- Typical properties (Median) generate around $11,035 per month, representing the average market performance.
- Entry-level properties (Bottom 25%) see earnings around $3,436, often with potential for optimization.
Average Monthly Airbnb Earnings Trend in Anahola
Anahola Airbnb Occupancy Rate Trends (2026)
Maximize your bookings by understanding the Anahola STR occupancy trends. Seasonal demand shifts significantly influence how often properties are booked. Typically, Junesees the highest demand (peak season occupancy), while January experiences the lowest (low season). Effective strategies, like adjusting minimum stays or offering promotions, can boost occupancy during slower periods. Here's how different property tiers perform in Anahola:
- Best-in-class properties (Top 10%) achieve 90%+ occupancy, indicating high desirability and potentially optimized availability.
- Strong performing properties (Top 25%) maintain 76% or higher occupancy, suggesting good market fit and guest satisfaction.
- Typical properties (Median) have an occupancy rate around 53%.
- Entry-level properties (Bottom 25%) average 24% occupancy, potentially facing higher vacancy.
Average Monthly Occupancy Rate Trend in Anahola
Average Daily Rate (ADR) Airbnb Trends in Anahola (2026)
Effective short term rental pricing strategy in Anahola involves understanding monthly ADR fluctuations. The Average Daily Rate (ADR) for Airbnb in Anahola typically peaks in December and dips lowest during April. Leveraging Airbnb dynamic pricing tools or strategies based on this seasonality can significantly boost revenue. Here's a look at the typical nightly rates achieved:
- Best-in-class properties (Top 10%) command rates of $1,508+ per night, often due to premium features or locations.
- Strong performing properties (Top 25%) achieve nightly rates of $946 or more.
- Typical properties (Median) charge around $457 per night.
- Entry-level properties (Bottom 25%) earn around $229 per night.
Average Daily Rate (ADR) Trend by Month in Anahola
Get Live Anahola Market Intelligence 👇

Explore Real-time Analytics
Airbnb Seasonality Analysis & Trends in Anahola (2026)
Peak Season (December, June, July)
- Revenue averages $19,646 per month
- Occupancy rates average 60.2%
- Daily rates average $650
Shoulder Season
- Revenue averages $14,132 per month
- Occupancy maintains around 50.2%
- Daily rates hold near $647
Low Season (January, February, April)
- Revenue drops to average $11,402 per month
- Occupancy decreases to average 45.5%
- Daily rates adjust to average $633
Seasonality Insights for Anahola
- The Airbnb seasonality in Anahola shows highly seasonal trends requiring careful strategy. While the sections above show seasonal averages, it's also insightful to look at the extremes:
- During the high season, the absolute peak month showcases Anahola's highest earning potential, with monthly revenues capable of climbing to $21,256, occupancy reaching a high of 62.2%, and ADRs peaking at $810.
- Conversely, the slowest single month of the year, typically falling within the low season, marks the market's lowest point. In this month, revenue might dip to $10,540, occupancy could drop to 39.1%, and ADRs may adjust down to $539.
- Understanding both the seasonal averages and these monthly peaks and troughs in revenue, occupancy, and ADR is crucial for maximizing your Airbnb profit potential in Anahola.
Seasonal Strategies for Maximizing Profit
- Peak Season: Maximize revenue through premium pricing and potentially longer minimum stays. Ensure high availability.
- Low Season: Offer competitive pricing, special promotions (e.g., extended stay discounts), and flexible cancellation policies. Target off-season travelers like remote workers or budget-conscious guests.
- Shoulder Seasons: Implement dynamic pricing that balances peak and low rates. Target weekend travelers or specific events. Offer slightly more flexible terms than peak season.
- Regularly analyze your own performance against these Anahola seasonality benchmarks and adjust your pricing and availability strategy accordingly.
Best Areas for Airbnb Investment in Anahola (2026)
Exploring the top neighborhoods for short-term rentals in Anahola? This section highlights key areas, outlining why they are attractive for hosts and guests, along with notable local attractions. Consider these locations based on your target guest profile and investment strategy.
| Neighborhood / Area | Why Host Here? (Target Guests & Appeal) | Key Attractions & Landmarks |
|---|---|---|
| Anahola Beach | Anahola Beach is a secluded and picturesque location ideal for visitors looking for a peaceful retreat in Kauai. Its stunning views and calm waters attract families and couples seeking relaxation. | Anahola Beach Park, Na Pali Coast State Park, Opaekaa Falls, Kauai Coffee Company, Kilauea Lighthouse |
| Kauai's North Shore | The North Shore of Kauai, including Hanalei and Princeville, is known for its breathtaking landscapes and outdoor activities. It’s a prime location for tourists who enjoy hiking, beaches, and stunning sunsets. | Hanalei National Wildlife Refuge, Na Pali Coast, Tunnels Beach, Hanalei Bay, Limahauli Garden and Preserve |
| Kilauea | Kilauea is home to beautiful beaches and a vibrant community. It offers a mix of relaxation and activities, making it appealing for both families and adventure seekers. | Kilauea Point National Wildlife Refuge, Kilauea Lighthouse, Secret Beach, Kalihiwai Beach, Na Aina Kai Botanical Gardens |
| Kapaa | Kapaa is a lively town with a blend of local shops, beach access, and dining options. It caters to a diverse crowd and offers a vibrant atmosphere, ideal for tourists looking for convenience and culture. | Kapaa Town, Lydgate Beach Park, Donkey Beach, Sleeping Giant Trail, Kauai Village Shopping Center |
| Lihue | Lihue is the commercial center of Kauai and provides easy access to various attractions. Visitors can enjoy urban conveniences while being close to beautiful beaches and parks. | Kalapaki Beach, Nawiliwili Harbor, Kauai Museum, Salt Pond Beach Park, Kokee State Park |
| Poipu | Poipu is known for its sunny weather and beautiful beaches, making it a top destination for tourists seeking beach activities and family-friendly resorts. | Poipu Beach Park, Spouting Horn, Maha'ulepu Heritage Trail, Allerton Garden, Koloa Town |
| Hanapepe | Hanapepe is a charming small town with a strong local art scene and historical significance. It offers a more laid-back experience for tourists wishing to explore local culture. | Hanapepe Art Walk, Hanapepe Swinging Bridge, Salt Pond Beach, Kauai Coffee Company, Port Allen Harbor |
| Waimea | Waimea is the gateway to Waimea Canyon, offering stunning views and outdoor adventures. It attracts nature lovers and those seeking to experience the natural beauty of Kauai. | Waimea Canyon State Park, Koke'e State Park, Polihale State Park, Russian Fort Elizabeth, Waimea Plantation Cottages |
Understanding Airbnb License Requirements & STR Laws in Anahola (2026)
Yes, Anahola, Hawaii, United States enforces high STR regulations. Obtaining a license and ensuring compliance is almost certainly required according to current 2026 STR laws. Always verify the latest short term rental regulations and Airbnb license requirements directly with local government authorities for Anahola to ensure full compliance before hosting.
(Source: AirROI data, 2026, based on 86% licensed listings)
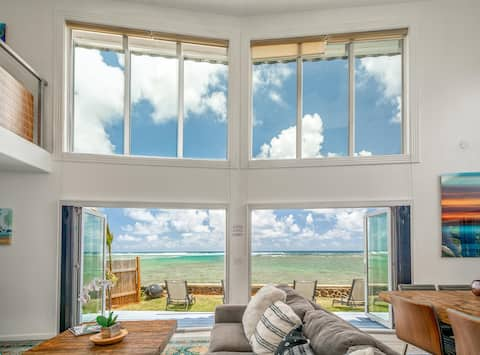
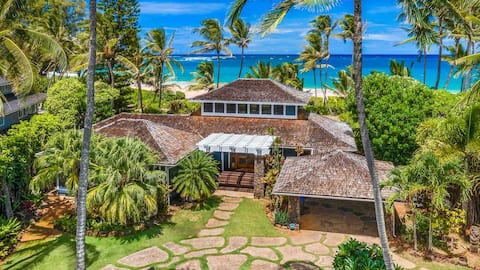
Top Performing Airbnb Properties in Anahola (2026)
Benchmark your potential! Explore examples of top-performing Airbnb properties in Anaholabased on Trailing Twelve Month (TTM) revenue. Analyze their characteristics, revenue, occupancy rate, and ADR to understand what drives success in this market.
Modern, Beachfront 4 Bdrm - Eastside Retreat with
Entire Place • 4 bedrooms

Luxe Beachfront Anahola with A/C
Entire Place • 4 bedrooms
Anahola Beach Hale By Parrish Kauai
Entire Place • 4 bedrooms

Hale Makai Beachfront Home, Anahola Bay, TVNC#5065
Entire Place • 3 bedrooms

NEW 4BR Oceanfront Home with Hot Tub & Theatre
Entire Place • 4 bedrooms

Anahola Beach House 6br
Entire Place • 6 bedrooms
Note: Performance varies based on location, size, amenities, seasonality, and management quality. Data reflects the past 12 months.
Top Performing Airbnb Hosts in Anahola (2026)
Learn from the best! This table showcases top-performing Airbnb hosts in Anahola based on the number of properties managed and estimated total revenue over the past year. Analyze their scale and performance metrics.
| Host Name | Properties | Grossing Revenue | Stay Reviews | Avg Rating |
|---|---|---|---|---|
| Hawaii Life Rentals | 2 | $734,839 | 47 | 4.79/5.0 |
| Parrish Kauai | 2 | $555,496 | 26 | 4.37/5.0 |
| Steve | 1 | $402,479 | 30 | 4.93/5.0 |
| Kanani | 2 | $393,687 | 67 | 4.90/5.0 |
| Kathy McCartney | 1 | $264,624 | 6 | 4.83/5.0 |
| David | 1 | $246,542 | 114 | 4.92/5.0 |
| Coldwell Banker Island Vacatio | 1 | $244,842 | 25 | 4.96/5.0 |
| Kaala | 3 | $190,985 | 271 | 4.79/5.0 |
| Deborah | 1 | $170,544 | 38 | 4.92/5.0 |
| Lynn | 1 | $122,395 | 21 | 4.76/5.0 |
Analyzing the strategies of top hosts, such as their property selection, pricing, and guest communication, can offer valuable lessons for optimizing your own Airbnb operations in Anahola.
Dive Deeper: Advanced Anahola STR Market Data (2026)
Ready to unlock more insights? AirROI provides access to advanced metrics and comprehensive Airbnb data for Anahola. Explore detailed analytics beyond this report to refine your investment strategy, optimize pricing, and maximize your vacation rental profits.
Explore Advanced MetricsAnahola Short-Term Rental Market Composition (2026): Property & Room Types
Room Type Distribution
Property Type Distribution
Market Composition Insights for Anahola
- The Anahola Airbnb market composition is heavily skewed towards Entire Home/Apt listings, which make up 100% of the 22 active rentals. This indicates strong guest preference for privacy and space.
- Looking at the property type distribution in Anahola, House properties are the most common (90.9%), reflecting the local real estate landscape.
- Houses represent a significant 90.9% portion, catering likely to families or larger groups.
- Smaller segments like apartment/condo, outdoor/unique (combined 9.0%) offer potential for unique stay experiences.
Anahola Airbnb Room Capacity Analysis (2026): Bedroom Distribution
Distribution of Listings by Number of Bedrooms
Room Capacity Insights for Anahola
- The dominant room capacity in Anahola is 4 bedrooms listings, making up 31.8% of the market. This suggests a strong demand for properties suitable for families or small groups.
- Together, 4 bedrooms and 2 bedrooms properties represent 54.5% of the active Airbnb listings in Anahola, indicating a high concentration in these sizes.
- A significant 50.0% of listings offer 3+ bedrooms, catering to larger groups and families seeking more space in Anahola.
Anahola Vacation Rental Guest Capacity Trends (2026)
Distribution of Listings by Guest Capacity
Guest Capacity Insights for Anahola
- The most common guest capacity trend in Anahola vacation rentals is listings accommodating 8+ guests (36.4%). This suggests the primary traveler segment is likely larger groups.
- Properties designed for 8+ guests and 6 guests dominate the Anahola STR market, accounting for 63.7% of listings.
- 63.7% of properties accommodate 6+ guests, serving the market segment for larger families or group travel in Anahola.
- On average, properties in Anahola are equipped to host 5.7 guests.
Anahola Airbnb Booking Patterns (2026): Available vs. Booked Days
Available Days Distribution
Booked Days Distribution
Booking Pattern Insights for Anahola
- The most common availability pattern in Anahola falls within the 91-180 days range, representing 40.9% of listings. This suggests many properties have significant open periods on their calendars.
- Approximately 45.4% of listings show high availability (181+ days open annually), indicating potential for increased bookings or specific owner usage patterns.
- For booked days, the 181-270 days range is most frequent in Anahola (40.9%), reflecting common guest stay durations or potential owner blocking patterns.
- A notable 54.5% of properties secure long booking periods (181+ days booked per year), highlighting successful long-term rental strategies or significant owner usage.
Anahola Airbnb Minimum Stay Requirements Analysis
Distribution of Listings by Minimum Night Requirement
1 Night
1 listings
4.5% of total
2 Nights
3 listings
13.6% of total
3 Nights
3 listings
13.6% of total
4-6 Nights
4 listings
18.2% of total
30+ Nights
11 listings
50% of total
Key Insights
- The most prevalent minimum stay requirement in Anahola is 30+ Nights, adopted by 50% of listings. This highlights the market's preference for longer commitments.
- Very short stays (1-2 nights) are less common (18.1%), suggesting hosts prefer slightly longer bookings to optimize turnover.
- A significant segment (50%) caters to monthly stays (30+ nights) in Anahola, pointing to opportunities in the extended-stay market.
Recommendations
- Align with the market by considering a 30+ Nights minimum stay, as 50% of Anahola hosts use this setting.
- If feasible, allowing 1-night stays, especially midweek or during low season, could capture last-minute bookings, as only 4.5% currently do.
- Explore offering discounts for stays of 30+ nights to attract the 50% of the market seeking extended stays.
- Adjust minimum nights based on seasonality – potentially shorter during low season and longer during peak demand periods in Anahola.
Anahola Airbnb Cancellation Policy Trends Analysis (2026)
Super Strict 30 Days
1 listings
4.8% of total
Super Strict 60 Days
3 listings
14.3% of total
Moderate
2 listings
9.5% of total
Firm
12 listings
57.1% of total
Strict
3 listings
14.3% of total
Cancellation Policy Insights for Anahola
- The prevailing Airbnb cancellation policy trend in Anahola is Firm, used by 57.1% of listings.
- A majority (71.4%) of hosts in Anahola utilize Firm or Strict policies, indicating a market where hosts prioritize booking security.
Recommendations for Hosts
- Consider adopting a Firm policy to align with the 57.1% market standard in Anahola.
- Using a Strict policy might deter some guests, as only 14.3% of listings use it. Evaluate if potential revenue protection outweighs possible lower booking rates.
- Regularly review your cancellation policy against competitors and market demand shifts in Anahola.
Anahola STR Booking Lead Time Analysis (2026)
Average Booking Lead Time by Month
Booking Lead Time Insights for Anahola
- The overall average booking lead time for vacation rentals in Anahola is 111 days.
- Guests book furthest in advance for stays during June (average 145 days), likely coinciding with peak travel demand or local events.
- The shortest booking windows occur for stays in March (average 98 days), indicating more last-minute travel plans during this time.
- Seasonally, Summer (125 days avg.) sees the longest lead times, while Spring (104 days avg.) has the shortest, reflecting typical travel planning cycles.
Recommendations for Hosts
- Use the overall average lead time (111 days) as a baseline for your pricing and availability strategy in Anahola.
- For June stays, consider implementing length-of-stay discounts or slightly higher rates for bookings made less than 145 days out to capitalize on advance planning.
- Target marketing efforts for the Summer season well in advance (at least 125 days) to capture early planners.
- Monitor your own booking lead times against these Anahola averages to identify opportunities for dynamic pricing adjustments.
Popular & Essential Airbnb Amenities in Anahola (2026)
Amenity Prevalence
Amenity Insights for Anahola
- Essential amenities in Anahola that guests expect include: Free parking on premises, Kitchen, Wifi, TV. Lacking these (any) could significantly impact bookings.
- Popular amenities like Dryer, Essentials, Washer are common but not universal. Offering these can provide a competitive edge.
Recommendations for Hosts
- Ensure your listing includes all essential amenities for Anahola: Free parking on premises, Kitchen, Wifi, TV.
- Prioritize adding missing essentials: Wifi, TV.
- Consider adding popular differentiators like Dryer or Essentials to increase appeal.
- Highlight unique or less common amenities you offer (e.g., hot tub, dedicated workspace, EV charger) in your listing description and photos.
- Regularly check competitor amenities in Anahola to stay competitive.
Anahola Airbnb Guest Demographics & Profile Analysis (2026)
Guest Profile Summary for Anahola
- The typical guest profile for Airbnb in Anahola consists of primarily domestic travelers (92%), often arriving from nearby Los Angeles, typically belonging to the Post-2000s (Gen Z/Alpha) group (50%), primarily speaking English or Spanish.
- Domestic travelers account for 91.7% of guests.
- Key international markets include United States (91.7%) and Germany (1.4%).
- Top languages spoken are English (60.6%) followed by Spanish (15.5%).
- A significant demographic segment is the Post-2000s (Gen Z/Alpha) group, representing 50% of guests.
Recommendations for Hosts
- Target domestic marketing efforts towards travelers from Los Angeles and San Diego.
- Tailor amenities and listing descriptions to appeal to the dominant Post-2000s (Gen Z/Alpha) demographic (e.g., highlight fast WiFi, smart home features, local guides).
- Highlight unique local experiences or amenities relevant to the primary guest profile.
- Consider seasonal promotions aligned with peak travel times for key origin markets.
Nearby Short-Term Rental Market Comparison
How does the Anahola Airbnb market stack up against its neighbors? Compare key performance metrics like average monthly revenue, ADR, and occupancy rates in surrounding areas to understand the broader regional STR landscape.
| Market | Active Properties | Monthly Revenue | Daily Rate | Avg. Occupancy |
|---|---|---|---|---|
| Haena | 12 | $14,312 | $1130.41 | 51% |
| Mākaha Valley | 96 | $13,116 | $669.71 | 70% |
| Kilauea | 45 | $9,733 | $1064.42 | 50% |
| Kekaha | 14 | $9,595 | $545.34 | 65% |
| Koloa | 266 | $8,991 | $942.59 | 48% |
| Hanalei | 426 | $6,937 | $560.08 | 50% |
| Poipu | 1,140 | $6,673 | $596.99 | 48% |
| Kapolei | 520 | $6,393 | $688.27 | 44% |
| Kapaa | 233 | $5,645 | $425.03 | 53% |
| Princeville | 1,362 | $5,590 | $429.56 | 50% |