Ainaloa CDP Airbnb Market Analysis 2026: Short Term Rental Data & Vacation Rental Statistics in Hawaii, United States
Is Airbnb profitable in Ainaloa CDP in 2026? Explore comprehensive Airbnb analytics for Ainaloa CDP, Hawaii, United States to uncover income potential. This 2026 STR market report for Ainaloa CDP, based on AirROI data from February 2025 to January 2026, reveals key trends in the niche market of 25 active listings.
Whether you're considering an Airbnb investment in Ainaloa CDP, optimizing your existing vacation rental, or exploring rental arbitrage opportunities, understanding the Ainaloa CDP Airbnb data is crucial. Understanding the local regulations is key to maximizing your short term rental income potential. Let's dive into the specifics.
Key Ainaloa CDP Airbnb Performance Metrics Overview
Monthly Airbnb Revenue Variations & Income Potential in Ainaloa CDP (2026)
Understanding the monthly revenue variations for Airbnb listings in Ainaloa CDP is key to maximizing your short term rental income potential. Seasonality significantly impacts earnings. Our analysis, based on data from the past 12 months, shows that the peak revenue month for STRs in Ainaloa CDP is typically October, while January often presents the lowest earnings, highlighting opportunities for strategic pricing adjustments during shoulder and low seasons. Explore the typical Airbnb income in Ainaloa CDP across different performance tiers:
- Best-in-class properties (Top 10%) achieve $3,744+ monthly, often utilizing dynamic pricing and superior guest experiences.
- Strong performing properties (Top 25%) earn $2,738 or more, indicating effective management and desirable locations/amenities.
- Typical properties (Median) generate around $1,655 per month, representing the average market performance.
- Entry-level properties (Bottom 25%) see earnings around $886, often with potential for optimization.
Average Monthly Airbnb Earnings Trend in Ainaloa CDP
Ainaloa CDP Airbnb Occupancy Rate Trends (2026)
Maximize your bookings by understanding the Ainaloa CDP STR occupancy trends. Seasonal demand shifts significantly influence how often properties are booked. Typically, Februarysees the highest demand (peak season occupancy), while January experiences the lowest (low season). Effective strategies, like adjusting minimum stays or offering promotions, can boost occupancy during slower periods. Here's how different property tiers perform in Ainaloa CDP:
- Best-in-class properties (Top 10%) achieve 87%+ occupancy, indicating high desirability and potentially optimized availability.
- Strong performing properties (Top 25%) maintain 77% or higher occupancy, suggesting good market fit and guest satisfaction.
- Typical properties (Median) have an occupancy rate around 57%.
- Entry-level properties (Bottom 25%) average 32% occupancy, potentially facing higher vacancy.
Average Monthly Occupancy Rate Trend in Ainaloa CDP
Average Daily Rate (ADR) Airbnb Trends in Ainaloa CDP (2026)
Effective short term rental pricing strategy in Ainaloa CDP involves understanding monthly ADR fluctuations. The Average Daily Rate (ADR) for Airbnb in Ainaloa CDP typically peaks in December and dips lowest during March. Leveraging Airbnb dynamic pricing tools or strategies based on this seasonality can significantly boost revenue. Here's a look at the typical nightly rates achieved:
- Best-in-class properties (Top 10%) command rates of $199+ per night, often due to premium features or locations.
- Strong performing properties (Top 25%) achieve nightly rates of $160 or more.
- Typical properties (Median) charge around $105 per night.
- Entry-level properties (Bottom 25%) earn around $75 per night.
Average Daily Rate (ADR) Trend by Month in Ainaloa CDP
Get Live Ainaloa CDP Market Intelligence 👇

Explore Real-time Analytics
Airbnb Seasonality Analysis & Trends in Ainaloa CDP (2026)
Peak Season (October, July, August)
- Revenue averages $2,253 per month
- Occupancy rates average 58.0%
- Daily rates average $122
Shoulder Season
- Revenue averages $1,909 per month
- Occupancy maintains around 56.2%
- Daily rates hold near $121
Low Season (January, April, June)
- Revenue drops to average $1,604 per month
- Occupancy decreases to average 49.6%
- Daily rates adjust to average $119
Seasonality Insights for Ainaloa CDP
- The Airbnb seasonality in Ainaloa CDP shows moderate seasonality with distinct peak and low periods. While the sections above show seasonal averages, it's also insightful to look at the extremes:
- During the high season, the absolute peak month showcases Ainaloa CDP's highest earning potential, with monthly revenues capable of climbing to $2,501, occupancy reaching a high of 65.9%, and ADRs peaking at $138.
- Conversely, the slowest single month of the year, typically falling within the low season, marks the market's lowest point. In this month, revenue might dip to $1,506, occupancy could drop to 40.5%, and ADRs may adjust down to $105.
- Understanding both the seasonal averages and these monthly peaks and troughs in revenue, occupancy, and ADR is crucial for maximizing your Airbnb profit potential in Ainaloa CDP.
Seasonal Strategies for Maximizing Profit
- Peak Season: Maximize revenue through premium pricing and potentially longer minimum stays. Ensure high availability.
- Low Season: Offer competitive pricing, special promotions (e.g., extended stay discounts), and flexible cancellation policies. Target off-season travelers like remote workers or budget-conscious guests.
- Shoulder Seasons: Implement dynamic pricing that balances peak and low rates. Target weekend travelers or specific events. Offer slightly more flexible terms than peak season.
- Regularly analyze your own performance against these Ainaloa CDP seasonality benchmarks and adjust your pricing and availability strategy accordingly.
Best Areas for Airbnb Investment in Ainaloa CDP (2026)
Exploring the top neighborhoods for short-term rentals in Ainaloa CDP? This section highlights key areas, outlining why they are attractive for hosts and guests, along with notable local attractions. Consider these locations based on your target guest profile and investment strategy.
| Neighborhood / Area | Why Host Here? (Target Guests & Appeal) | Key Attractions & Landmarks |
|---|---|---|
| Ainaloa Estates | A peaceful suburban community offering spacious lots and tranquil surroundings. Attracts families and vacationers looking for a quiet getaway close to nature and outdoor activities. | Hawaii Volcanoes National Park, MacKenzie State Park, Puna Coast, Punalu’u Black Sand Beach, Kaimu Black Sand Beach, Kapoho Tide Pools |
| Pahoa | A charming small town with a laid-back vibe, known for its local shops and vibrant community. Popular with tourists seeking a more authentic Hawaiian experience, along with access to beautiful natural scenery. | Pahoa Village, Ahalanui Park, Lava Tree State Park, Kehena Black Sand Beach, Green Lake, Pohoiki Beach |
| Hilo | A historic town with rich Hawaiian culture and lush landscapes. Known for its bustling markets and beautiful waterfalls, Hilo is an excellent choice for travelers interested in nature and culture. | Rainbow Falls, Liliuokalani Gardens, Hilo Farmers Market, Imiloa Astronomy Center, Hawaii Tropical Botanical Garden, Panaewa Rainforest Zoo |
| Keaau | A growing community near Hilo, known for its access to both beach and forest adventures. It appeals to families and outdoor enthusiasts looking for a base for exploration. | Kea’au Shopping Center, Pana’ewa Rainforest Zoo, Hawaiian Paradise Park, Kilauea Volcano, Coconut Island |
| Kailua-Kona | A popular tourist destination known for its beaches, shopping, and nightlife. Offers a vibrant atmosphere for vacationers looking for relaxation and entertainment. | Kona Coffee Living History Farm, Hulihee Palace, Magic Sands Beach, Kona Brewing Company, Kona Farmers Market |
| Waimea (Kamuela) | A historical town in the heart of Hawaii, offering a unique blend of cowboy culture and lush landscapes. Ideal for travelers looking for an authentic experience with local farms and ranches. | Waimea Town Market, Kohala Mountain, Parker Ranch, Waimea Valley, Pololu Valley |
| North Kohala | A scenic area with stunning views and a slower pace of life, perfect for guests looking to explore Hawaii’s natural beauty and historical sites. | Pololu Valley Lookout, Mahana Beach, Kapa’au, King Kamehameha Statue, Kohala Historical Society |
| Captain Cook | A quaint town located near historical sites and beautiful beaches. A great spot for those who enjoy outdoor activities such as snorkeling and hiking. | Kealakekua Bay, Pu’uhonua O Hōnaunau National Historical Park, Greenwell Farms, Captain Cook Monument, Ka’awaloa Trail |
Understanding Airbnb License Requirements & STR Laws in Ainaloa CDP (2026)
With 20% of listings showing registration in 2026, understanding potential Airbnb license requirements is crucial in Ainaloa CDP. Always verify the latest short term rental regulations and Airbnb license requirements directly with local government authorities for Ainaloa CDP to ensure full compliance before hosting.
(Source: AirROI data, 2026, based on 20% licensed listings)
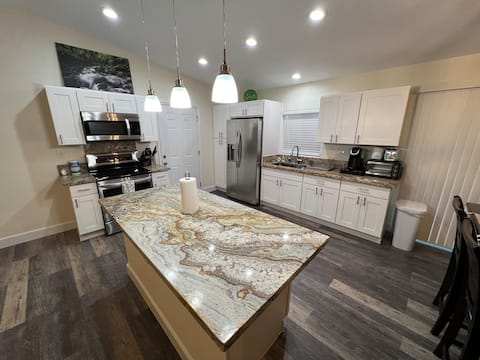
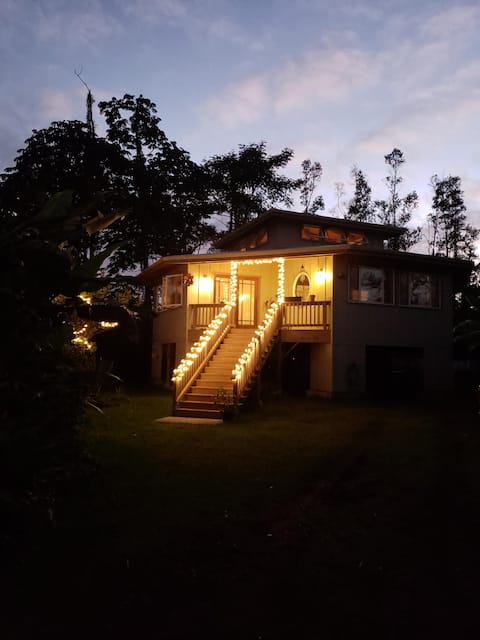
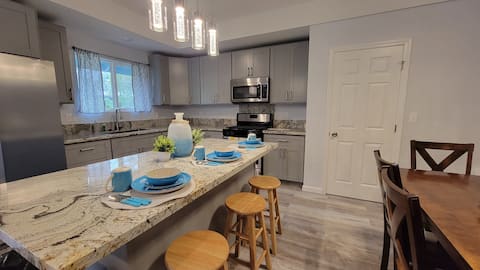
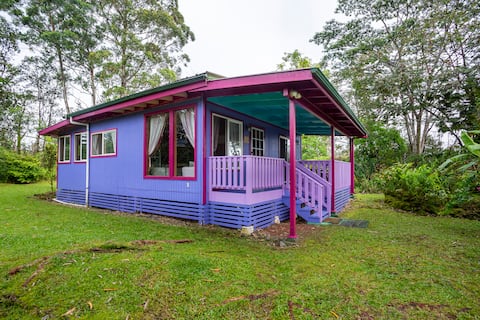
Top Performing Airbnb Properties in Ainaloa CDP (2026)
Benchmark your potential! Explore examples of top-performing Airbnb properties in Ainaloa CDPbased on Trailing Twelve Month (TTM) revenue. Analyze their characteristics, revenue, occupancy rate, and ADR to understand what drives success in this market.
Home away from home
Entire Place • 3 bedrooms

“The Pahoa cabin”
Entire Place • 2 bedrooms
Bonsai Bungalow
Entire Place • 2 bedrooms
Aloha! Newer Home on Hawaii Island (Big Island)
Entire Place • 3 bedrooms
Hibiscus Cottage - Private Puna Rainforest
Entire Place • 1 bedroom
KopeHale2 Tiny Coffee Farmhouse between Hilo & NPS
Entire Place • 1 bedroom
Note: Performance varies based on location, size, amenities, seasonality, and management quality. Data reflects the past 12 months.
Top Performing Airbnb Hosts in Ainaloa CDP (2026)
Learn from the best! This table showcases top-performing Airbnb hosts in Ainaloa CDP based on the number of properties managed and estimated total revenue over the past year. Analyze their scale and performance metrics.
| Host Name | Properties | Grossing Revenue | Stay Reviews | Avg Rating |
|---|---|---|---|---|
| Justin | 1 | $44,397 | 81 | 4.83/5.0 |
| Ashley | 1 | $42,423 | 22 | 4.95/5.0 |
| Bodhi Land | 2 | $38,237 | 61 | 4.91/5.0 |
| James | 3 | $37,925 | 27 | 4.93/5.0 |
| Kimberly And Dallas | 1 | $36,089 | 217 | 4.97/5.0 |
| Kj | 1 | $35,561 | 89 | 4.97/5.0 |
| Emily | 1 | $33,047 | 193 | 4.87/5.0 |
| Ferdinand | 1 | $25,224 | 180 | 4.85/5.0 |
| Erin | 1 | $24,643 | 44 | 4.80/5.0 |
| Sharon | 3 | $22,212 | 77 | 4.86/5.0 |
Analyzing the strategies of top hosts, such as their property selection, pricing, and guest communication, can offer valuable lessons for optimizing your own Airbnb operations in Ainaloa CDP.
Dive Deeper: Advanced Ainaloa CDP STR Market Data (2026)
Ready to unlock more insights? AirROI provides access to advanced metrics and comprehensive Airbnb data for Ainaloa CDP. Explore detailed analytics beyond this report to refine your investment strategy, optimize pricing, and maximize your vacation rental profits.
Explore Advanced MetricsAinaloa CDP Short-Term Rental Market Composition (2026): Property & Room Types
Room Type Distribution
Property Type Distribution
Market Composition Insights for Ainaloa CDP
- The Ainaloa CDP Airbnb market composition is heavily skewed towards Entire Home/Apt listings, which make up 68% of the 25 active rentals. This indicates strong guest preference for privacy and space.
- However, a notable 32% share for Private Rooms suggests opportunities for budget-conscious travelers or hosts renting out spare rooms.
- Looking at the property type distribution in Ainaloa CDP, House properties are the most common (80%), reflecting the local real estate landscape.
- Houses represent a significant 80% portion, catering likely to families or larger groups.
- The presence of 8% Hotel/Boutique listings indicates integration with traditional hospitality.
- Smaller segments like others (combined 4.0%) offer potential for unique stay experiences.
Ainaloa CDP Airbnb Room Capacity Analysis (2026): Bedroom Distribution
Distribution of Listings by Number of Bedrooms
Room Capacity Insights for Ainaloa CDP
- The dominant room capacity in Ainaloa CDP is 1 bedroom listings, making up 24% of the market. This suggests a strong demand for properties suitable for couples or solo travelers.
- Together, 1 bedroom and 3 bedrooms properties represent 48.0% of the active Airbnb listings in Ainaloa CDP, indicating a high concentration in these sizes.
- A significant 24.0% of listings offer 3+ bedrooms, catering to larger groups and families seeking more space in Ainaloa CDP.
Ainaloa CDP Vacation Rental Guest Capacity Trends (2026)
Distribution of Listings by Guest Capacity
Guest Capacity Insights for Ainaloa CDP
- The most common guest capacity trend in Ainaloa CDP vacation rentals is listings accommodating 4 guests (20%). This suggests the primary traveler segment is likely small families or groups.
- Properties designed for 4 guests and 2 guests dominate the Ainaloa CDP STR market, accounting for 40.0% of listings.
- 24.0% of properties accommodate 6+ guests, serving the market segment for larger families or group travel in Ainaloa CDP.
- On average, properties in Ainaloa CDP are equipped to host 3.0 guests.
Ainaloa CDP Airbnb Booking Patterns (2026): Available vs. Booked Days
Available Days Distribution
Booked Days Distribution
Booking Pattern Insights for Ainaloa CDP
- The most common availability pattern in Ainaloa CDP falls within the 271-366 days range, representing 36% of listings. This suggests many properties have significant open periods on their calendars.
- Approximately 56.0% of listings show high availability (181+ days open annually), indicating potential for increased bookings or specific owner usage patterns.
- For booked days, the 181-270 days range is most frequent in Ainaloa CDP (36%), reflecting common guest stay durations or potential owner blocking patterns.
- A notable 48.0% of properties secure long booking periods (181+ days booked per year), highlighting successful long-term rental strategies or significant owner usage.
Ainaloa CDP Airbnb Minimum Stay Requirements Analysis
Distribution of Listings by Minimum Night Requirement
1 Night
7 listings
28% of total
2 Nights
3 listings
12% of total
3 Nights
5 listings
20% of total
30+ Nights
10 listings
40% of total
Key Insights
- The most prevalent minimum stay requirement in Ainaloa CDP is 30+ Nights, adopted by 40% of listings. This highlights the market's preference for longer commitments.
- A significant segment (40%) caters to monthly stays (30+ nights) in Ainaloa CDP, pointing to opportunities in the extended-stay market.
Recommendations
- Align with the market by considering a 30+ Nights minimum stay, as 40% of Ainaloa CDP hosts use this setting.
- If feasible, allowing 1-night stays, especially midweek or during low season, could capture last-minute bookings, as only 28% currently do.
- Explore offering discounts for stays of 30+ nights to attract the 40% of the market seeking extended stays.
- Adjust minimum nights based on seasonality – potentially shorter during low season and longer during peak demand periods in Ainaloa CDP.
Ainaloa CDP Airbnb Cancellation Policy Trends Analysis (2026)
Flexible
8 listings
32% of total
Moderate
8 listings
32% of total
Firm
6 listings
24% of total
Strict
3 listings
12% of total
Cancellation Policy Insights for Ainaloa CDP
- The prevailing Airbnb cancellation policy trend in Ainaloa CDP is Flexible, used by 32% of listings.
- There's a relatively balanced mix between guest-friendly (64.0%) and stricter (36.0%) policies, offering choices for different guest needs.
Recommendations for Hosts
- Consider adopting a Flexible policy to align with the 32% market standard in Ainaloa CDP.
- Using a Strict policy might deter some guests, as only 12% of listings use it. Evaluate if potential revenue protection outweighs possible lower booking rates.
- Regularly review your cancellation policy against competitors and market demand shifts in Ainaloa CDP.
Ainaloa CDP STR Booking Lead Time Analysis (2026)
Average Booking Lead Time by Month
Booking Lead Time Insights for Ainaloa CDP
- The overall average booking lead time for vacation rentals in Ainaloa CDP is 40 days.
- Guests book furthest in advance for stays during December (average 65 days), likely coinciding with peak travel demand or local events.
- The shortest booking windows occur for stays in May (average 35 days), indicating more last-minute travel plans during this time.
- Seasonally, Winter (53 days avg.) sees the longest lead times, while Spring (40 days avg.) has the shortest, reflecting typical travel planning cycles.
Recommendations for Hosts
- Use the overall average lead time (40 days) as a baseline for your pricing and availability strategy in Ainaloa CDP.
- For December stays, consider implementing length-of-stay discounts or slightly higher rates for bookings made less than 65 days out to capitalize on advance planning.
- Target marketing efforts for the Winter season well in advance (at least 53 days) to capture early planners.
- Monitor your own booking lead times against these Ainaloa CDP averages to identify opportunities for dynamic pricing adjustments.
Popular & Essential Airbnb Amenities in Ainaloa CDP (2026)
Amenity Prevalence
Amenity Insights for Ainaloa CDP
- Essential amenities in Ainaloa CDP that guests expect include: Free parking on premises, Wifi, Bed linens, Dishes and silverware, Hangers, Hot water. Lacking these (any) could significantly impact bookings.
- Popular amenities like Smoke alarm, Coffee maker, Kitchen are common but not universal. Offering these can provide a competitive edge.
Recommendations for Hosts
- Ensure your listing includes all essential amenities for Ainaloa CDP: Free parking on premises, Wifi, Bed linens, Dishes and silverware, Hangers, Hot water.
- Prioritize adding missing essentials: Bed linens, Dishes and silverware, Hangers, Hot water.
- Consider adding popular differentiators like Smoke alarm or Coffee maker to increase appeal.
- Highlight unique or less common amenities you offer (e.g., hot tub, dedicated workspace, EV charger) in your listing description and photos.
- Regularly check competitor amenities in Ainaloa CDP to stay competitive.
Ainaloa CDP Airbnb Guest Demographics & Profile Analysis (2026)
Guest Profile Summary for Ainaloa CDP
- The typical guest profile for Airbnb in Ainaloa CDP consists of primarily domestic travelers (81%), often arriving from nearby New York, typically belonging to the Post-2000s (Gen Z/Alpha) group (50%), primarily speaking English or Spanish.
- Domestic travelers account for 81.3% of guests.
- Key international markets include United States (81.3%) and Canada (3%).
- Top languages spoken are English (57.4%) followed by Spanish (11.5%).
- A significant demographic segment is the Post-2000s (Gen Z/Alpha) group, representing 50% of guests.
Recommendations for Hosts
- Target domestic marketing efforts towards travelers from New York and Seattle.
- Tailor amenities and listing descriptions to appeal to the dominant Post-2000s (Gen Z/Alpha) demographic (e.g., highlight fast WiFi, smart home features, local guides).
- Highlight unique local experiences or amenities relevant to the primary guest profile.
- Consider seasonal promotions aligned with peak travel times for key origin markets.
Nearby Short-Term Rental Market Comparison
How does the Ainaloa CDP Airbnb market stack up against its neighbors? Compare key performance metrics like average monthly revenue, ADR, and occupancy rates in surrounding areas to understand the broader regional STR landscape.
| Market | Active Properties | Monthly Revenue | Daily Rate | Avg. Occupancy |
|---|---|---|---|---|
| Waimea | 416 | $8,098 | $819.38 | 43% |
| Puakō | 62 | $7,820 | $874.88 | 44% |
| Hana | 68 | $7,791 | $413.38 | 65% |
| Honalo | 24 | $7,044 | $410.83 | 56% |
| Waikoloa Beach Resort | 27 | $6,060 | $544.82 | 46% |
| Kamuela | 93 | $5,561 | $1009.77 | 30% |
| Wainaku | 21 | $4,722 | $344.15 | 49% |
| Kahaluu-Keauhou | 767 | $4,704 | $402.19 | 45% |
| Kailua-Kona | 364 | $4,330 | $431.23 | 51% |
| Kapalaoa | 366 | $4,260 | $423.53 | 43% |