Trumbull Airbnb Market Analysis 2025: Short Term Rental Data & Vacation Rental Statistics in Greater Bridgeport Planning Region, United States
Is Airbnb profitable in Trumbull in 2025? Explore comprehensive Airbnb analytics for Trumbull, Greater Bridgeport Planning Region, United States to uncover income potential. This 2025 STR market report for Trumbull, based on AirROI data from December 2024 to November 2025, reveals key trends in the niche market of 21 active listings.
Whether you're considering an Airbnb investment in Trumbull, optimizing your existing vacation rental, or exploring rental arbitrage opportunities, understanding the Trumbull Airbnb data is crucial. Leveraging the low regulation environment is key to maximizing your short term rental income potential. Let's dive into the specifics.
Key Trumbull Airbnb Performance Metrics Overview
Monthly Airbnb Revenue Variations & Income Potential in Trumbull (2025)
Understanding the monthly revenue variations for Airbnb listings in Trumbull is key to maximizing your short term rental income potential. Seasonality significantly impacts earnings. Our analysis, based on data from the past 12 months, shows that the peak revenue month for STRs in Trumbull is typically August, while March often presents the lowest earnings, highlighting opportunities for strategic pricing adjustments during shoulder and low seasons. Explore the typical Airbnb income in Trumbull across different performance tiers:
- Best-in-class properties (Top 10%) achieve $7,956+ monthly, often utilizing dynamic pricing and superior guest experiences.
- Strong performing properties (Top 25%) earn $4,010 or more, indicating effective management and desirable locations/amenities.
- Typical properties (Median) generate around $1,721 per month, representing the average market performance.
- Entry-level properties (Bottom 25%) see earnings around $471, often with potential for optimization.
Average Monthly Airbnb Earnings Trend in Trumbull
Trumbull Airbnb Occupancy Rate Trends (2025)
Maximize your bookings by understanding the Trumbull STR occupancy trends. Seasonal demand shifts significantly influence how often properties are booked. Typically, Augustsees the highest demand (peak season occupancy), while March experiences the lowest (low season). Effective strategies, like adjusting minimum stays or offering promotions, can boost occupancy during slower periods. Here's how different property tiers perform in Trumbull:
- Best-in-class properties (Top 10%) achieve 74%+ occupancy, indicating high desirability and potentially optimized availability.
- Strong performing properties (Top 25%) maintain 60% or higher occupancy, suggesting good market fit and guest satisfaction.
- Typical properties (Median) have an occupancy rate around 36%.
- Entry-level properties (Bottom 25%) average 14% occupancy, potentially facing higher vacancy.
Average Monthly Occupancy Rate Trend in Trumbull
Average Daily Rate (ADR) Airbnb Trends in Trumbull (2025)
Effective short term rental pricing strategy in Trumbull involves understanding monthly ADR fluctuations. The Average Daily Rate (ADR) for Airbnb in Trumbull typically peaks in July and dips lowest during March. Leveraging Airbnb dynamic pricing tools or strategies based on this seasonality can significantly boost revenue. Here's a look at the typical nightly rates achieved:
- Best-in-class properties (Top 10%) command rates of $364+ per night, often due to premium features or locations.
- Strong performing properties (Top 25%) achieve nightly rates of $254 or more.
- Typical properties (Median) charge around $113 per night.
- Entry-level properties (Bottom 25%) earn around $54 per night.
Average Daily Rate (ADR) Trend by Month in Trumbull
Get Live Trumbull Market Intelligence 👇

Explore Real-time Analytics
Airbnb Seasonality Analysis & Trends in Trumbull (2025)
Peak Season (August, June, July)
- Revenue averages $3,932 per month
- Occupancy rates average 49.1%
- Daily rates average $193
Shoulder Season
- Revenue averages $2,715 per month
- Occupancy maintains around 38.1%
- Daily rates hold near $177
Low Season (January, March, December)
- Revenue drops to average $2,119 per month
- Occupancy decreases to average 31.1%
- Daily rates adjust to average $168
Seasonality Insights for Trumbull
- The Airbnb seasonality in Trumbull shows highly seasonal trends requiring careful strategy. While the sections above show seasonal averages, it's also insightful to look at the extremes:
- During the high season, the absolute peak month showcases Trumbull's highest earning potential, with monthly revenues capable of climbing to $4,556, occupancy reaching a high of 53.8%, and ADRs peaking at $208.
- Conversely, the slowest single month of the year, typically falling within the low season, marks the market's lowest point. In this month, revenue might dip to $1,889, occupancy could drop to 27.9%, and ADRs may adjust down to $164.
- Understanding both the seasonal averages and these monthly peaks and troughs in revenue, occupancy, and ADR is crucial for maximizing your Airbnb profit potential in Trumbull.
Seasonal Strategies for Maximizing Profit
- Peak Season: Maximize revenue through premium pricing and potentially longer minimum stays. Ensure high availability.
- Low Season: Offer competitive pricing, special promotions (e.g., extended stay discounts), and flexible cancellation policies. Target off-season travelers like remote workers or budget-conscious guests.
- Shoulder Seasons: Implement dynamic pricing that balances peak and low rates. Target weekend travelers or specific events. Offer slightly more flexible terms than peak season.
- Regularly analyze your own performance against these Trumbull seasonality benchmarks and adjust your pricing and availability strategy accordingly.
Best Areas for Airbnb Investment in Trumbull (2025)
Exploring the top neighborhoods for short-term rentals in Trumbull? This section highlights key areas, outlining why they are attractive for hosts and guests, along with notable local attractions. Consider these locations based on your target guest profile and investment strategy.
| Neighborhood / Area | Why Host Here? (Target Guests & Appeal) | Key Attractions & Landmarks |
|---|---|---|
| Trumbull Center | The heart of Trumbull, offering access to amenities, schools, and parks. Great for families and long-term visitors wanting a suburban feel with shopping and dining options nearby. | Trumbull Mall, Twin Brooks Park, Silvermans Farm, Trumbull Town Hall, Lake Mohegan |
| Madison | A charming area with a small-town vibe, close to outdoor activities and local shops. Attracts guests looking for a peaceful retreat with easy access to nature. | Madison Beach, Hammonasset Beach State Park, Scranton Memorial Library, Madison Historical Society, Surf Club |
| Long Hill | A picturesque residential area known for its scenic views and spacious homes, ideal for families or those seeking tranquility near urban conveniences. | Long Hill Nature Preserve, Old Mine Park, Trumbull Historical Society, Bunnell Park |
| Huntington | A vibrant community with a mix of suburban and rural charm. Excellent for those who want proximity to parks and nature while still being close to city amenities. | Huntington State Park, Twin Brooks Park, Great Lawn, Huntington Green |
| Trumbull Shopping Park | Offers a diverse selection of shops and dining options, making it a great spot for visitors looking to enjoy local food and retail. | Trumbull Shopping Park, Target, HomeGoods, JCPenney, Dunkin' |
| Westfield Trumbull | A modern shopping center that attracts visitors looking for retail therapy and entertainment options, ideal for short stays with convenience. | Westfield Trumbull Mall, Bow Tie Cinemas, Parks and Recreation Department, food courts |
| Tashua | Family-friendly neighborhood with access to recreational facilities and parks, popular with guests seeking a quiet place to stay. | Tashua Knolls Golf Course, Tashua Park, Bunnell Park, local eateries |
| East Trumbull | Emerging area known for its appealing housing options and proximity to good schools. Great for families with children or those looking for a suburban experience. | East Trumbull Park, Canterbury School, local shops, nature trails |
Understanding Airbnb License Requirements & STR Laws in Trumbull (2025)
While Trumbull, Greater Bridgeport Planning Region, United States currently shows low STR regulations, specific Airbnb license requirements might still exist or change. Always verify the latest short term rental regulations and Airbnb license requirements directly with local government authorities for Trumbull to ensure full compliance before hosting.
(Source: AirROI data, 2025, finding no licensed listings among those analyzed)
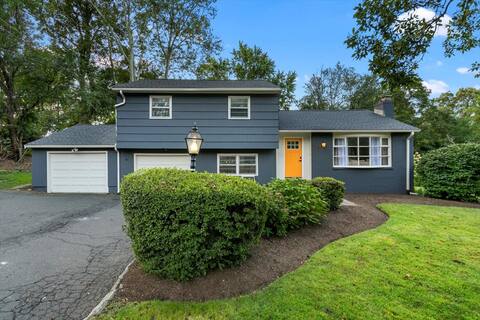
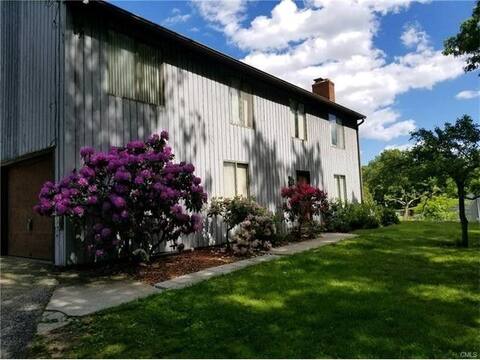
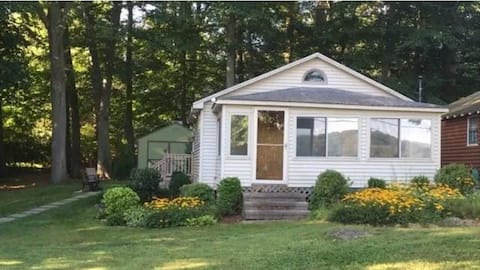
Top Performing Airbnb Properties in Trumbull (2025)
Benchmark your potential! Explore examples of top-performing Airbnb properties in Trumbullbased on Trailing Twelve Month (TTM) revenue. Analyze their characteristics, revenue, occupancy rate, and ADR to understand what drives success in this market.

Beautiful House to relax with the Family.
Entire Place • 6 bedrooms
Cozy, updated single family in Fairfield County
Entire Place • 3 bedrooms

The Elijah Sterling House
Entire Place • 3 bedrooms
Kid/Baby-Friendly 3BD + In-Law Studio w Large Yard
Entire Place • 4 bedrooms

Cozy in laws suite in the woods
Entire Place • 1 bedroom
Rustic cabin with spectacular lake view
Entire Place • 1 bedroom
Note: Performance varies based on location, size, amenities, seasonality, and management quality. Data reflects the past 12 months.
Top Performing Airbnb Hosts in Trumbull (2025)
Learn from the best! This table showcases top-performing Airbnb hosts in Trumbull based on the number of properties managed and estimated total revenue over the past year. Analyze their scale and performance metrics.
| Host Name | Properties | Grossing Revenue | Stay Reviews | Avg Rating |
|---|---|---|---|---|
| Ivana | 1 | $91,782 | 42 | 4.88/5.0 |
| Jennifer | 1 | $87,234 | 44 | 5.00/5.0 |
| Rosemarie | 1 | $75,922 | 58 | 4.98/5.0 |
| Cassie | 1 | $45,842 | 33 | 4.67/5.0 |
| Diana | 1 | $30,018 | 27 | 4.93/5.0 |
| Michele | 1 | $29,462 | 86 | 4.94/5.0 |
| Rezan | 1 | $29,094 | 248 | 4.82/5.0 |
| Karleen | 1 | $27,256 | 61 | 4.92/5.0 |
| Tran | 1 | $23,490 | 56 | 4.96/5.0 |
| Lissenellys | 1 | $14,341 | 35 | 4.97/5.0 |
Analyzing the strategies of top hosts, such as their property selection, pricing, and guest communication, can offer valuable lessons for optimizing your own Airbnb operations in Trumbull.
Dive Deeper: Advanced Trumbull STR Market Data (2025)
Ready to unlock more insights? AirROI provides access to advanced metrics and comprehensive Airbnb data for Trumbull. Explore detailed analytics beyond this report to refine your investment strategy, optimize pricing, and maximize your vacation rental profits.
Explore Advanced MetricsTrumbull Short-Term Rental Market Composition (2025): Property & Room Types
Room Type Distribution
Property Type Distribution
Market Composition Insights for Trumbull
- The Trumbull Airbnb market composition is heavily skewed towards Entire Home/Apt listings, which make up 57.1% of the 21 active rentals. This indicates strong guest preference for privacy and space.
- However, a notable 42.9% share for Private Rooms suggests opportunities for budget-conscious travelers or hosts renting out spare rooms.
- Looking at the property type distribution in Trumbull, House properties are the most common (76.2%), reflecting the local real estate landscape.
- Houses represent a significant 76.2% portion, catering likely to families or larger groups.
- Smaller segments like hotel/boutique, outdoor/unique, apartment/condo (combined 14.4%) offer potential for unique stay experiences.
Trumbull Airbnb Room Capacity Analysis (2025): Bedroom Distribution
Distribution of Listings by Number of Bedrooms
Room Capacity Insights for Trumbull
- The dominant room capacity in Trumbull is 1 bedroom listings, making up 33.3% of the market. This suggests a strong demand for properties suitable for couples or solo travelers.
- Together, 1 bedroom and 3 bedrooms properties represent 47.6% of the active Airbnb listings in Trumbull, indicating a high concentration in these sizes.
- A significant 28.6% of listings offer 3+ bedrooms, catering to larger groups and families seeking more space in Trumbull.
Trumbull Vacation Rental Guest Capacity Trends (2025)
Distribution of Listings by Guest Capacity
Guest Capacity Insights for Trumbull
- The most common guest capacity trend in Trumbull vacation rentals is listings accommodating 2 guests (19%). This suggests the primary traveler segment is likely couples or solo travelers.
- Properties designed for 2 guests and 8+ guests dominate the Trumbull STR market, accounting for 38.0% of listings.
- 28.6% of properties accommodate 6+ guests, serving the market segment for larger families or group travel in Trumbull.
- On average, properties in Trumbull are equipped to host 3.2 guests.
Trumbull Airbnb Booking Patterns (2025): Available vs. Booked Days
Available Days Distribution
Booked Days Distribution
Booking Pattern Insights for Trumbull
- The most common availability pattern in Trumbull falls within the 271-366 days range, representing 47.6% of listings. This suggests many properties have significant open periods on their calendars.
- Approximately 76.2% of listings show high availability (181+ days open annually), indicating potential for increased bookings or specific owner usage patterns.
- For booked days, the 91-180 days range is most frequent in Trumbull (28.6%), reflecting common guest stay durations or potential owner blocking patterns.
- A notable 23.8% of properties secure long booking periods (181+ days booked per year), highlighting successful long-term rental strategies or significant owner usage.
Trumbull Airbnb Minimum Stay Requirements Analysis
Distribution of Listings by Minimum Night Requirement
1 Night
3 listings
14.3% of total
2 Nights
8 listings
38.1% of total
3 Nights
1 listings
4.8% of total
4-6 Nights
2 listings
9.5% of total
7-29 Nights
2 listings
9.5% of total
30+ Nights
5 listings
23.8% of total
Key Insights
- The most prevalent minimum stay requirement in Trumbull is 2 Nights, adopted by 38.1% of listings. This highlights the market's preference for shorter, flexible bookings.
- A significant segment (23.8%) caters to monthly stays (30+ nights) in Trumbull, pointing to opportunities in the extended-stay market.
Recommendations
- Align with the market by considering a 2 Nights minimum stay, as 38.1% of Trumbull hosts use this setting.
- If feasible, allowing 1-night stays, especially midweek or during low season, could capture last-minute bookings, as only 14.3% currently do.
- A 2-night minimum appears standard (38.1%). Consider this for weekends or peak periods.
- Explore offering discounts for stays of 30+ nights to attract the 23.8% of the market seeking extended stays.
- Adjust minimum nights based on seasonality – potentially shorter during low season and longer during peak demand periods in Trumbull.
Trumbull Airbnb Cancellation Policy Trends Analysis (2025)
Flexible
8 listings
40% of total
Moderate
1 listings
5% of total
Firm
10 listings
50% of total
Strict
1 listings
5% of total
Cancellation Policy Insights for Trumbull
- The prevailing Airbnb cancellation policy trend in Trumbull is Firm, used by 50% of listings.
- A majority (55.0%) of hosts in Trumbull utilize Firm or Strict policies, indicating a market where hosts prioritize booking security.
- Strict cancellation policies are quite rare (5%), potentially making listings with this policy less competitive unless justified by high demand or property type.
Recommendations for Hosts
- Consider adopting a Firm policy to align with the 50% market standard in Trumbull.
- Using a Strict policy might deter some guests, as only 5% of listings use it. Evaluate if potential revenue protection outweighs possible lower booking rates.
- Regularly review your cancellation policy against competitors and market demand shifts in Trumbull.
Trumbull STR Booking Lead Time Analysis (2025)
Average Booking Lead Time by Month
Booking Lead Time Insights for Trumbull
- The overall average booking lead time for vacation rentals in Trumbull is 41 days.
- Guests book furthest in advance for stays during July (average 72 days), likely coinciding with peak travel demand or local events.
- The shortest booking windows occur for stays in January (average 15 days), indicating more last-minute travel plans during this time.
- Seasonally, Summer (65 days avg.) sees the longest lead times, while Winter (29 days avg.) has the shortest, reflecting typical travel planning cycles.
Recommendations for Hosts
- Use the overall average lead time (41 days) as a baseline for your pricing and availability strategy in Trumbull.
- For July stays, consider implementing length-of-stay discounts or slightly higher rates for bookings made less than 72 days out to capitalize on advance planning.
- Target marketing efforts for the Summer season well in advance (at least 65 days) to capture early planners.
- Monitor your own booking lead times against these Trumbull averages to identify opportunities for dynamic pricing adjustments.
Popular & Essential Airbnb Amenities in Trumbull (2025)
Amenity Prevalence
Amenity Insights for Trumbull
- Essential amenities in Trumbull that guests expect include: Free parking on premises, TV. Lacking these (any) could significantly impact bookings.
- Popular amenities like Smoke alarm, Wifi, Carbon monoxide alarm are common but not universal. Offering these can provide a competitive edge.
- Warning: Wifi is not universally provided but is considered essential globally. Ensure reliable Wifi is offered.
Recommendations for Hosts
- Ensure your listing includes all essential amenities for Trumbull: Free parking on premises, TV.
- Prioritize adding missing essentials: TV.
- Consider adding popular differentiators like Smoke alarm or Wifi to increase appeal.
- Highlight unique or less common amenities you offer (e.g., hot tub, dedicated workspace, EV charger) in your listing description and photos.
- Regularly check competitor amenities in Trumbull to stay competitive.
Trumbull Airbnb Guest Demographics & Profile Analysis (2025)
Guest Profile Summary for Trumbull
- The typical guest profile for Airbnb in Trumbull consists of primarily domestic travelers (95%), often arriving from nearby New York, typically belonging to the Post-2000s (Gen Z/Alpha) group (50%), primarily speaking English or Spanish.
- Domestic travelers account for 95.3% of guests.
- Key international markets include United States (95.3%) and DC (1.9%).
- Top languages spoken are English (67.8%) followed by Spanish (16.9%).
- A significant demographic segment is the Post-2000s (Gen Z/Alpha) group, representing 50% of guests.
Recommendations for Hosts
- Target domestic marketing efforts towards travelers from New York and Jacksonville.
- Tailor amenities and listing descriptions to appeal to the dominant Post-2000s (Gen Z/Alpha) demographic (e.g., highlight fast WiFi, smart home features, local guides).
- Highlight unique local experiences or amenities relevant to the primary guest profile.
- Consider seasonal promotions aligned with peak travel times for key origin markets.
Nearby Short-Term Rental Market Comparison
How does the Trumbull Airbnb market stack up against its neighbors? Compare key performance metrics like average monthly revenue, ADR, and occupancy rates in surrounding areas to understand the broader regional STR landscape.
| Market | Active Properties | Monthly Revenue | Daily Rate | Avg. Occupancy |
|---|---|---|---|---|
| Frankford Township | 12 | $6,112 | $492.62 | 41% |
| Town of Ancram | 22 | $6,100 | $535.64 | 38% |
| Spring Lake Heights | 16 | $6,072 | $743.21 | 40% |
| Town of East Hampton | 1,345 | $5,787 | $1003.01 | 33% |
| Winchendon | 12 | $5,701 | $383.75 | 47% |
| Town of Kingston | 12 | $5,672 | $470.26 | 44% |
| Town of Southampton | 1,208 | $5,612 | $997.32 | 32% |
| Town of Monroe | 23 | $5,605 | $736.01 | 38% |
| Monmouth Beach | 12 | $5,285 | $682.81 | 38% |
| Town of Stillwater | 56 | $5,257 | $572.88 | 41% |