Bridgeport Airbnb Market Analysis 2026: Short Term Rental Data & Vacation Rental Statistics in Greater Bridgeport Planning Region, United States
Is Airbnb profitable in Bridgeport in 2026? Explore comprehensive Airbnb analytics for Bridgeport, Greater Bridgeport Planning Region, United States to uncover income potential. This 2026 STR market report for Bridgeport, based on AirROI data from February 2025 to January 2026, reveals key trends in the niche market of 131 active listings.
Whether you're considering an Airbnb investment in Bridgeport, optimizing your existing vacation rental, or exploring rental arbitrage opportunities, understanding the Bridgeport Airbnb data is crucial. Leveraging the low regulation environment is key to maximizing your short term rental income potential. Let's dive into the specifics.
Key Bridgeport Airbnb Performance Metrics Overview
Monthly Airbnb Revenue Variations & Income Potential in Bridgeport (2026)
Understanding the monthly revenue variations for Airbnb listings in Bridgeport is key to maximizing your short term rental income potential. Seasonality significantly impacts earnings. Our analysis, based on data from the past 12 months, shows that the peak revenue month for STRs in Bridgeport is typically August, while January often presents the lowest earnings, highlighting opportunities for strategic pricing adjustments during shoulder and low seasons. Explore the typical Airbnb income in Bridgeport across different performance tiers:
- Best-in-class properties (Top 10%) achieve $4,076+ monthly, often utilizing dynamic pricing and superior guest experiences.
- Strong performing properties (Top 25%) earn $2,521 or more, indicating effective management and desirable locations/amenities.
- Typical properties (Median) generate around $1,447 per month, representing the average market performance.
- Entry-level properties (Bottom 25%) see earnings around $632, often with potential for optimization.
Average Monthly Airbnb Earnings Trend in Bridgeport
Bridgeport Airbnb Occupancy Rate Trends (2026)
Maximize your bookings by understanding the Bridgeport STR occupancy trends. Seasonal demand shifts significantly influence how often properties are booked. Typically, Augustsees the highest demand (peak season occupancy), while January experiences the lowest (low season). Effective strategies, like adjusting minimum stays or offering promotions, can boost occupancy during slower periods. Here's how different property tiers perform in Bridgeport:
- Best-in-class properties (Top 10%) achieve 75%+ occupancy, indicating high desirability and potentially optimized availability.
- Strong performing properties (Top 25%) maintain 57% or higher occupancy, suggesting good market fit and guest satisfaction.
- Typical properties (Median) have an occupancy rate around 36%.
- Entry-level properties (Bottom 25%) average 18% occupancy, potentially facing higher vacancy.
Average Monthly Occupancy Rate Trend in Bridgeport
Average Daily Rate (ADR) Airbnb Trends in Bridgeport (2026)
Effective short term rental pricing strategy in Bridgeport involves understanding monthly ADR fluctuations. The Average Daily Rate (ADR) for Airbnb in Bridgeport typically peaks in September and dips lowest during March. Leveraging Airbnb dynamic pricing tools or strategies based on this seasonality can significantly boost revenue. Here's a look at the typical nightly rates achieved:
- Best-in-class properties (Top 10%) command rates of $307+ per night, often due to premium features or locations.
- Strong performing properties (Top 25%) achieve nightly rates of $185 or more.
- Typical properties (Median) charge around $110 per night.
- Entry-level properties (Bottom 25%) earn around $68 per night.
Average Daily Rate (ADR) Trend by Month in Bridgeport
Get Live Bridgeport Market Intelligence 👇

Explore Real-time Analytics
Airbnb Seasonality Analysis & Trends in Bridgeport (2026)
Peak Season (August, November, June)
- Revenue averages $2,243 per month
- Occupancy rates average 44.1%
- Daily rates average $155
Shoulder Season
- Revenue averages $1,932 per month
- Occupancy maintains around 37.6%
- Daily rates hold near $153
Low Season (January, February, March)
- Revenue drops to average $1,464 per month
- Occupancy decreases to average 37.7%
- Daily rates adjust to average $138
Seasonality Insights for Bridgeport
- The Airbnb seasonality in Bridgeport shows moderate seasonality with distinct peak and low periods. While the sections above show seasonal averages, it's also insightful to look at the extremes:
- During the high season, the absolute peak month showcases Bridgeport's highest earning potential, with monthly revenues capable of climbing to $2,302, occupancy reaching a high of 46.7%, and ADRs peaking at $166.
- Conversely, the slowest single month of the year, typically falling within the low season, marks the market's lowest point. In this month, revenue might dip to $1,337, occupancy could drop to 31.0%, and ADRs may adjust down to $128.
- Understanding both the seasonal averages and these monthly peaks and troughs in revenue, occupancy, and ADR is crucial for maximizing your Airbnb profit potential in Bridgeport.
Seasonal Strategies for Maximizing Profit
- Peak Season: Maximize revenue through premium pricing and potentially longer minimum stays. Ensure high availability.
- Low Season: Offer competitive pricing, special promotions (e.g., extended stay discounts), and flexible cancellation policies. Target off-season travelers like remote workers or budget-conscious guests.
- Shoulder Seasons: Implement dynamic pricing that balances peak and low rates. Target weekend travelers or specific events. Offer slightly more flexible terms than peak season.
- Regularly analyze your own performance against these Bridgeport seasonality benchmarks and adjust your pricing and availability strategy accordingly.
Best Areas for Airbnb Investment in Bridgeport (2026)
Exploring the top neighborhoods for short-term rentals in Bridgeport? This section highlights key areas, outlining why they are attractive for hosts and guests, along with notable local attractions. Consider these locations based on your target guest profile and investment strategy.
| Neighborhood / Area | Why Host Here? (Target Guests & Appeal) | Key Attractions & Landmarks |
|---|---|---|
| Downtown Bridgeport | The central business district of Bridgeport, featuring a mix of cultural attractions, restaurants, and nightlife. It is an ideal location for urban tourists and business travelers seeking convenience to amenities and local events. | Barnum Museum, Bridgeport Symphony Orchestra, Discovery Museum, Federal Hill Historic District, University of Bridgeport |
| Seaside Park | A scenic waterfront area with beautiful parks and beaches, popular with families and outdoor enthusiasts. This location is great for guests looking to enjoy nature, picnics, and outdoor activities by the water. | Seaside Park, Bridgeport Lighthouse, Ansonia Nature Center, Long Island Sound, Various beaches and picnic areas |
| Black Rock | A charming, historic neighborhood known for its quaint streets, local shops, and close-knit community vibe. Black Rock has a suburban feel while still being in proximity to downtown, appealing to guests looking for a quieter stay. | Cardinal Shehan Center, Black Rock Harbor, St. Mary's by the Sea, Local boutiques and cafes, Black Rock Shopping Center |
| East End | A diverse and vibrant community with a burgeoning arts scene. The East End is known for its cultural attractions and is ideal for guests interested in local history and the arts. | McLevy Hall, Howe Park, East End Arts District, The Bijou Theatre, East Bridgeport Community Center |
| West End | This neighborhood features a variety of historic homes and parks, along with a strong sense of community. Ideal for families and guests interested in experiencing the local culture. | Chowder Pot Restaurant, West End Park, Bridgeport Hospital, Seaside Gardens, Local family-run shops and eateries |
| South End | Located near the waterfront, this area is great for those wanting easy access to dining, shopping, and scenic views of Long Island Sound. It's a growing area with new developments attracting visitors. | Sikorsky Memorial Airport, Howard A. Mott Park, Local seafood restaurants, Bus terminal for regional travel, Close to public beaches |
| North Bridgeport | A more suburban area that provides a quiet retreat from the busier parts of the city. Visitors here can enjoy access to parks and family-friendly activities. | Fairfield Metro Center, General Electric Campus, Bishop's Orchards, Local parks and family activities, Trumbull Shopping Park |
| Petersen Park | This area is increasingly popular with visitors seeking outdoor enjoyment and recreational activities. Featuring parks and local sports facilities, it attracts active guests preparing for a relaxed experience. | Petersen Park, Playing fields and sports courts, Friendly neighborhood cafes, Local stores, Close to nature trails |
Understanding Airbnb License Requirements & STR Laws in Bridgeport (2026)
While Bridgeport, Greater Bridgeport Planning Region, United States currently shows low STR regulations, specific Airbnb license requirements might still exist or change. Always verify the latest short term rental regulations and Airbnb license requirements directly with local government authorities for Bridgeport to ensure full compliance before hosting.
(Source: AirROI data, 2026, based on 2% licensed listings)
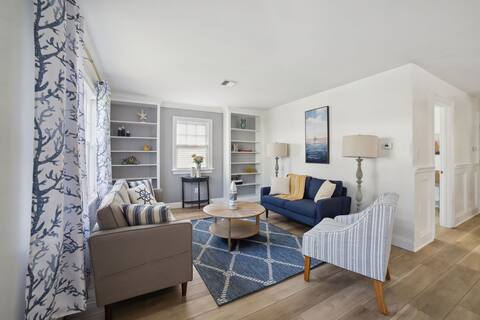
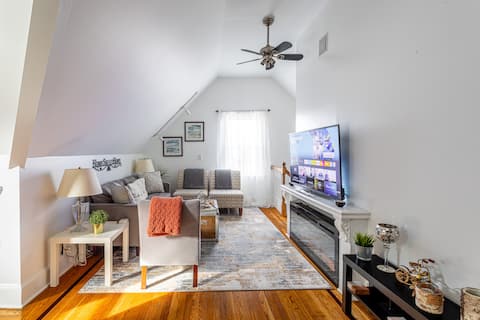
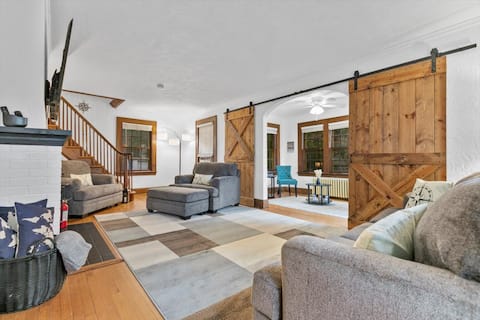
Top Performing Airbnb Properties in Bridgeport (2026)
Benchmark your potential! Explore examples of top-performing Airbnb properties in Bridgeportbased on Trailing Twelve Month (TTM) revenue. Analyze their characteristics, revenue, occupancy rate, and ADR to understand what drives success in this market.

Stay at Black Rock Harbor
Entire Place • 3 bedrooms

Charming Colonial for Events and Getaways!
Entire Place • 7 bedrooms

Seaview Ave 4BR House - Sleeps 8
Entire Place • 4 bedrooms
Families|Charming |King Bed| Near SHU
Entire Place • 4 bedrooms
Modern + Spacious 5BR/2BA Home, Renovated Backyard
Entire Place • 5 bedrooms
Quintessential Cozy Haven, Brooklawn Beauty
Entire Place • 4 bedrooms
Note: Performance varies based on location, size, amenities, seasonality, and management quality. Data reflects the past 12 months.
Top Performing Airbnb Hosts in Bridgeport (2026)
Learn from the best! This table showcases top-performing Airbnb hosts in Bridgeport based on the number of properties managed and estimated total revenue over the past year. Analyze their scale and performance metrics.
| Host Name | Properties | Grossing Revenue | Stay Reviews | Avg Rating |
|---|---|---|---|---|
| Nubia | 8 | $198,572 | 206 | 4.64/5.0 |
| Andrew | 3 | $128,152 | 101 | 4.76/5.0 |
| Ricport | 5 | $114,180 | 376 | 4.88/5.0 |
| Christina | 2 | $80,300 | 39 | 4.97/5.0 |
| Allie | 1 | $76,736 | 64 | 4.98/5.0 |
| Premium Trips | 7 | $76,429 | 67 | 4.77/5.0 |
| Jav | 9 | $75,076 | 173 | 4.24/5.0 |
| Rajeev | 1 | $69,469 | 6 | 5.00/5.0 |
| James ODonnell | 3 | $65,484 | 280 | 4.95/5.0 |
| Natalie | 3 | $64,063 | 132 | 4.84/5.0 |
Analyzing the strategies of top hosts, such as their property selection, pricing, and guest communication, can offer valuable lessons for optimizing your own Airbnb operations in Bridgeport.
Dive Deeper: Advanced Bridgeport STR Market Data (2026)
Ready to unlock more insights? AirROI provides access to advanced metrics and comprehensive Airbnb data for Bridgeport. Explore detailed analytics beyond this report to refine your investment strategy, optimize pricing, and maximize your vacation rental profits.
Explore Advanced MetricsBridgeport Short-Term Rental Market Composition (2026): Property & Room Types
Room Type Distribution
Property Type Distribution
Market Composition Insights for Bridgeport
- The Bridgeport Airbnb market composition is heavily skewed towards Entire Home/Apt listings, which make up 55% of the 131 active rentals. This indicates strong guest preference for privacy and space.
- However, a notable 45% share for Private Rooms suggests opportunities for budget-conscious travelers or hosts renting out spare rooms.
- Looking at the property type distribution in Bridgeport, House properties are the most common (52.7%), reflecting the local real estate landscape.
- Houses represent a significant 52.7% portion, catering likely to families or larger groups.
- Smaller segments like others (combined 1.5%) offer potential for unique stay experiences.
Bridgeport Airbnb Room Capacity Analysis (2026): Bedroom Distribution
Distribution of Listings by Number of Bedrooms
Room Capacity Insights for Bridgeport
- The dominant room capacity in Bridgeport is 1 bedroom listings, making up 19.8% of the market. This suggests a strong demand for properties suitable for couples or solo travelers.
- Together, 1 bedroom and 2 bedrooms properties represent 38.9% of the active Airbnb listings in Bridgeport, indicating a high concentration in these sizes.
- A significant 20.6% of listings offer 3+ bedrooms, catering to larger groups and families seeking more space in Bridgeport.
Bridgeport Vacation Rental Guest Capacity Trends (2026)
Distribution of Listings by Guest Capacity
Guest Capacity Insights for Bridgeport
- The most common guest capacity trend in Bridgeport vacation rentals is listings accommodating 8+ guests (14.5%). This suggests the primary traveler segment is likely larger groups.
- Properties designed for 8+ guests and 4 guests dominate the Bridgeport STR market, accounting for 26.0% of listings.
- 22.1% of properties accommodate 6+ guests, serving the market segment for larger families or group travel in Bridgeport.
- On average, properties in Bridgeport are equipped to host 2.8 guests.
Bridgeport Airbnb Booking Patterns (2026): Available vs. Booked Days
Available Days Distribution
Booked Days Distribution
Booking Pattern Insights for Bridgeport
- The most common availability pattern in Bridgeport falls within the 271-366 days range, representing 55.7% of listings. This suggests many properties have significant open periods on their calendars.
- Approximately 87.8% of listings show high availability (181+ days open annually), indicating potential for increased bookings or specific owner usage patterns.
- For booked days, the 31-90 days range is most frequent in Bridgeport (34.4%), reflecting common guest stay durations or potential owner blocking patterns.
- A notable 12.3% of properties secure long booking periods (181+ days booked per year), highlighting successful long-term rental strategies or significant owner usage.
Bridgeport Airbnb Minimum Stay Requirements Analysis
Distribution of Listings by Minimum Night Requirement
1 Night
47 listings
35.9% of total
2 Nights
33 listings
25.2% of total
3 Nights
8 listings
6.1% of total
4-6 Nights
9 listings
6.9% of total
7-29 Nights
12 listings
9.2% of total
30+ Nights
22 listings
16.8% of total
Key Insights
- The most prevalent minimum stay requirement in Bridgeport is 1 Night, adopted by 35.9% of listings. This highlights the market's preference for shorter, flexible bookings.
- A strong majority (61.1%) of the Bridgeport Airbnb data shows acceptance of very short stays (1-2 nights), indicating a dynamic, high-turnover market.
- A significant segment (16.8%) caters to monthly stays (30+ nights) in Bridgeport, pointing to opportunities in the extended-stay market.
Recommendations
- Align with the market by considering a 1 Night minimum stay, as 35.9% of Bridgeport hosts use this setting.
- Explore offering discounts for stays of 30+ nights to attract the 16.8% of the market seeking extended stays.
- Adjust minimum nights based on seasonality – potentially shorter during low season and longer during peak demand periods in Bridgeport.
Bridgeport Airbnb Cancellation Policy Trends Analysis (2026)
Limited
11 listings
8.4% of total
Super Strict 30 Days
2 listings
1.5% of total
Flexible
35 listings
26.7% of total
Moderate
37 listings
28.2% of total
Firm
38 listings
29% of total
Strict
8 listings
6.1% of total
Cancellation Policy Insights for Bridgeport
- The prevailing Airbnb cancellation policy trend in Bridgeport is Firm, used by 29% of listings.
- There's a relatively balanced mix between guest-friendly (54.9%) and stricter (35.1%) policies, offering choices for different guest needs.
- Strict cancellation policies are quite rare (6.1%), potentially making listings with this policy less competitive unless justified by high demand or property type.
Recommendations for Hosts
- Consider adopting a Firm policy to align with the 29% market standard in Bridgeport.
- Using a Strict policy might deter some guests, as only 6.1% of listings use it. Evaluate if potential revenue protection outweighs possible lower booking rates.
- Regularly review your cancellation policy against competitors and market demand shifts in Bridgeport.
Bridgeport STR Booking Lead Time Analysis (2026)
Average Booking Lead Time by Month
Booking Lead Time Insights for Bridgeport
- The overall average booking lead time for vacation rentals in Bridgeport is 31 days.
- Guests book furthest in advance for stays during May (average 57 days), likely coinciding with peak travel demand or local events.
- The shortest booking windows occur for stays in February (average 9 days), indicating more last-minute travel plans during this time.
- Seasonally, Fall (37 days avg.) sees the longest lead times, while Winter (14 days avg.) has the shortest, reflecting typical travel planning cycles.
Recommendations for Hosts
- Use the overall average lead time (31 days) as a baseline for your pricing and availability strategy in Bridgeport.
- For May stays, consider implementing length-of-stay discounts or slightly higher rates for bookings made less than 57 days out to capitalize on advance planning.
- During February, focus on last-minute booking availability and promotions, as guests book with very short notice (9 days avg.).
- Target marketing efforts for the Fall season well in advance (at least 37 days) to capture early planners.
- Monitor your own booking lead times against these Bridgeport averages to identify opportunities for dynamic pricing adjustments.
Popular & Essential Airbnb Amenities in Bridgeport (2026)
Amenity Prevalence
Amenity Insights for Bridgeport
- Essential amenities in Bridgeport that guests expect include: Wifi, Smoke alarm. Lacking these (any) could significantly impact bookings.
- Popular amenities like Air conditioning, Heating, Kitchen are common but not universal. Offering these can provide a competitive edge.
Recommendations for Hosts
- Ensure your listing includes all essential amenities for Bridgeport: Wifi, Smoke alarm.
- Prioritize adding missing essentials: Wifi, Smoke alarm.
- Consider adding popular differentiators like Air conditioning or Heating to increase appeal.
- Highlight unique or less common amenities you offer (e.g., hot tub, dedicated workspace, EV charger) in your listing description and photos.
- Regularly check competitor amenities in Bridgeport to stay competitive.
Bridgeport Airbnb Guest Demographics & Profile Analysis (2026)
Guest Profile Summary for Bridgeport
- The typical guest profile for Airbnb in Bridgeport consists of primarily domestic travelers (92%), often arriving from nearby New York, typically belonging to the Post-2000s (Gen Z/Alpha) group (50%), primarily speaking English or Spanish.
- Domestic travelers account for 92.4% of guests.
- Key international markets include United States (92.4%) and Canada (1.4%).
- Top languages spoken are English (64.4%) followed by Spanish (17.6%).
- A significant demographic segment is the Post-2000s (Gen Z/Alpha) group, representing 50% of guests.
Recommendations for Hosts
- Target domestic marketing efforts towards travelers from New York and Bridgeport.
- Tailor amenities and listing descriptions to appeal to the dominant Post-2000s (Gen Z/Alpha) demographic (e.g., highlight fast WiFi, smart home features, local guides).
- Highlight unique local experiences or amenities relevant to the primary guest profile.
- Consider seasonal promotions aligned with peak travel times for key origin markets.
Nearby Short-Term Rental Market Comparison
How does the Bridgeport Airbnb market stack up against its neighbors? Compare key performance metrics like average monthly revenue, ADR, and occupancy rates in surrounding areas to understand the broader regional STR landscape.
| Market | Active Properties | Monthly Revenue | Daily Rate | Avg. Occupancy |
|---|---|---|---|---|
| Town of Kingston | 10 | $6,470 | $473.76 | 49% |
| Frankford Township | 11 | $6,329 | $505.19 | 41% |
| Sag Harbor | 15 | $6,129 | $1280.84 | 40% |
| Town of East Hampton | 1,327 | $5,945 | $986.02 | 36% |
| Spring Lake Heights | 16 | $5,785 | $725.20 | 40% |
| Town of Monroe | 22 | $5,690 | $720.52 | 37% |
| Town of Southampton | 1,201 | $5,620 | $1002.45 | 33% |
| Town of Ancram | 22 | $5,616 | $512.55 | 38% |
| Southampton | 19 | $5,405 | $1456.43 | 30% |
| Neptune City | 12 | $5,299 | $531.14 | 45% |