Winder Airbnb Market Analysis 2026: Short Term Rental Data & Vacation Rental Statistics in Georgia, United States
Is Airbnb profitable in Winder in 2026? Explore comprehensive Airbnb analytics for Winder, Georgia, United States to uncover income potential. This 2026 STR market report for Winder, based on AirROI data from February 2025 to January 2026, reveals key trends in the niche market of 24 active listings.
Whether you're considering an Airbnb investment in Winder, optimizing your existing vacation rental, or exploring rental arbitrage opportunities, understanding the Winder Airbnb data is crucial. Leveraging the low regulation environment is key to maximizing your short term rental income potential. Let's dive into the specifics.
Key Winder Airbnb Performance Metrics Overview
Monthly Airbnb Revenue Variations & Income Potential in Winder (2026)
Understanding the monthly revenue variations for Airbnb listings in Winder is key to maximizing your short term rental income potential. Seasonality significantly impacts earnings. Our analysis, based on data from the past 12 months, shows that the peak revenue month for STRs in Winder is typically April, while January often presents the lowest earnings, highlighting opportunities for strategic pricing adjustments during shoulder and low seasons. Explore the typical Airbnb income in Winder across different performance tiers:
- Best-in-class properties (Top 10%) achieve $5,317+ monthly, often utilizing dynamic pricing and superior guest experiences.
- Strong performing properties (Top 25%) earn $2,716 or more, indicating effective management and desirable locations/amenities.
- Typical properties (Median) generate around $1,625 per month, representing the average market performance.
- Entry-level properties (Bottom 25%) see earnings around $854, often with potential for optimization.
Average Monthly Airbnb Earnings Trend in Winder
Winder Airbnb Occupancy Rate Trends (2026)
Maximize your bookings by understanding the Winder STR occupancy trends. Seasonal demand shifts significantly influence how often properties are booked. Typically, Novembersees the highest demand (peak season occupancy), while January experiences the lowest (low season). Effective strategies, like adjusting minimum stays or offering promotions, can boost occupancy during slower periods. Here's how different property tiers perform in Winder:
- Best-in-class properties (Top 10%) achieve 76%+ occupancy, indicating high desirability and potentially optimized availability.
- Strong performing properties (Top 25%) maintain 57% or higher occupancy, suggesting good market fit and guest satisfaction.
- Typical properties (Median) have an occupancy rate around 37%.
- Entry-level properties (Bottom 25%) average 18% occupancy, potentially facing higher vacancy.
Average Monthly Occupancy Rate Trend in Winder
Average Daily Rate (ADR) Airbnb Trends in Winder (2026)
Effective short term rental pricing strategy in Winder involves understanding monthly ADR fluctuations. The Average Daily Rate (ADR) for Airbnb in Winder typically peaks in January and dips lowest during April. Leveraging Airbnb dynamic pricing tools or strategies based on this seasonality can significantly boost revenue. Here's a look at the typical nightly rates achieved:
- Best-in-class properties (Top 10%) command rates of $252+ per night, often due to premium features or locations.
- Strong performing properties (Top 25%) achieve nightly rates of $188 or more.
- Typical properties (Median) charge around $127 per night.
- Entry-level properties (Bottom 25%) earn around $84 per night.
Average Daily Rate (ADR) Trend by Month in Winder
Get Live Winder Market Intelligence 👇

Explore Real-time Analytics
Airbnb Seasonality Analysis & Trends in Winder (2026)
Peak Season (April, November, October)
- Revenue averages $3,162 per month
- Occupancy rates average 43.5%
- Daily rates average $199
Shoulder Season
- Revenue averages $2,519 per month
- Occupancy maintains around 41.3%
- Daily rates hold near $175
Low Season (January, February, June)
- Revenue drops to average $1,625 per month
- Occupancy decreases to average 34.7%
- Daily rates adjust to average $179
Seasonality Insights for Winder
- The Airbnb seasonality in Winder shows moderate seasonality with distinct peak and low periods. While the sections above show seasonal averages, it's also insightful to look at the extremes:
- During the high season, the absolute peak month showcases Winder's highest earning potential, with monthly revenues capable of climbing to $3,247, occupancy reaching a high of 44.8%, and ADRs peaking at $228.
- Conversely, the slowest single month of the year, typically falling within the low season, marks the market's lowest point. In this month, revenue might dip to $1,534, occupancy could drop to 29.6%, and ADRs may adjust down to $145.
- Understanding both the seasonal averages and these monthly peaks and troughs in revenue, occupancy, and ADR is crucial for maximizing your Airbnb profit potential in Winder.
Seasonal Strategies for Maximizing Profit
- Peak Season: Maximize revenue through premium pricing and potentially longer minimum stays. Ensure high availability.
- Low Season: Offer competitive pricing, special promotions (e.g., extended stay discounts), and flexible cancellation policies. Target off-season travelers like remote workers or budget-conscious guests.
- Shoulder Seasons: Implement dynamic pricing that balances peak and low rates. Target weekend travelers or specific events. Offer slightly more flexible terms than peak season.
- Regularly analyze your own performance against these Winder seasonality benchmarks and adjust your pricing and availability strategy accordingly.
Best Areas for Airbnb Investment in Winder (2026)
Exploring the top neighborhoods for short-term rentals in Winder? This section highlights key areas, outlining why they are attractive for hosts and guests, along with notable local attractions. Consider these locations based on your target guest profile and investment strategy.
| Neighborhood / Area | Why Host Here? (Target Guests & Appeal) | Key Attractions & Landmarks |
|---|---|---|
| Downtown Winder | The vibrant heart of Winder, offering a mix of historic charm and modern amenities. It's a popular area for both business and leisure travelers, with convenient access to local shops and restaurants. | J.B. Williams Park, Winder Cultural Arts Center, Local dining and cafes, Historic Downtown Winder, Winder Farmers Market |
| Barrow County | Expansive area surrounding Winder, which provides a blend of suburban and rural settings. Ideal for travelers looking for a peaceful getaway while still being close to city amenities. | Fort Yargo State Park, Barrow County Historical Society, Local wineries and breweries, Outdoor recreational activities, Nature trails |
| Pendergrass | A charming small town just a short drive from Winder, offering quaint accommodations and access to rural attractions. Great for those looking to escape the hustle of city life while being close to entertainment. | Pendergrass Flea Market, Local parks, Scenic countryside, Antique shops, Community events |
| Braselton | Just a bit further from Winder, this town boasts a rich history and is home to the popular Atlanta Motorsports Park. Attracts racing enthusiasts and leisure travelers alike. | Atlanta Motorsports Park, Braselton Events Center, Local golf courses, Chateau Elan Winery and Resort, Historic Braselton |
| Auburn | A small, picturesque town near Winder, perfect for families and those looking for a quiet retreat. Offers a tight-knit community feel and local charm. | Auburn City Park, Local artisans, Community festivals, Historic buildings, Antique shops |
| Nashville, GA | A hidden gem for visitors looking for a more laid-back atmosphere. Great for nature lovers and those wanting to experience local southern hospitality. | Nashville Park, Historical attractions, Southern cuisine restaurants, Local arts and crafts, Fishing and boating opportunities |
| Jefferson | A quaint city just north of Winder, known for its beautiful historic district and vibrant community events. It's perfect for travelers seeking culture and relaxation. | Jefferson Historical Museum, Local shops and boutiques, Community events, Scenic parks, Jefferson's historic homes |
| Chateau Elan | A luxury winery and resort close to Winder, attracting tourists looking for upscale experiences, wine tastings, and spa services. Ideal for romantic getaways. | Chateau Elan Winery, Spa services, Golf courses, Fine dining options, Wine tours |
Understanding Airbnb License Requirements & STR Laws in Winder (2026)
While Winder, Georgia, United States currently shows low STR regulations, specific Airbnb license requirements might still exist or change. Always verify the latest short term rental regulations and Airbnb license requirements directly with local government authorities for Winder to ensure full compliance before hosting.
(Source: AirROI data, 2026, finding no licensed listings among those analyzed)
Top Performing Airbnb Properties in Winder (2026)
Benchmark your potential! Explore examples of top-performing Airbnb properties in Winderbased on Trailing Twelve Month (TTM) revenue. Analyze their characteristics, revenue, occupancy rate, and ADR to understand what drives success in this market.
Residential Home Oconee Co. Game Day in Athens
Entire Place • 3 bedrooms

Stay in a brand new modern townhome. Sleeps 8.
Entire Place • 3 bedrooms

Bright Renovated Home. Master on Main. Sleeps 8.
Entire Place • 4 bedrooms

Farmhouse Retreat With Creek
Entire Place • 5 bedrooms

Spacious & comfy home in ultra-convenient location
Entire Place • 3 bedrooms
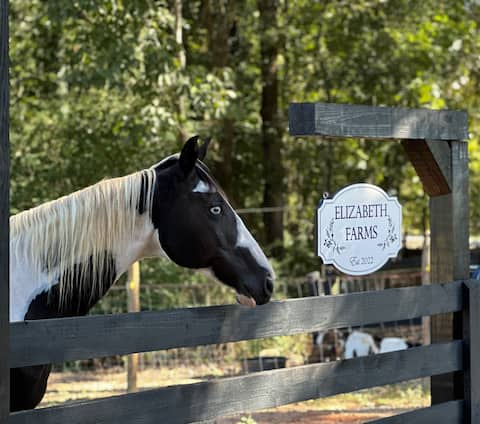
Cozy barn at Elizabeth Farms!
Entire Place • N/A
Note: Performance varies based on location, size, amenities, seasonality, and management quality. Data reflects the past 12 months.
Top Performing Airbnb Hosts in Winder (2026)
Learn from the best! This table showcases top-performing Airbnb hosts in Winder based on the number of properties managed and estimated total revenue over the past year. Analyze their scale and performance metrics.
| Host Name | Properties | Grossing Revenue | Stay Reviews | Avg Rating |
|---|---|---|---|---|
| Ludmila | 4 | $134,627 | 167 | 4.88/5.0 |
| Casey Leigh Daniel | 1 | $128,633 | 16 | 5.00/5.0 |
| Darlene And Dan | 5 | $64,170 | 929 | 4.98/5.0 |
| Reemee | 2 | $42,568 | 175 | 4.75/5.0 |
| Bricey | 1 | $36,834 | 6 | 5.00/5.0 |
| Amanda | 1 | $27,597 | 86 | 4.98/5.0 |
| Monia | 1 | $26,420 | 170 | 4.95/5.0 |
| Mikhaela | 1 | $21,684 | 114 | 4.89/5.0 |
| Laura | 1 | $17,944 | 23 | 4.74/5.0 |
| Connie | 1 | $9,036 | 31 | 5.00/5.0 |
Analyzing the strategies of top hosts, such as their property selection, pricing, and guest communication, can offer valuable lessons for optimizing your own Airbnb operations in Winder.
Dive Deeper: Advanced Winder STR Market Data (2026)
Ready to unlock more insights? AirROI provides access to advanced metrics and comprehensive Airbnb data for Winder. Explore detailed analytics beyond this report to refine your investment strategy, optimize pricing, and maximize your vacation rental profits.
Explore Advanced MetricsWinder Short-Term Rental Market Composition (2026): Property & Room Types
Room Type Distribution
Property Type Distribution
Market Composition Insights for Winder
- The Winder Airbnb market composition is heavily skewed towards Entire Home/Apt listings, which make up 70.8% of the 24 active rentals. This indicates strong guest preference for privacy and space.
- Looking at the property type distribution in Winder, House properties are the most common (79.2%), reflecting the local real estate landscape.
- Houses represent a significant 79.2% portion, catering likely to families or larger groups.
- The presence of 12.5% Hotel/Boutique listings indicates integration with traditional hospitality.
Winder Airbnb Room Capacity Analysis (2026): Bedroom Distribution
Distribution of Listings by Number of Bedrooms
Room Capacity Insights for Winder
- The dominant room capacity in Winder is 3 bedrooms listings, making up 25% of the market. This suggests a strong demand for properties suitable for families or small groups.
- Together, 3 bedrooms and 1 bedroom properties represent 45.8% of the active Airbnb listings in Winder, indicating a high concentration in these sizes.
- A significant 33.4% of listings offer 3+ bedrooms, catering to larger groups and families seeking more space in Winder.
Winder Vacation Rental Guest Capacity Trends (2026)
Distribution of Listings by Guest Capacity
Guest Capacity Insights for Winder
- The most common guest capacity trend in Winder vacation rentals is listings accommodating 6 guests (33.3%). This suggests the primary traveler segment is likely larger groups.
- Properties designed for 6 guests and 2 guests dominate the Winder STR market, accounting for 50.0% of listings.
- 45.8% of properties accommodate 6+ guests, serving the market segment for larger families or group travel in Winder.
- On average, properties in Winder are equipped to host 4.0 guests.
Winder Airbnb Booking Patterns (2026): Available vs. Booked Days
Available Days Distribution
Booked Days Distribution
Booking Pattern Insights for Winder
- The most common availability pattern in Winder falls within the 271-366 days range, representing 41.7% of listings. This suggests many properties have significant open periods on their calendars.
- Approximately 79.2% of listings show high availability (181+ days open annually), indicating potential for increased bookings or specific owner usage patterns.
- For booked days, the 181-270 days range is most frequent in Winder (29.2%), reflecting common guest stay durations or potential owner blocking patterns.
- A notable 29.2% of properties secure long booking periods (181+ days booked per year), highlighting successful long-term rental strategies or significant owner usage.
Winder Airbnb Minimum Stay Requirements Analysis
Distribution of Listings by Minimum Night Requirement
1 Night
12 listings
50% of total
2 Nights
4 listings
16.7% of total
3 Nights
1 listings
4.2% of total
7-29 Nights
1 listings
4.2% of total
30+ Nights
6 listings
25% of total
Key Insights
- The most prevalent minimum stay requirement in Winder is 1 Night, adopted by 50% of listings. This highlights the market's preference for shorter, flexible bookings.
- A strong majority (66.7%) of the Winder Airbnb data shows acceptance of very short stays (1-2 nights), indicating a dynamic, high-turnover market.
- A significant segment (25%) caters to monthly stays (30+ nights) in Winder, pointing to opportunities in the extended-stay market.
Recommendations
- Align with the market by considering a 1 Night minimum stay, as 50% of Winder hosts use this setting.
- Explore offering discounts for stays of 30+ nights to attract the 25% of the market seeking extended stays.
- Adjust minimum nights based on seasonality – potentially shorter during low season and longer during peak demand periods in Winder.
Winder Airbnb Cancellation Policy Trends Analysis (2026)
Limited
1 listings
4.2% of total
Flexible
6 listings
25% of total
Moderate
5 listings
20.8% of total
Firm
12 listings
50% of total
Cancellation Policy Insights for Winder
- The prevailing Airbnb cancellation policy trend in Winder is Firm, used by 50% of listings.
- There's a relatively balanced mix between guest-friendly (45.8%) and stricter (50.0%) policies, offering choices for different guest needs.
Recommendations for Hosts
- Consider adopting a Firm policy to align with the 50% market standard in Winder.
- Regularly review your cancellation policy against competitors and market demand shifts in Winder.
Winder STR Booking Lead Time Analysis (2026)
Average Booking Lead Time by Month
Booking Lead Time Insights for Winder
- The overall average booking lead time for vacation rentals in Winder is 45 days.
- Guests book furthest in advance for stays during May (average 84 days), likely coinciding with peak travel demand or local events.
- The shortest booking windows occur for stays in January (average 9 days), indicating more last-minute travel plans during this time.
- Seasonally, Spring (48 days avg.) sees the longest lead times, while Winter (20 days avg.) has the shortest, reflecting typical travel planning cycles.
Recommendations for Hosts
- Use the overall average lead time (45 days) as a baseline for your pricing and availability strategy in Winder.
- For May stays, consider implementing length-of-stay discounts or slightly higher rates for bookings made less than 84 days out to capitalize on advance planning.
- During January, focus on last-minute booking availability and promotions, as guests book with very short notice (9 days avg.).
- Target marketing efforts for the Spring season well in advance (at least 48 days) to capture early planners.
- Monitor your own booking lead times against these Winder averages to identify opportunities for dynamic pricing adjustments.
Popular & Essential Airbnb Amenities in Winder (2026)
Amenity Prevalence
Amenity Insights for Winder
- Essential amenities in Winder that guests expect include: Free parking on premises, Air conditioning, Smoke alarm, TV, Wifi. Lacking these (any) could significantly impact bookings.
- Popular amenities like Heating, Fire extinguisher, Dishes and silverware are common but not universal. Offering these can provide a competitive edge.
Recommendations for Hosts
- Ensure your listing includes all essential amenities for Winder: Free parking on premises, Air conditioning, Smoke alarm, TV, Wifi.
- Consider adding popular differentiators like Heating or Fire extinguisher to increase appeal.
- Highlight unique or less common amenities you offer (e.g., hot tub, dedicated workspace, EV charger) in your listing description and photos.
- Regularly check competitor amenities in Winder to stay competitive.
Winder Airbnb Guest Demographics & Profile Analysis (2026)
Guest Profile Summary for Winder
- The typical guest profile for Airbnb in Winder consists of primarily domestic travelers (98%), often arriving from nearby Athens, typically belonging to the Post-2000s (Gen Z/Alpha) group (50%), primarily speaking English or Spanish.
- Domestic travelers account for 97.7% of guests.
- Key international markets include United States (97.7%) and United Kingdom (1.2%).
- Top languages spoken are English (82.7%) followed by Spanish (12%).
- A significant demographic segment is the Post-2000s (Gen Z/Alpha) group, representing 50% of guests.
Recommendations for Hosts
- Target domestic marketing efforts towards travelers from Athens and New York.
- Tailor amenities and listing descriptions to appeal to the dominant Post-2000s (Gen Z/Alpha) demographic (e.g., highlight fast WiFi, smart home features, local guides).
- Highlight unique local experiences or amenities relevant to the primary guest profile.
- Consider seasonal promotions aligned with peak travel times for key origin markets.
Nearby Short-Term Rental Market Comparison
How does the Winder Airbnb market stack up against its neighbors? Compare key performance metrics like average monthly revenue, ADR, and occupancy rates in surrounding areas to understand the broader regional STR landscape.
| Market | Active Properties | Monthly Revenue | Daily Rate | Avg. Occupancy |
|---|---|---|---|---|
| Bogart | 13 | $5,528 | $637.81 | 35% |
| Gilmer County | 26 | $5,298 | $459.59 | 40% |
| Fannin County | 42 | $4,574 | $435.93 | 38% |
| East Ellijay | 15 | $4,415 | $368.05 | 41% |
| Epworth | 79 | $4,411 | $406.97 | 40% |
| Six Mile | 57 | $4,396 | $449.78 | 42% |
| Commerce | 19 | $4,298 | $285.34 | 45% |
| Eatonton | 236 | $4,178 | $502.80 | 33% |
| West Union | 30 | $4,126 | $564.92 | 32% |
| Sautee | 14 | $4,105 | $408.17 | 39% |