Wilmington Island Airbnb Market Analysis 2026: Short Term Rental Data & Vacation Rental Statistics in Georgia, United States
Is Airbnb profitable in Wilmington Island in 2026? Explore comprehensive Airbnb analytics for Wilmington Island, Georgia, United States to uncover income potential. This 2026 STR market report for Wilmington Island, based on AirROI data from February 2025 to January 2026, reveals key trends in the niche market of 113 active listings.
Whether you're considering an Airbnb investment in Wilmington Island, optimizing your existing vacation rental, or exploring rental arbitrage opportunities, understanding the Wilmington Island Airbnb data is crucial. Leveraging the low regulation environment is key to maximizing your short term rental income potential. Let's dive into the specifics.
Key Wilmington Island Airbnb Performance Metrics Overview
Monthly Airbnb Revenue Variations & Income Potential in Wilmington Island (2026)
Understanding the monthly revenue variations for Airbnb listings in Wilmington Island is key to maximizing your short term rental income potential. Seasonality significantly impacts earnings. Our analysis, based on data from the past 12 months, shows that the peak revenue month for STRs in Wilmington Island is typically June, while January often presents the lowest earnings, highlighting opportunities for strategic pricing adjustments during shoulder and low seasons. Explore the typical Airbnb income in Wilmington Island across different performance tiers:
- Best-in-class properties (Top 10%) achieve $9,282+ monthly, often utilizing dynamic pricing and superior guest experiences.
- Strong performing properties (Top 25%) earn $6,104 or more, indicating effective management and desirable locations/amenities.
- Typical properties (Median) generate around $3,149 per month, representing the average market performance.
- Entry-level properties (Bottom 25%) see earnings around $1,788, often with potential for optimization.
Average Monthly Airbnb Earnings Trend in Wilmington Island
Wilmington Island Airbnb Occupancy Rate Trends (2026)
Maximize your bookings by understanding the Wilmington Island STR occupancy trends. Seasonal demand shifts significantly influence how often properties are booked. Typically, Marchsees the highest demand (peak season occupancy), while January experiences the lowest (low season). Effective strategies, like adjusting minimum stays or offering promotions, can boost occupancy during slower periods. Here's how different property tiers perform in Wilmington Island:
- Best-in-class properties (Top 10%) achieve 78%+ occupancy, indicating high desirability and potentially optimized availability.
- Strong performing properties (Top 25%) maintain 65% or higher occupancy, suggesting good market fit and guest satisfaction.
- Typical properties (Median) have an occupancy rate around 48%.
- Entry-level properties (Bottom 25%) average 28% occupancy, potentially facing higher vacancy.
Average Monthly Occupancy Rate Trend in Wilmington Island
Average Daily Rate (ADR) Airbnb Trends in Wilmington Island (2026)
Effective short term rental pricing strategy in Wilmington Island involves understanding monthly ADR fluctuations. The Average Daily Rate (ADR) for Airbnb in Wilmington Island typically peaks in June and dips lowest during February. Leveraging Airbnb dynamic pricing tools or strategies based on this seasonality can significantly boost revenue. Here's a look at the typical nightly rates achieved:
- Best-in-class properties (Top 10%) command rates of $589+ per night, often due to premium features or locations.
- Strong performing properties (Top 25%) achieve nightly rates of $379 or more.
- Typical properties (Median) charge around $224 per night.
- Entry-level properties (Bottom 25%) earn around $153 per night.
Average Daily Rate (ADR) Trend by Month in Wilmington Island
Get Live Wilmington Island Market Intelligence 👇

Explore Real-time Analytics
Airbnb Seasonality Analysis & Trends in Wilmington Island (2026)
Peak Season (June, July, March)
- Revenue averages $6,129 per month
- Occupancy rates average 57.7%
- Daily rates average $336
Shoulder Season
- Revenue averages $4,606 per month
- Occupancy maintains around 46.5%
- Daily rates hold near $316
Low Season (January, February, September)
- Revenue drops to average $3,483 per month
- Occupancy decreases to average 40.0%
- Daily rates adjust to average $294
Seasonality Insights for Wilmington Island
- The Airbnb seasonality in Wilmington Island shows moderate seasonality with distinct peak and low periods. While the sections above show seasonal averages, it's also insightful to look at the extremes:
- During the high season, the absolute peak month showcases Wilmington Island's highest earning potential, with monthly revenues capable of climbing to $6,245, occupancy reaching a high of 58.8%, and ADRs peaking at $352.
- Conversely, the slowest single month of the year, typically falling within the low season, marks the market's lowest point. In this month, revenue might dip to $3,158, occupancy could drop to 32.8%, and ADRs may adjust down to $276.
- Understanding both the seasonal averages and these monthly peaks and troughs in revenue, occupancy, and ADR is crucial for maximizing your Airbnb profit potential in Wilmington Island.
Seasonal Strategies for Maximizing Profit
- Peak Season: Maximize revenue through premium pricing and potentially longer minimum stays. Ensure high availability.
- Low Season: Offer competitive pricing, special promotions (e.g., extended stay discounts), and flexible cancellation policies. Target off-season travelers like remote workers or budget-conscious guests.
- Shoulder Seasons: Implement dynamic pricing that balances peak and low rates. Target weekend travelers or specific events. Offer slightly more flexible terms than peak season.
- Regularly analyze your own performance against these Wilmington Island seasonality benchmarks and adjust your pricing and availability strategy accordingly.
Best Areas for Airbnb Investment in Wilmington Island (2026)
Exploring the top neighborhoods for short-term rentals in Wilmington Island? This section highlights key areas, outlining why they are attractive for hosts and guests, along with notable local attractions. Consider these locations based on your target guest profile and investment strategy.
| Neighborhood / Area | Why Host Here? (Target Guests & Appeal) | Key Attractions & Landmarks |
|---|---|---|
| Tybee Island | A popular beach destination known for its beautiful sandy beaches and historic sites. Great for families and tourists looking for a coastal getaway. | Tybee Island Beach, Fort Pulaski National Monument, Tybee Island Lighthouse, Dolphin Tours, Cockspur Island Light |
| Historic District | The heart of Savannah's rich history and charming architecture. Close to parks, shops, and restaurants, making it ideal for guests seeking cultural experiences. | Forsyth Park, River Street, Savannah Historic District, Owens-Thomas House, Julie-Turner Park |
| Wilmington Island | A family-friendly community that offers a taste of local life while being near to the beach and the city. Great for longer stays and peaceful retreats. | Wilmington Island Club, Wilmington Island Park, Beaufort River, Self Family Arts Center, Golf Courses |
| Savannah Riverfront | A bustling area along the Savannah River, filled with shopping, dining, and entertainment. Perfect for visitors who want to experience the lively nightlife and scenic views. | River Street, Savannah History Museum, Waves of the River Tour, Savannah Smiles Dueling Pianos, City Market |
| Skidaway Island | A tranquil island atmosphere that provides a perfect escape for nature lovers and peaceful retreats. Popular for biking, fishing, and exploring natural parks. | Skidaway Island State Park, Global Environment & Outdoor Education Center, Wassaw National Wildlife Refuge, Fishing Spots, Biking Trails |
| Hale's Point | A secluded area that offers a quiet retreat with easy access to the nearby city and beaches. Ideal for guests looking for privacy and peace. | Hale's Point Park, Fishing and boating areas, Privacy and serenity, Near Tybee Island, Boardwalks and nature trails |
| Gould's Inlet | Known for its natural beauty and proximity to the beach, making it a great spot for vacationers looking for outdoor activities and relaxation by the water. | Gould's Inlet Beach, Fishing Spots, Kayaking Opportunities, Wildlife Viewing, Beach Access |
| Southbridge | A master-planned community that offers golf courses, trails, and parks. Ideal for families and those seeking a suburban lifestyle with ease of access to Savannah. | Southbridge Golf Club, Parks and Trails, Community Events, Fitness Facilities, Family-Friendly Amenities |
Understanding Airbnb License Requirements & STR Laws in Wilmington Island (2026)
While Wilmington Island, Georgia, United States currently shows low STR regulations, specific Airbnb license requirements might still exist or change. Always verify the latest short term rental regulations and Airbnb license requirements directly with local government authorities for Wilmington Island to ensure full compliance before hosting.
(Source: AirROI data, 2026, finding no licensed listings among those analyzed)
Top Performing Airbnb Properties in Wilmington Island (2026)
Benchmark your potential! Explore examples of top-performing Airbnb properties in Wilmington Islandbased on Trailing Twelve Month (TTM) revenue. Analyze their characteristics, revenue, occupancy rate, and ADR to understand what drives success in this market.
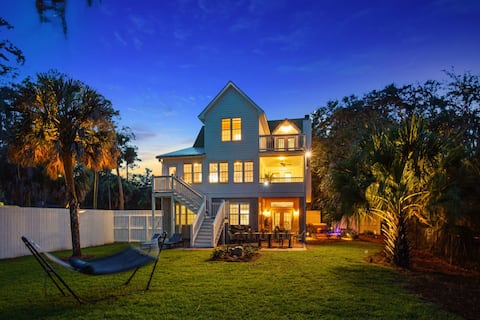
Large Peaceful Home | Hot Tub, Dock Near Beach
Entire Place • 8 bedrooms
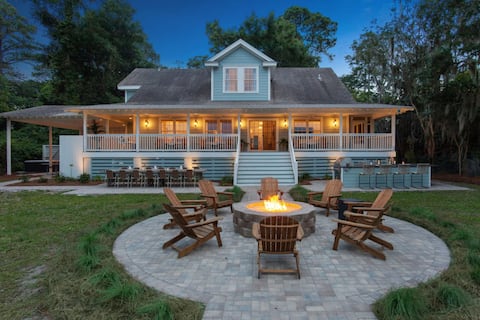
Waterfront Oasis | Hot Tub + Game Room
Entire Place • 6 bedrooms

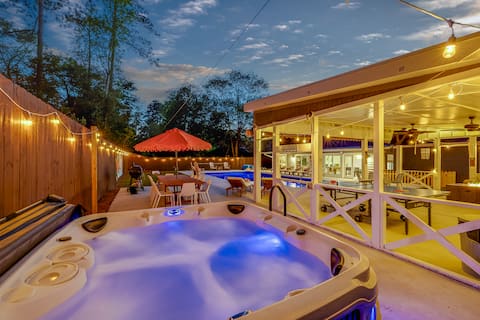
Bosch Huis Sea, The Waterfront Jewel of Savannah
Entire Place • 7 bedrooms
Savannah & Tybee | Pool & Games
Entire Place • 4 bedrooms

Sleeps 18! Island Home on Acre w/Hidden Speakeasy
Entire Place • 5 bedrooms
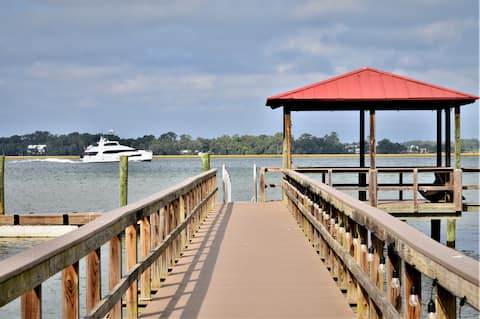
River House•Dock•King Beds•Nearby Savannah & Tybee
Entire Place • 5 bedrooms
Note: Performance varies based on location, size, amenities, seasonality, and management quality. Data reflects the past 12 months.
Top Performing Airbnb Hosts in Wilmington Island (2026)
Learn from the best! This table showcases top-performing Airbnb hosts in Wilmington Island based on the number of properties managed and estimated total revenue over the past year. Analyze their scale and performance metrics.
| Host Name | Properties | Grossing Revenue | Stay Reviews | Avg Rating |
|---|---|---|---|---|
| Heirloom | 2 | $561,293 | 134 | 4.77/5.0 |
| Carlos & Marci | 7 | $549,166 | 737 | 4.84/5.0 |
| Jonathan | 1 | $215,963 | 31 | 5.00/5.0 |
| Celia | 9 | $207,091 | 937 | 4.95/5.0 |
| Dylan | 1 | $202,445 | 50 | 4.92/5.0 |
| Ginger And Ryan | 9 | $198,346 | 4038 | 4.91/5.0 |
| Jay | 1 | $187,278 | 84 | 4.93/5.0 |
| Donna | 1 | $140,525 | 162 | 4.96/5.0 |
| Lesley | 1 | $124,344 | 27 | 5.00/5.0 |
| Lucky Savannah | 2 | $115,550 | 21 | 4.80/5.0 |
| Jenny | 3 | $115,550 | 50 | 4.91/5.0 |
Analyzing the strategies of top hosts, such as their property selection, pricing, and guest communication, can offer valuable lessons for optimizing your own Airbnb operations in Wilmington Island.
Dive Deeper: Advanced Wilmington Island STR Market Data (2026)
Ready to unlock more insights? AirROI provides access to advanced metrics and comprehensive Airbnb data for Wilmington Island. Explore detailed analytics beyond this report to refine your investment strategy, optimize pricing, and maximize your vacation rental profits.
Explore Advanced MetricsWilmington Island Short-Term Rental Market Composition (2026): Property & Room Types
Room Type Distribution
Property Type Distribution
Market Composition Insights for Wilmington Island
- The Wilmington Island Airbnb market composition is heavily skewed towards Entire Home/Apt listings, which make up 96.5% of the 113 active rentals. This indicates strong guest preference for privacy and space.
- Looking at the property type distribution in Wilmington Island, House properties are the most common (72.6%), reflecting the local real estate landscape.
- Houses represent a significant 72.6% portion, catering likely to families or larger groups.
- Smaller segments like hotel/boutique, outdoor/unique (combined 4.4%) offer potential for unique stay experiences.
Wilmington Island Airbnb Room Capacity Analysis (2026): Bedroom Distribution
Distribution of Listings by Number of Bedrooms
Room Capacity Insights for Wilmington Island
- The dominant room capacity in Wilmington Island is 1 bedroom listings, making up 26.5% of the market. This suggests a strong demand for properties suitable for couples or solo travelers.
- Together, 1 bedroom and 3 bedrooms properties represent 50.4% of the active Airbnb listings in Wilmington Island, indicating a high concentration in these sizes.
- A significant 54.0% of listings offer 3+ bedrooms, catering to larger groups and families seeking more space in Wilmington Island.
Wilmington Island Vacation Rental Guest Capacity Trends (2026)
Distribution of Listings by Guest Capacity
Guest Capacity Insights for Wilmington Island
- The most common guest capacity trend in Wilmington Island vacation rentals is listings accommodating 8+ guests (40.7%). This suggests the primary traveler segment is likely larger groups.
- Properties designed for 8+ guests and 2 guests dominate the Wilmington Island STR market, accounting for 65.5% of listings.
- 57.6% of properties accommodate 6+ guests, serving the market segment for larger families or group travel in Wilmington Island.
- On average, properties in Wilmington Island are equipped to host 5.5 guests.
Wilmington Island Airbnb Booking Patterns (2026): Available vs. Booked Days
Available Days Distribution
Booked Days Distribution
Booking Pattern Insights for Wilmington Island
- The most common availability pattern in Wilmington Island falls within the 181-270 days range, representing 41.6% of listings. This suggests many properties have significant open periods on their calendars.
- Approximately 68.1% of listings show high availability (181+ days open annually), indicating potential for increased bookings or specific owner usage patterns.
- For booked days, the 91-180 days range is most frequent in Wilmington Island (40.7%), reflecting common guest stay durations or potential owner blocking patterns.
- A notable 33.6% of properties secure long booking periods (181+ days booked per year), highlighting successful long-term rental strategies or significant owner usage.
Wilmington Island Airbnb Minimum Stay Requirements Analysis
Distribution of Listings by Minimum Night Requirement
1 Night
28 listings
24.8% of total
2 Nights
32 listings
28.3% of total
3 Nights
5 listings
4.4% of total
4-6 Nights
1 listings
0.9% of total
7-29 Nights
3 listings
2.7% of total
30+ Nights
44 listings
38.9% of total
Key Insights
- The most prevalent minimum stay requirement in Wilmington Island is 30+ Nights, adopted by 38.9% of listings. This highlights the market's preference for longer commitments.
- A significant segment (38.9%) caters to monthly stays (30+ nights) in Wilmington Island, pointing to opportunities in the extended-stay market.
Recommendations
- Align with the market by considering a 30+ Nights minimum stay, as 38.9% of Wilmington Island hosts use this setting.
- If feasible, allowing 1-night stays, especially midweek or during low season, could capture last-minute bookings, as only 24.8% currently do.
- Explore offering discounts for stays of 30+ nights to attract the 38.9% of the market seeking extended stays.
- Adjust minimum nights based on seasonality – potentially shorter during low season and longer during peak demand periods in Wilmington Island.
Wilmington Island Airbnb Cancellation Policy Trends Analysis (2026)
Super Strict 60 Days
2 listings
1.8% of total
Limited
4 listings
3.5% of total
Super Strict 30 Days
5 listings
4.4% of total
Flexible
7 listings
6.2% of total
Moderate
40 listings
35.4% of total
Firm
46 listings
40.7% of total
Strict
9 listings
8% of total
Cancellation Policy Insights for Wilmington Island
- The prevailing Airbnb cancellation policy trend in Wilmington Island is Firm, used by 40.7% of listings.
- There's a relatively balanced mix between guest-friendly (41.6%) and stricter (48.7%) policies, offering choices for different guest needs.
- Strict cancellation policies are quite rare (8%), potentially making listings with this policy less competitive unless justified by high demand or property type.
Recommendations for Hosts
- Consider adopting a Firm policy to align with the 40.7% market standard in Wilmington Island.
- Using a Strict policy might deter some guests, as only 8% of listings use it. Evaluate if potential revenue protection outweighs possible lower booking rates.
- Regularly review your cancellation policy against competitors and market demand shifts in Wilmington Island.
Wilmington Island STR Booking Lead Time Analysis (2026)
Average Booking Lead Time by Month
Booking Lead Time Insights for Wilmington Island
- The overall average booking lead time for vacation rentals in Wilmington Island is 43 days.
- Guests book furthest in advance for stays during May (average 56 days), likely coinciding with peak travel demand or local events.
- The shortest booking windows occur for stays in January (average 25 days), indicating more last-minute travel plans during this time.
- Seasonally, Spring (52 days avg.) sees the longest lead times, while Winter (32 days avg.) has the shortest, reflecting typical travel planning cycles.
Recommendations for Hosts
- Use the overall average lead time (43 days) as a baseline for your pricing and availability strategy in Wilmington Island.
- For May stays, consider implementing length-of-stay discounts or slightly higher rates for bookings made less than 56 days out to capitalize on advance planning.
- Target marketing efforts for the Spring season well in advance (at least 52 days) to capture early planners.
- Monitor your own booking lead times against these Wilmington Island averages to identify opportunities for dynamic pricing adjustments.
Popular & Essential Airbnb Amenities in Wilmington Island (2026)
Amenity Prevalence
Amenity Insights for Wilmington Island
- Essential amenities in Wilmington Island that guests expect include: Air conditioning, Heating, Wifi, Free parking on premises, TV, Smoke alarm, Hot water. Lacking these (any) could significantly impact bookings.
- Popular amenities like Fire extinguisher, Coffee maker, Microwave are common but not universal. Offering these can provide a competitive edge.
Recommendations for Hosts
- Ensure your listing includes all essential amenities for Wilmington Island: Air conditioning, Heating, Wifi, Free parking on premises, TV, Smoke alarm, Hot water.
- Prioritize adding missing essentials: Free parking on premises, TV, Smoke alarm, Hot water.
- Consider adding popular differentiators like Fire extinguisher or Coffee maker to increase appeal.
- Highlight unique or less common amenities you offer (e.g., hot tub, dedicated workspace, EV charger) in your listing description and photos.
- Regularly check competitor amenities in Wilmington Island to stay competitive.
Wilmington Island Airbnb Guest Demographics & Profile Analysis (2026)
Guest Profile Summary for Wilmington Island
- The typical guest profile for Airbnb in Wilmington Island consists of primarily domestic travelers (98%), often arriving from nearby Atlanta, typically belonging to the Post-2000s (Gen Z/Alpha) group (50%), primarily speaking English or Spanish.
- Domestic travelers account for 97.5% of guests.
- Key international markets include United States (97.5%) and Canada (0.5%).
- Top languages spoken are English (79%) followed by Spanish (11.3%).
- A significant demographic segment is the Post-2000s (Gen Z/Alpha) group, representing 50% of guests.
Recommendations for Hosts
- Target domestic marketing efforts towards travelers from Atlanta and Savannah.
- Tailor amenities and listing descriptions to appeal to the dominant Post-2000s (Gen Z/Alpha) demographic (e.g., highlight fast WiFi, smart home features, local guides).
- Highlight unique local experiences or amenities relevant to the primary guest profile.
- Consider seasonal promotions aligned with peak travel times for key origin markets.
Nearby Short-Term Rental Market Comparison
How does the Wilmington Island Airbnb market stack up against its neighbors? Compare key performance metrics like average monthly revenue, ADR, and occupancy rates in surrounding areas to understand the broader regional STR landscape.
| Market | Active Properties | Monthly Revenue | Daily Rate | Avg. Occupancy |
|---|---|---|---|---|
| Isle of Palms | 1,004 | $7,287 | $730.96 | 43% |
| Folly Beach | 904 | $7,160 | $572.70 | 47% |
| Sullivan's Island | 23 | $7,082 | $861.05 | 40% |
| Talahi Island | 41 | $6,064 | $358.56 | 51% |
| Charleston | 1,843 | $5,599 | $389.09 | 53% |
| Okatie | 11 | $5,231 | $510.60 | 41% |
| Mount Pleasant | 448 | $4,561 | $303.21 | 54% |
| Kiawah Island | 624 | $4,526 | $615.10 | 34% |
| Whitemarsh Island | 82 | $4,450 | $305.48 | 49% |
| Tybee Island | 1,356 | $4,376 | $423.03 | 42% |