Savannah Airbnb Market Analysis 2026: Short Term Rental Data & Vacation Rental Statistics in Georgia, United States
Is Airbnb profitable in Savannah in 2026? Explore comprehensive Airbnb analytics for Savannah, Georgia, United States to uncover income potential. This 2026 STR market report for Savannah, based on AirROI data from February 2025 to January 2026, reveals key trends in the bustling market of 2,325 active listings.
Whether you're considering an Airbnb investment in Savannah, optimizing your existing vacation rental, or exploring rental arbitrage opportunities, understanding the Savannah Airbnb data is crucial. Leveraging the low regulation environment is key to maximizing your short term rental income potential. Let's dive into the specifics.
Key Savannah Airbnb Performance Metrics Overview
Monthly Airbnb Revenue Variations & Income Potential in Savannah (2026)
Understanding the monthly revenue variations for Airbnb listings in Savannah is key to maximizing your short term rental income potential. Seasonality significantly impacts earnings. Our analysis, based on data from the past 12 months, shows that the peak revenue month for STRs in Savannah is typically March, while January often presents the lowest earnings, highlighting opportunities for strategic pricing adjustments during shoulder and low seasons. Explore the typical Airbnb income in Savannah across different performance tiers:
- Best-in-class properties (Top 10%) achieve $8,585+ monthly, often utilizing dynamic pricing and superior guest experiences.
- Strong performing properties (Top 25%) earn $5,589 or more, indicating effective management and desirable locations/amenities.
- Typical properties (Median) generate around $3,520 per month, representing the average market performance.
- Entry-level properties (Bottom 25%) see earnings around $1,908, often with potential for optimization.
Average Monthly Airbnb Earnings Trend in Savannah
Savannah Airbnb Occupancy Rate Trends (2026)
Maximize your bookings by understanding the Savannah STR occupancy trends. Seasonal demand shifts significantly influence how often properties are booked. Typically, Aprilsees the highest demand (peak season occupancy), while January experiences the lowest (low season). Effective strategies, like adjusting minimum stays or offering promotions, can boost occupancy during slower periods. Here's how different property tiers perform in Savannah:
- Best-in-class properties (Top 10%) achieve 83%+ occupancy, indicating high desirability and potentially optimized availability.
- Strong performing properties (Top 25%) maintain 69% or higher occupancy, suggesting good market fit and guest satisfaction.
- Typical properties (Median) have an occupancy rate around 49%.
- Entry-level properties (Bottom 25%) average 28% occupancy, potentially facing higher vacancy.
Average Monthly Occupancy Rate Trend in Savannah
Average Daily Rate (ADR) Airbnb Trends in Savannah (2026)
Effective short term rental pricing strategy in Savannah involves understanding monthly ADR fluctuations. The Average Daily Rate (ADR) for Airbnb in Savannah typically peaks in October and dips lowest during August. Leveraging Airbnb dynamic pricing tools or strategies based on this seasonality can significantly boost revenue. Here's a look at the typical nightly rates achieved:
- Best-in-class properties (Top 10%) command rates of $530+ per night, often due to premium features or locations.
- Strong performing properties (Top 25%) achieve nightly rates of $335 or more.
- Typical properties (Median) charge around $223 per night.
- Entry-level properties (Bottom 25%) earn around $159 per night.
Average Daily Rate (ADR) Trend by Month in Savannah
Get Live Savannah Market Intelligence 👇

Explore Real-time Analytics
Airbnb Seasonality Analysis & Trends in Savannah (2026)
Peak Season (March, October, April)
- Revenue averages $5,518 per month
- Occupancy rates average 58.2%
- Daily rates average $299
Shoulder Season
- Revenue averages $4,329 per month
- Occupancy maintains around 47.3%
- Daily rates hold near $288
Low Season (January, February, August)
- Revenue drops to average $3,381 per month
- Occupancy decreases to average 42.2%
- Daily rates adjust to average $267
Seasonality Insights for Savannah
- The Airbnb seasonality in Savannah shows moderate seasonality with distinct peak and low periods. While the sections above show seasonal averages, it's also insightful to look at the extremes:
- During the high season, the absolute peak month showcases Savannah's highest earning potential, with monthly revenues capable of climbing to $5,823, occupancy reaching a high of 60.5%, and ADRs peaking at $314.
- Conversely, the slowest single month of the year, typically falling within the low season, marks the market's lowest point. In this month, revenue might dip to $3,059, occupancy could drop to 34.1%, and ADRs may adjust down to $255.
- Understanding both the seasonal averages and these monthly peaks and troughs in revenue, occupancy, and ADR is crucial for maximizing your Airbnb profit potential in Savannah.
Seasonal Strategies for Maximizing Profit
- Peak Season: Maximize revenue through premium pricing and potentially longer minimum stays. Ensure high availability.
- Low Season: Offer competitive pricing, special promotions (e.g., extended stay discounts), and flexible cancellation policies. Target off-season travelers like remote workers or budget-conscious guests.
- Shoulder Seasons: Implement dynamic pricing that balances peak and low rates. Target weekend travelers or specific events. Offer slightly more flexible terms than peak season.
- Regularly analyze your own performance against these Savannah seasonality benchmarks and adjust your pricing and availability strategy accordingly.
Best Areas for Airbnb Investment in Savannah (2026)
Exploring the top neighborhoods for short-term rentals in Savannah? This section highlights key areas, outlining why they are attractive for hosts and guests, along with notable local attractions. Consider these locations based on your target guest profile and investment strategy.
| Neighborhood / Area | Why Host Here? (Target Guests & Appeal) | Key Attractions & Landmarks |
|---|---|---|
| Historic District | Known for its charming cobblestone streets, the Historic District is the heart of Savannah with century-old homes, gardens, and rich history. It offers an appealing experience for those wanting to soak in Southern culture and history. | Forsyth Park, Savannah College of Art and Design, The Cathedral of St. John the Baptist, River Street, Owens-Thomas House, Chippewa Square |
| River Street | A bustling waterfront area known for its vibrant nightlife, shops, and restaurants. Perfect for visitors who want to be in the midst of the action and enjoy views of the Savannah River. | Savannah River, The Cotton Exchange, Historic River Street, The Waving Girl statue, River Street Market, Dueling Pianos |
| Tybee Island | A short drive from Savannah, Tybee Island offers beautiful beaches and a laid-back atmosphere ideal for vacationers looking to relax by the ocean. It's popular during the summer months. | Tybee Island Beach, Tybee Island Lighthouse, Fort Pulaski National Monument, Dolphin Tours, Cockspur Island Lighthouse, Biking on the beach |
| Starland District | A growing arts community known for its eclectic vibe, the Starland District has a mix of art galleries, trendy shops, and eateries. It attracts younger crowds and is hip and vibrant. | Starland Dairy, The Foxy Loxy Cafe, SCAD Museum of Art, Starlandia Creative Placemaking, Local breweries, Art installations |
| Forsyth Park | Surrounding Savannah's largest park, this area is beautiful and historic, perfect for families and those who appreciate greenery and outdoor activities. It's also close to many tourist attractions. | Forsyth Park Fountain, Savannah's Historic District, Walking trails, Picnic areas, Playgrounds, Public gardens |
| Bonaventure Cemetery | An iconic and beautiful cemetery known for its stunning landscapes and historic graves. It's a unique attraction that draws visitors interested in history and architecture. | Grave of Johnny Mercer, Historic Oaks, Walking tours, Bird watching, The cemetery's architecture, Southern Gothic scenery |
| Southside Savannah | A suburban area that caters more to locals and families. It has shopping, dining options, and is in proximity to the area's major attractions, providing a calm base for visiting Savannah. | Savannah Mall, Southside shopping centers, Dining options, Cinemas, Fitness centers, Parks |
| Midtown Savannah | This area features a mix of historic homes and modern amenities, making it appealing for both tourists and those looking to invest in rental properties. It's quieter and offers local dining options. | Historic architecture, Parks, Local restaurants, Cultural sites, Proximity to downtown, Community events |
Understanding Airbnb License Requirements & STR Laws in Savannah (2026)
While Savannah, Georgia, United States currently shows low STR regulations, specific Airbnb license requirements might still exist or change. Always verify the latest short term rental regulations and Airbnb license requirements directly with local government authorities for Savannah to ensure full compliance before hosting.
(Source: AirROI data, 2026, based on 0% licensed listings)
Top Performing Airbnb Properties in Savannah (2026)
Benchmark your potential! Explore examples of top-performing Airbnb properties in Savannahbased on Trailing Twelve Month (TTM) revenue. Analyze their characteristics, revenue, occupancy rate, and ADR to understand what drives success in this market.

Large Contemporary Savannah Retreat | Near Forsyth
Entire Place • 12 bedrooms
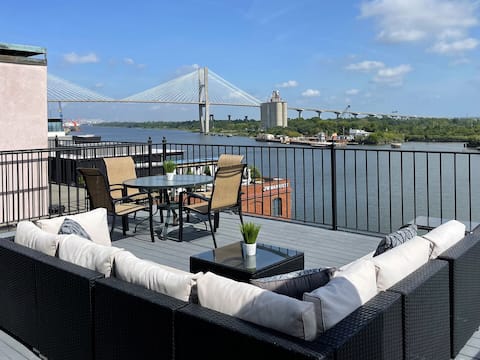
Amazing River Views from Private Balcony
Entire Place • 6 bedrooms
Savannah Historic Home | Sleeps 20, Near Downtown
Entire Place • 7 bedrooms
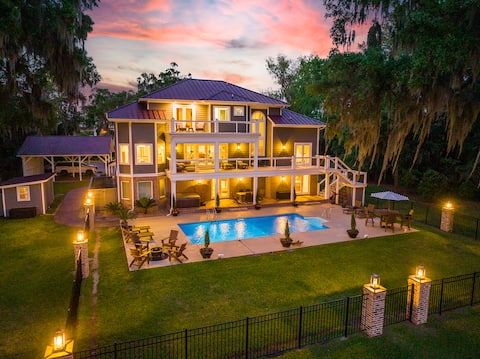
Waterfront w/ Pool & Hot Tub - 10 Min to Downtown
Entire Place • 6 bedrooms
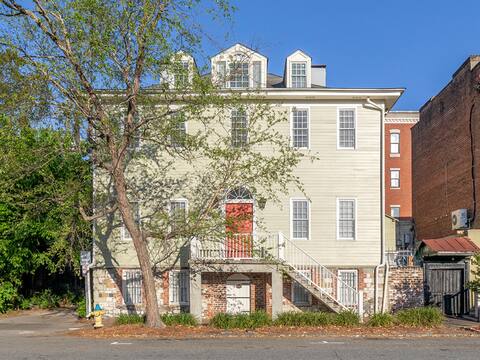
Habersham House | Historic Home, Walk To River St
Entire Place • 7 bedrooms
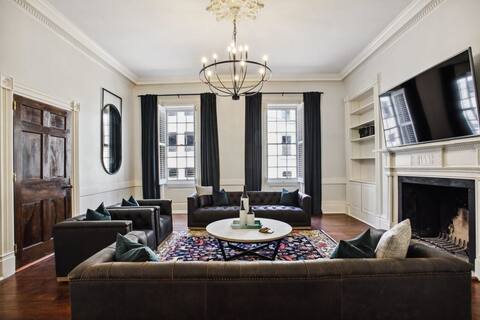
Jewel on Jones - A Southern, Savannah Mansion
Entire Place • 6 bedrooms
Note: Performance varies based on location, size, amenities, seasonality, and management quality. Data reflects the past 12 months.
Top Performing Airbnb Hosts in Savannah (2026)
Learn from the best! This table showcases top-performing Airbnb hosts in Savannah based on the number of properties managed and estimated total revenue over the past year. Analyze their scale and performance metrics.
| Host Name | Properties | Grossing Revenue | Stay Reviews | Avg Rating |
|---|---|---|---|---|
| Lucky Savannah | 301 | $11,821,131 | 6134 | 4.67/5.0 |
| Southern Belle | 165 | $10,948,120 | 8099 | 4.71/5.0 |
| Brandon & Chase | 107 | $6,213,232 | 12600 | 4.90/5.0 |
| Heirloom | 41 | $4,360,863 | 1563 | 4.77/5.0 |
| Mary | 57 | $2,788,944 | 6336 | 4.85/5.0 |
| Tybee Vacation Rentals | 21 | $1,316,197 | 590 | 4.64/5.0 |
| Allan | 17 | $1,305,403 | 1000 | 4.88/5.0 |
| Farrell | 14 | $1,146,395 | 2093 | 4.95/5.0 |
| Jay | 11 | $1,044,956 | 855 | 4.83/5.0 |
| Luxury Living Savannah | 17 | $966,835 | 791 | 4.87/5.0 |
Analyzing the strategies of top hosts, such as their property selection, pricing, and guest communication, can offer valuable lessons for optimizing your own Airbnb operations in Savannah.
Dive Deeper: Advanced Savannah STR Market Data (2026)
Ready to unlock more insights? AirROI provides access to advanced metrics and comprehensive Airbnb data for Savannah. Explore detailed analytics beyond this report to refine your investment strategy, optimize pricing, and maximize your vacation rental profits.
Explore Advanced MetricsSavannah Short-Term Rental Market Composition (2026): Property & Room Types
Room Type Distribution
Property Type Distribution
Market Composition Insights for Savannah
- The Savannah Airbnb market composition is heavily skewed towards Entire Home/Apt listings, which make up 92.9% of the 2,325 active rentals. This indicates strong guest preference for privacy and space.
- Looking at the property type distribution in Savannah, House properties are the most common (50.8%), reflecting the local real estate landscape.
- Houses represent a significant 50.8% portion, catering likely to families or larger groups.
- Smaller segments like hotel/boutique, others, outdoor/unique (combined 5.1%) offer potential for unique stay experiences.
Savannah Airbnb Room Capacity Analysis (2026): Bedroom Distribution
Distribution of Listings by Number of Bedrooms
Room Capacity Insights for Savannah
- The dominant room capacity in Savannah is 2 bedrooms listings, making up 29.6% of the market. This suggests a strong demand for properties suitable for couples or solo travelers.
- Together, 2 bedrooms and 1 bedroom properties represent 58.0% of the active Airbnb listings in Savannah, indicating a high concentration in these sizes.
- A significant 34.6% of listings offer 3+ bedrooms, catering to larger groups and families seeking more space in Savannah.
Savannah Vacation Rental Guest Capacity Trends (2026)
Distribution of Listings by Guest Capacity
Guest Capacity Insights for Savannah
- The most common guest capacity trend in Savannah vacation rentals is listings accommodating 4 guests (30.5%). This suggests the primary traveler segment is likely small families or groups.
- Properties designed for 4 guests and 8+ guests dominate the Savannah STR market, accounting for 52.2% of listings.
- 41.4% of properties accommodate 6+ guests, serving the market segment for larger families or group travel in Savannah.
- On average, properties in Savannah are equipped to host 4.7 guests.
Savannah Airbnb Booking Patterns (2026): Available vs. Booked Days
Available Days Distribution
Booked Days Distribution
Booking Pattern Insights for Savannah
- The most common availability pattern in Savannah falls within the 181-270 days range, representing 35.4% of listings. This suggests many properties have significant open periods on their calendars.
- Approximately 66.6% of listings show high availability (181+ days open annually), indicating potential for increased bookings or specific owner usage patterns.
- For booked days, the 91-180 days range is most frequent in Savannah (35.4%), reflecting common guest stay durations or potential owner blocking patterns.
- A notable 35.2% of properties secure long booking periods (181+ days booked per year), highlighting successful long-term rental strategies or significant owner usage.
Savannah Airbnb Minimum Stay Requirements Analysis
Distribution of Listings by Minimum Night Requirement
1 Night
430 listings
18.5% of total
2 Nights
735 listings
31.6% of total
3 Nights
74 listings
3.2% of total
4-6 Nights
24 listings
1% of total
7-29 Nights
165 listings
7.1% of total
30+ Nights
896 listings
38.6% of total
Key Insights
- The most prevalent minimum stay requirement in Savannah is 30+ Nights, adopted by 38.6% of listings. This highlights the market's preference for longer commitments.
- A significant segment (38.6%) caters to monthly stays (30+ nights) in Savannah, pointing to opportunities in the extended-stay market.
Recommendations
- Align with the market by considering a 30+ Nights minimum stay, as 38.6% of Savannah hosts use this setting.
- If feasible, allowing 1-night stays, especially midweek or during low season, could capture last-minute bookings, as only 18.5% currently do.
- A 2-night minimum appears standard (31.6%). Consider this for weekends or peak periods.
- Explore offering discounts for stays of 30+ nights to attract the 38.6% of the market seeking extended stays.
- Adjust minimum nights based on seasonality – potentially shorter during low season and longer during peak demand periods in Savannah.
Savannah Airbnb Cancellation Policy Trends Analysis (2026)
Super Strict 60 Days
88 listings
3.8% of total
Super Strict 30 Days
71 listings
3.1% of total
Limited
48 listings
2.1% of total
Flexible
191 listings
8.2% of total
Moderate
571 listings
24.6% of total
Firm
1046 listings
45.1% of total
Strict
304 listings
13.1% of total
Cancellation Policy Insights for Savannah
- The prevailing Airbnb cancellation policy trend in Savannah is Firm, used by 45.1% of listings.
- A majority (58.2%) of hosts in Savannah utilize Firm or Strict policies, indicating a market where hosts prioritize booking security.
Recommendations for Hosts
- Consider adopting a Firm policy to align with the 45.1% market standard in Savannah.
- Using a Strict policy might deter some guests, as only 13.1% of listings use it. Evaluate if potential revenue protection outweighs possible lower booking rates.
- Regularly review your cancellation policy against competitors and market demand shifts in Savannah.
Savannah STR Booking Lead Time Analysis (2026)
Average Booking Lead Time by Month
Booking Lead Time Insights for Savannah
- The overall average booking lead time for vacation rentals in Savannah is 52 days.
- Guests book furthest in advance for stays during April (average 69 days), likely coinciding with peak travel demand or local events.
- The shortest booking windows occur for stays in July (average 41 days), indicating more last-minute travel plans during this time.
- Seasonally, Spring (65 days avg.) sees the longest lead times, while Summer (45 days avg.) has the shortest, reflecting typical travel planning cycles.
Recommendations for Hosts
- Use the overall average lead time (52 days) as a baseline for your pricing and availability strategy in Savannah.
- For April stays, consider implementing length-of-stay discounts or slightly higher rates for bookings made less than 69 days out to capitalize on advance planning.
- Target marketing efforts for the Spring season well in advance (at least 65 days) to capture early planners.
- Monitor your own booking lead times against these Savannah averages to identify opportunities for dynamic pricing adjustments.
Popular & Essential Airbnb Amenities in Savannah (2026)
Amenity Prevalence
Amenity Insights for Savannah
- Essential amenities in Savannah that guests expect include: Wifi, Air conditioning, TV, Smoke alarm, Heating. Lacking these (any) could significantly impact bookings.
- Popular amenities like Hot water, Coffee maker, Kitchen are common but not universal. Offering these can provide a competitive edge.
Recommendations for Hosts
- Ensure your listing includes all essential amenities for Savannah: Wifi, Air conditioning, TV, Smoke alarm, Heating.
- Prioritize adding missing essentials: Wifi, Air conditioning, TV, Smoke alarm, Heating.
- Consider adding popular differentiators like Hot water or Coffee maker to increase appeal.
- Highlight unique or less common amenities you offer (e.g., hot tub, dedicated workspace, EV charger) in your listing description and photos.
- Regularly check competitor amenities in Savannah to stay competitive.
Savannah Airbnb Guest Demographics & Profile Analysis (2026)
Guest Profile Summary for Savannah
- The typical guest profile for Airbnb in Savannah consists of primarily domestic travelers (96%), often arriving from nearby Atlanta, typically belonging to the Post-2000s (Gen Z/Alpha) group (50%), primarily speaking English or Spanish.
- Domestic travelers account for 95.5% of guests.
- Key international markets include United States (95.5%) and DC (0.8%).
- Top languages spoken are English (73%) followed by Spanish (11.8%).
- A significant demographic segment is the Post-2000s (Gen Z/Alpha) group, representing 50% of guests.
Recommendations for Hosts
- Target domestic marketing efforts towards travelers from Atlanta and New York.
- Tailor amenities and listing descriptions to appeal to the dominant Post-2000s (Gen Z/Alpha) demographic (e.g., highlight fast WiFi, smart home features, local guides).
- Highlight unique local experiences or amenities relevant to the primary guest profile.
- Consider seasonal promotions aligned with peak travel times for key origin markets.
Nearby Short-Term Rental Market Comparison
How does the Savannah Airbnb market stack up against its neighbors? Compare key performance metrics like average monthly revenue, ADR, and occupancy rates in surrounding areas to understand the broader regional STR landscape.
| Market | Active Properties | Monthly Revenue | Daily Rate | Avg. Occupancy |
|---|---|---|---|---|
| Talahi Island | 41 | $6,064 | $358.56 | 51% |
| Okatie | 11 | $5,231 | $510.60 | 41% |
| Kiawah Island | 624 | $4,526 | $615.10 | 34% |
| Whitemarsh Island | 82 | $4,450 | $305.48 | 49% |
| Tybee Island | 1,356 | $4,376 | $423.03 | 42% |
| St. Simons | 91 | $4,162 | $379.84 | 42% |
| Appling | 21 | $4,080 | $617.34 | 35% |
| Wilmington Island | 113 | $3,954 | $322.99 | 46% |
| Johns Island | 115 | $3,654 | $419.02 | 42% |
| Fripp Island | 218 | $3,562 | $464.29 | 35% |