Ranger Airbnb Market Analysis 2026: Short Term Rental Data & Vacation Rental Statistics in Georgia, United States
Is Airbnb profitable in Ranger in 2026? Explore comprehensive Airbnb analytics for Ranger, Georgia, United States to uncover income potential. This 2026 STR market report for Ranger, based on AirROI data from February 2025 to January 2026, reveals key trends in the niche market of 19 active listings.
Whether you're considering an Airbnb investment in Ranger, optimizing your existing vacation rental, or exploring rental arbitrage opportunities, understanding the Ranger Airbnb data is crucial. Leveraging the low regulation environment is key to maximizing your short term rental income potential. Let's dive into the specifics.
Key Ranger Airbnb Performance Metrics Overview
Monthly Airbnb Revenue Variations & Income Potential in Ranger (2026)
Understanding the monthly revenue variations for Airbnb listings in Ranger is key to maximizing your short term rental income potential. Seasonality significantly impacts earnings. Our analysis, based on data from the past 12 months, shows that the peak revenue month for STRs in Ranger is typically December, while February often presents the lowest earnings, highlighting opportunities for strategic pricing adjustments during shoulder and low seasons. Explore the typical Airbnb income in Ranger across different performance tiers:
- Best-in-class properties (Top 10%) achieve $7,256+ monthly, often utilizing dynamic pricing and superior guest experiences.
- Strong performing properties (Top 25%) earn $4,248 or more, indicating effective management and desirable locations/amenities.
- Typical properties (Median) generate around $2,639 per month, representing the average market performance.
- Entry-level properties (Bottom 25%) see earnings around $1,549, often with potential for optimization.
Average Monthly Airbnb Earnings Trend in Ranger
Ranger Airbnb Occupancy Rate Trends (2026)
Maximize your bookings by understanding the Ranger STR occupancy trends. Seasonal demand shifts significantly influence how often properties are booked. Typically, Julysees the highest demand (peak season occupancy), while January experiences the lowest (low season). Effective strategies, like adjusting minimum stays or offering promotions, can boost occupancy during slower periods. Here's how different property tiers perform in Ranger:
- Best-in-class properties (Top 10%) achieve 63%+ occupancy, indicating high desirability and potentially optimized availability.
- Strong performing properties (Top 25%) maintain 50% or higher occupancy, suggesting good market fit and guest satisfaction.
- Typical properties (Median) have an occupancy rate around 34%.
- Entry-level properties (Bottom 25%) average 19% occupancy, potentially facing higher vacancy.
Average Monthly Occupancy Rate Trend in Ranger
Average Daily Rate (ADR) Airbnb Trends in Ranger (2026)
Effective short term rental pricing strategy in Ranger involves understanding monthly ADR fluctuations. The Average Daily Rate (ADR) for Airbnb in Ranger typically peaks in December and dips lowest during February. Leveraging Airbnb dynamic pricing tools or strategies based on this seasonality can significantly boost revenue. Here's a look at the typical nightly rates achieved:
- Best-in-class properties (Top 10%) command rates of $393+ per night, often due to premium features or locations.
- Strong performing properties (Top 25%) achieve nightly rates of $319 or more.
- Typical properties (Median) charge around $246 per night.
- Entry-level properties (Bottom 25%) earn around $191 per night.
Average Daily Rate (ADR) Trend by Month in Ranger
Get Live Ranger Market Intelligence 👇

Explore Real-time Analytics
Airbnb Seasonality Analysis & Trends in Ranger (2026)
Peak Season (December, July, October)
- Revenue averages $4,752 per month
- Occupancy rates average 43.9%
- Daily rates average $309
Shoulder Season
- Revenue averages $3,213 per month
- Occupancy maintains around 35.3%
- Daily rates hold near $273
Low Season (February, March, May)
- Revenue drops to average $2,283 per month
- Occupancy decreases to average 31.1%
- Daily rates adjust to average $232
Seasonality Insights for Ranger
- The Airbnb seasonality in Ranger shows highly seasonal trends requiring careful strategy. While the sections above show seasonal averages, it's also insightful to look at the extremes:
- During the high season, the absolute peak month showcases Ranger's highest earning potential, with monthly revenues capable of climbing to $4,946, occupancy reaching a high of 50.1%, and ADRs peaking at $336.
- Conversely, the slowest single month of the year, typically falling within the low season, marks the market's lowest point. In this month, revenue might dip to $1,857, occupancy could drop to 26.2%, and ADRs may adjust down to $221.
- Understanding both the seasonal averages and these monthly peaks and troughs in revenue, occupancy, and ADR is crucial for maximizing your Airbnb profit potential in Ranger.
Seasonal Strategies for Maximizing Profit
- Peak Season: Maximize revenue through premium pricing and potentially longer minimum stays. Ensure high availability.
- Low Season: Offer competitive pricing, special promotions (e.g., extended stay discounts), and flexible cancellation policies. Target off-season travelers like remote workers or budget-conscious guests.
- Shoulder Seasons: Implement dynamic pricing that balances peak and low rates. Target weekend travelers or specific events. Offer slightly more flexible terms than peak season.
- Regularly analyze your own performance against these Ranger seasonality benchmarks and adjust your pricing and availability strategy accordingly.
Best Areas for Airbnb Investment in Ranger (2026)
Exploring the top neighborhoods for short-term rentals in Ranger? This section highlights key areas, outlining why they are attractive for hosts and guests, along with notable local attractions. Consider these locations based on your target guest profile and investment strategy.
| Neighborhood / Area | Why Host Here? (Target Guests & Appeal) | Key Attractions & Landmarks |
|---|---|---|
| Ranger Historic District | Charming area with historic buildings offering a glimpse into early 20th-century life. Suitable for guests interested in history and architecture, with local events and festivals. | Ranger Historic Depot, Annual Ranger Bluegrass Festival, Ranger Railroad Depot, Local Artisan Shops, Historic Walking Tours |
| Lake Allatoona Area | Beautiful lakeside location perfect for outdoor enthusiasts. Great for families and groups looking to enjoy water activities and nature. | Lake Allatoona, Pine Log Creek Wildlife Management Area, Red Top Mountain State Park, Beaver Creek Marina, Public Beaches |
| Pine Log | A serene and rural area that offers a peaceful retreat for visitors. Ideal for nature lovers and those seeking tranquility away from the city. | Pine Log Creek, Scenic Nature Trails, Wildlife Viewing, Rural Landscapes, Picnic Areas |
| Talkinging Rock | A quaint and quiet area close to the mountains. Popular for guests looking to experience rural Georgia and outdoor adventure. | Talking Rock Creek, Nearby Hiking Trails, Local Vineyards, Historic Sites, Seasonal Festivals |
| Carters Lake | Scenic location near the largest lake in North Georgia, great for fishing, boating, and camping experiences. | Carters Lake, Southern Whitewater, Boating and Fishing, Campgrounds, Nature Trails |
| Sugar Valley | Nestled in nature with scenic views, providing a perfect getaway for couples and families alike looking for a peaceful escape. | Sugar Valley Nature Trails, Rural Landscapes, Local Farms, Outdoor Activities, Community Events |
| Chatsworth | A neighboring town offering charming southern hospitality and attractions for visitors interested in local culture and nature. | Fort Mountain State Park, Chatsworth Historic Sites, Local Antique Shops, Outdoor Recreational Opportunities, Craft Festivals |
| Dalton | Known as the 'Carpet Capital of the World', it offers unique cultural experiences along with nearby natural attractions. | Dalton History Museum, Local Carpet Exhibitions, Cohutta Wilderness, Prater's Mill, Historic Downtown Dalton |
Understanding Airbnb License Requirements & STR Laws in Ranger (2026)
While Ranger, Georgia, United States currently shows low STR regulations, specific Airbnb license requirements might still exist or change. Always verify the latest short term rental regulations and Airbnb license requirements directly with local government authorities for Ranger to ensure full compliance before hosting.
(Source: AirROI data, 2026, finding no licensed listings among those analyzed)
Top Performing Airbnb Properties in Ranger (2026)
Benchmark your potential! Explore examples of top-performing Airbnb properties in Rangerbased on Trailing Twelve Month (TTM) revenue. Analyze their characteristics, revenue, occupancy rate, and ADR to understand what drives success in this market.
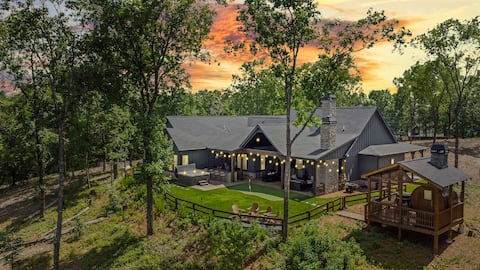
Pet Friendly/ Views/ Hot Tub / Game Room, Sauna
Entire Place • 4 bedrooms
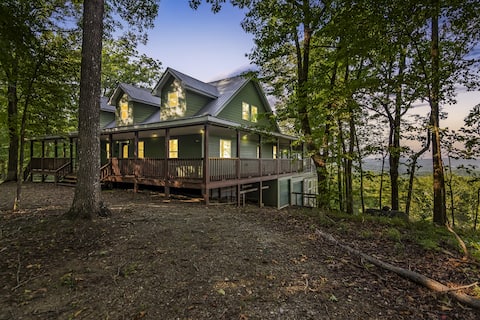
Year Round Mtn View + EV Charger + Hot Tub + Firep
Entire Place • 6 bedrooms
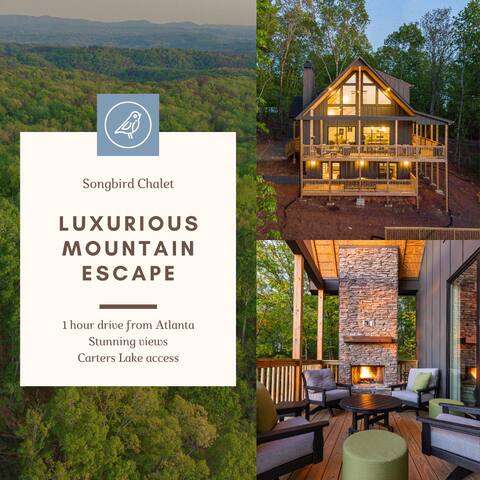
Songbird Luxe Mountain Retreat/Views/Game Room
Entire Place • 4 bedrooms

Mountain Side Cabin with Hot Tub and Fire Pit
Entire Place • 1 bedroom
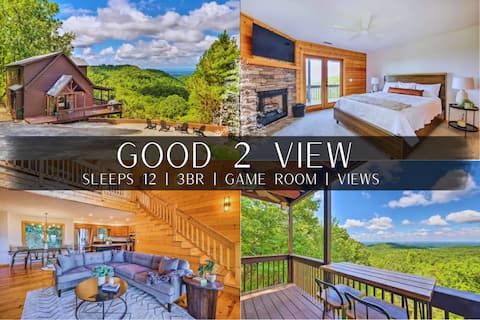
Family | Group Cabin | Deck, Views, Game Room
Entire Place • 3 bedrooms

North GA cabin 'Summit Hideaway'
Entire Place • 4 bedrooms
Note: Performance varies based on location, size, amenities, seasonality, and management quality. Data reflects the past 12 months.
Top Performing Airbnb Hosts in Ranger (2026)
Learn from the best! This table showcases top-performing Airbnb hosts in Ranger based on the number of properties managed and estimated total revenue over the past year. Analyze their scale and performance metrics.
| Host Name | Properties | Grossing Revenue | Stay Reviews | Avg Rating |
|---|---|---|---|---|
| Brandon And Tiffany | 2 | $202,705 | 56 | 4.77/5.0 |
| Anna | 1 | $53,518 | 58 | 4.88/5.0 |
| Dominic | 2 | $48,314 | 25 | 4.42/5.0 |
| Mary | 1 | $41,108 | 184 | 4.98/5.0 |
| Helen | 1 | $37,127 | 31 | 4.84/5.0 |
| Carisa | 1 | $34,116 | 235 | 4.74/5.0 |
| Evolve | 1 | $33,894 | 31 | 4.87/5.0 |
| Trevor | 1 | $29,081 | 54 | 4.93/5.0 |
| Michael | 1 | $27,072 | 14 | 4.71/5.0 |
| Raul | 1 | $26,652 | 58 | 4.66/5.0 |
Analyzing the strategies of top hosts, such as their property selection, pricing, and guest communication, can offer valuable lessons for optimizing your own Airbnb operations in Ranger.
Dive Deeper: Advanced Ranger STR Market Data (2026)
Ready to unlock more insights? AirROI provides access to advanced metrics and comprehensive Airbnb data for Ranger. Explore detailed analytics beyond this report to refine your investment strategy, optimize pricing, and maximize your vacation rental profits.
Explore Advanced MetricsRanger Short-Term Rental Market Composition (2026): Property & Room Types
Room Type Distribution
Property Type Distribution
Market Composition Insights for Ranger
- The Ranger Airbnb market composition is heavily skewed towards Entire Home/Apt listings, which make up 100% of the 19 active rentals. This indicates strong guest preference for privacy and space.
- Looking at the property type distribution in Ranger, Outdoor/Unique properties are the most common (78.9%), reflecting the local real estate landscape.
- Houses represent a significant 21.1% portion, catering likely to families or larger groups.
Ranger Airbnb Room Capacity Analysis (2026): Bedroom Distribution
Distribution of Listings by Number of Bedrooms
Room Capacity Insights for Ranger
- The dominant room capacity in Ranger is 3 bedrooms listings, making up 31.6% of the market. This suggests a strong demand for properties suitable for families or small groups.
- Together, 3 bedrooms and 4 bedrooms properties represent 63.2% of the active Airbnb listings in Ranger, indicating a high concentration in these sizes.
- A significant 79.0% of listings offer 3+ bedrooms, catering to larger groups and families seeking more space in Ranger.
Ranger Vacation Rental Guest Capacity Trends (2026)
Distribution of Listings by Guest Capacity
Guest Capacity Insights for Ranger
- The most common guest capacity trend in Ranger vacation rentals is listings accommodating 8+ guests (57.9%). This suggests the primary traveler segment is likely larger groups.
- Properties designed for 8+ guests and 4 guests dominate the Ranger STR market, accounting for 73.7% of listings.
- 73.7% of properties accommodate 6+ guests, serving the market segment for larger families or group travel in Ranger.
- On average, properties in Ranger are equipped to host 6.6 guests.
Ranger Airbnb Booking Patterns (2026): Available vs. Booked Days
Available Days Distribution
Booked Days Distribution
Booking Pattern Insights for Ranger
- The most common availability pattern in Ranger falls within the 181-270 days range, representing 52.6% of listings. This suggests many properties have significant open periods on their calendars.
- Approximately 84.2% of listings show high availability (181+ days open annually), indicating potential for increased bookings or specific owner usage patterns.
- For booked days, the 91-180 days range is most frequent in Ranger (57.9%), reflecting common guest stay durations or potential owner blocking patterns.
- A notable 15.8% of properties secure long booking periods (181+ days booked per year), highlighting successful long-term rental strategies or significant owner usage.
Ranger Airbnb Minimum Stay Requirements Analysis
Distribution of Listings by Minimum Night Requirement
1 Night
1 listings
5.3% of total
2 Nights
10 listings
52.6% of total
3 Nights
1 listings
5.3% of total
30+ Nights
7 listings
36.8% of total
Key Insights
- The most prevalent minimum stay requirement in Ranger is 2 Nights, adopted by 52.6% of listings. This highlights the market's preference for shorter, flexible bookings.
- A significant segment (36.8%) caters to monthly stays (30+ nights) in Ranger, pointing to opportunities in the extended-stay market.
Recommendations
- Align with the market by considering a 2 Nights minimum stay, as 52.6% of Ranger hosts use this setting.
- If feasible, allowing 1-night stays, especially midweek or during low season, could capture last-minute bookings, as only 5.3% currently do.
- A 2-night minimum appears standard (52.6%). Consider this for weekends or peak periods.
- Explore offering discounts for stays of 30+ nights to attract the 36.8% of the market seeking extended stays.
- Adjust minimum nights based on seasonality – potentially shorter during low season and longer during peak demand periods in Ranger.
Ranger Airbnb Cancellation Policy Trends Analysis (2026)
Flexible
2 listings
10.5% of total
Moderate
10 listings
52.6% of total
Firm
6 listings
31.6% of total
Strict
1 listings
5.3% of total
Cancellation Policy Insights for Ranger
- The prevailing Airbnb cancellation policy trend in Ranger is Moderate, used by 52.6% of listings.
- There's a relatively balanced mix between guest-friendly (63.1%) and stricter (36.9%) policies, offering choices for different guest needs.
- Strict cancellation policies are quite rare (5.3%), potentially making listings with this policy less competitive unless justified by high demand or property type.
Recommendations for Hosts
- Consider adopting a Moderate policy to align with the 52.6% market standard in Ranger.
- Using a Strict policy might deter some guests, as only 5.3% of listings use it. Evaluate if potential revenue protection outweighs possible lower booking rates.
- Regularly review your cancellation policy against competitors and market demand shifts in Ranger.
Ranger STR Booking Lead Time Analysis (2026)
Average Booking Lead Time by Month
Booking Lead Time Insights for Ranger
- The overall average booking lead time for vacation rentals in Ranger is 36 days.
- Guests book furthest in advance for stays during November (average 77 days), likely coinciding with peak travel demand or local events.
- The shortest booking windows occur for stays in March (average 19 days), indicating more last-minute travel plans during this time.
- Seasonally, Fall (55 days avg.) sees the longest lead times, while Spring (27 days avg.) has the shortest, reflecting typical travel planning cycles.
Recommendations for Hosts
- Use the overall average lead time (36 days) as a baseline for your pricing and availability strategy in Ranger.
- For November stays, consider implementing length-of-stay discounts or slightly higher rates for bookings made less than 77 days out to capitalize on advance planning.
- Target marketing efforts for the Fall season well in advance (at least 55 days) to capture early planners.
- Monitor your own booking lead times against these Ranger averages to identify opportunities for dynamic pricing adjustments.
Popular & Essential Airbnb Amenities in Ranger (2026)
Amenity Prevalence
No amenities with partial availability (less than 100%) were found to display in the chart. All essential amenities might be present in all listings. Check insights below.
Amenity Insights for Ranger
- Essential amenities in Ranger that guests expect include: Refrigerator, Heating, Air conditioning, Kitchen, Smoke alarm, Microwave, Dishes and silverware, Hot water, Ceiling fan, Free parking on premises. Lacking these (any) could significantly impact bookings.
Recommendations for Hosts
- Ensure your listing includes all essential amenities for Ranger: Refrigerator, Heating, Air conditioning, Kitchen, Smoke alarm, Microwave, Dishes and silverware, Hot water, Ceiling fan, Free parking on premises.
- Highlight unique or less common amenities you offer (e.g., hot tub, dedicated workspace, EV charger) in your listing description and photos.
- Regularly check competitor amenities in Ranger to stay competitive.
Ranger Airbnb Guest Demographics & Profile Analysis (2026)
Guest Profile Summary for Ranger
- The typical guest profile for Airbnb in Ranger consists of primarily domestic travelers (99%), often arriving from nearby Atlanta, typically belonging to the Post-2000s (Gen Z/Alpha) group (50%), primarily speaking English or Spanish.
- Domestic travelers account for 99.1% of guests.
- Key international markets include United States (99.1%) and France (0.9%).
- Top languages spoken are English (69.2%) followed by Spanish (17.3%).
- A significant demographic segment is the Post-2000s (Gen Z/Alpha) group, representing 50% of guests.
Recommendations for Hosts
- Target domestic marketing efforts towards travelers from Atlanta and Marietta.
- Tailor amenities and listing descriptions to appeal to the dominant Post-2000s (Gen Z/Alpha) demographic (e.g., highlight fast WiFi, smart home features, local guides).
- Highlight unique local experiences or amenities relevant to the primary guest profile.
- Consider seasonal promotions aligned with peak travel times for key origin markets.
Nearby Short-Term Rental Market Comparison
How does the Ranger Airbnb market stack up against its neighbors? Compare key performance metrics like average monthly revenue, ADR, and occupancy rates in surrounding areas to understand the broader regional STR landscape.
| Market | Active Properties | Monthly Revenue | Daily Rate | Avg. Occupancy |
|---|---|---|---|---|
| Sevier County | 68 | $7,108 | $567.95 | 44% |
| Bogart | 13 | $5,528 | $637.81 | 35% |
| Gilmer County | 26 | $5,298 | $459.59 | 40% |
| Sevierville | 6,269 | $4,747 | $370.20 | 46% |
| Fannin County | 42 | $4,574 | $435.93 | 38% |
| East Ellijay | 15 | $4,415 | $368.05 | 41% |
| Epworth | 79 | $4,411 | $406.97 | 40% |
| Gatlinburg | 3,565 | $4,385 | $353.70 | 45% |
| Commerce | 19 | $4,298 | $285.34 | 45% |
| Eatonton | 236 | $4,178 | $502.80 | 33% |