Panthersville Airbnb Market Analysis 2026: Short Term Rental Data & Vacation Rental Statistics in Georgia, United States
Is Airbnb profitable in Panthersville in 2026? Explore comprehensive Airbnb analytics for Panthersville, Georgia, United States to uncover income potential. This 2026 STR market report for Panthersville, based on AirROI data from February 2025 to January 2026, reveals key trends in the niche market of 72 active listings.
Whether you're considering an Airbnb investment in Panthersville, optimizing your existing vacation rental, or exploring rental arbitrage opportunities, understanding the Panthersville Airbnb data is crucial. Leveraging the low regulation environment is key to maximizing your short term rental income potential. Let's dive into the specifics.
Key Panthersville Airbnb Performance Metrics Overview
Monthly Airbnb Revenue Variations & Income Potential in Panthersville (2026)
Understanding the monthly revenue variations for Airbnb listings in Panthersville is key to maximizing your short term rental income potential. Seasonality significantly impacts earnings. Our analysis, based on data from the past 12 months, shows that the peak revenue month for STRs in Panthersville is typically December, while February often presents the lowest earnings, highlighting opportunities for strategic pricing adjustments during shoulder and low seasons. Explore the typical Airbnb income in Panthersville across different performance tiers:
- Best-in-class properties (Top 10%) achieve $5,040+ monthly, often utilizing dynamic pricing and superior guest experiences.
- Strong performing properties (Top 25%) earn $3,278 or more, indicating effective management and desirable locations/amenities.
- Typical properties (Median) generate around $1,715 per month, representing the average market performance.
- Entry-level properties (Bottom 25%) see earnings around $754, often with potential for optimization.
Average Monthly Airbnb Earnings Trend in Panthersville
Panthersville Airbnb Occupancy Rate Trends (2026)
Maximize your bookings by understanding the Panthersville STR occupancy trends. Seasonal demand shifts significantly influence how often properties are booked. Typically, Marchsees the highest demand (peak season occupancy), while January experiences the lowest (low season). Effective strategies, like adjusting minimum stays or offering promotions, can boost occupancy during slower periods. Here's how different property tiers perform in Panthersville:
- Best-in-class properties (Top 10%) achieve 79%+ occupancy, indicating high desirability and potentially optimized availability.
- Strong performing properties (Top 25%) maintain 63% or higher occupancy, suggesting good market fit and guest satisfaction.
- Typical properties (Median) have an occupancy rate around 39%.
- Entry-level properties (Bottom 25%) average 18% occupancy, potentially facing higher vacancy.
Average Monthly Occupancy Rate Trend in Panthersville
Average Daily Rate (ADR) Airbnb Trends in Panthersville (2026)
Effective short term rental pricing strategy in Panthersville involves understanding monthly ADR fluctuations. The Average Daily Rate (ADR) for Airbnb in Panthersville typically peaks in December and dips lowest during April. Leveraging Airbnb dynamic pricing tools or strategies based on this seasonality can significantly boost revenue. Here's a look at the typical nightly rates achieved:
- Best-in-class properties (Top 10%) command rates of $279+ per night, often due to premium features or locations.
- Strong performing properties (Top 25%) achieve nightly rates of $210 or more.
- Typical properties (Median) charge around $151 per night.
- Entry-level properties (Bottom 25%) earn around $64 per night.
Average Daily Rate (ADR) Trend by Month in Panthersville
Get Live Panthersville Market Intelligence 👇
Explore Real-time Analytics
Airbnb Seasonality Analysis & Trends in Panthersville (2026)
Peak Season (December, July, October)
- Revenue averages $2,874 per month
- Occupancy rates average 44.3%
- Daily rates average $174
Shoulder Season
- Revenue averages $2,448 per month
- Occupancy maintains around 44.4%
- Daily rates hold near $158
Low Season (January, February, April)
- Revenue drops to average $1,598 per month
- Occupancy decreases to average 36.2%
- Daily rates adjust to average $150
Seasonality Insights for Panthersville
- The Airbnb seasonality in Panthersville shows moderate seasonality with distinct peak and low periods. While the sections above show seasonal averages, it's also insightful to look at the extremes:
- During the high season, the absolute peak month showcases Panthersville's highest earning potential, with monthly revenues capable of climbing to $3,080, occupancy reaching a high of 47.7%, and ADRs peaking at $186.
- Conversely, the slowest single month of the year, typically falling within the low season, marks the market's lowest point. In this month, revenue might dip to $1,469, occupancy could drop to 27.4%, and ADRs may adjust down to $136.
- Understanding both the seasonal averages and these monthly peaks and troughs in revenue, occupancy, and ADR is crucial for maximizing your Airbnb profit potential in Panthersville.
Seasonal Strategies for Maximizing Profit
- Peak Season: Maximize revenue through premium pricing and potentially longer minimum stays. Ensure high availability.
- Low Season: Offer competitive pricing, special promotions (e.g., extended stay discounts), and flexible cancellation policies. Target off-season travelers like remote workers or budget-conscious guests.
- Shoulder Seasons: Implement dynamic pricing that balances peak and low rates. Target weekend travelers or specific events. Offer slightly more flexible terms than peak season.
- Regularly analyze your own performance against these Panthersville seasonality benchmarks and adjust your pricing and availability strategy accordingly.
Best Areas for Airbnb Investment in Panthersville (2026)
Exploring the top neighborhoods for short-term rentals in Panthersville? This section highlights key areas, outlining why they are attractive for hosts and guests, along with notable local attractions. Consider these locations based on your target guest profile and investment strategy.
| Neighborhood / Area | Why Host Here? (Target Guests & Appeal) | Key Attractions & Landmarks |
|---|---|---|
| Panthersville | A burgeoning area close to Atlanta, perfect for those looking for a quiet suburban feel while still having access to city amenities. Attracts families, business travelers, and visitors to the metro Atlanta area. | Panther Creek Park, Panthersville Lake, Nearby Atlanta Botanical Garden, Georgia State Stadium, East Lake Golf Club, Stone Mountain Park |
| Decatur | A vibrant and highly walkable city just a short drive from Panthersville, known for its excellent dining, arts scene, and community events. Popular with young professionals and families. | Decatur Square, DeKalb History Center, Fernbank Museum of Natural History, Mary's Bar, Druid Hills Golf Club |
| East Atlanta Village | An eclectic neighborhood with a mix of hip bars, music venues, and a diverse community. Attracts younger crowds looking for nightlife and arts. | The Earl (music venue), East Atlanta Farmer's Market, The Village Theater, Local shops and restaurants, The Highlander |
| Lithonia | A suburb with beautiful parks and access to Stone Mountain, appealing to those looking for outdoor activities and family-friendly amenities. | Stone Mountain Park, Arabia Mountain, Panola Mountain State Park, Lithonia Marketplace |
| West End | A historic neighborhood that has seen revitalization, offering a mix of traditional architecture, culture, and access to public transport, attracting visitors interested in local history and culture. | West End Atlanta, Atlanta BeltLine, Local breweries and eateries, Historic West End |
| College Park | A community near Hartsfield-Jackson Atlanta International Airport, making it ideal for travelers. Offers affordable accommodation and local culture experiences. | College Park Golf Course, Red Oak Park, Nearby Camp Creek Marketplace, Hartsfield Airport |
| Grant Park | A family-friendly neighborhood known for its large park and historic homes. Great for families and those wanting to enjoy nature and events. | Grant Park, Zoo Atlanta, Historic Oakland Cemetery, Farmers Market |
| Kirkwood | A charming neighborhood with a strong community feel, offering a mix of residential homes and local businesses. Attractive for visitors wanting a local experience. | Kirkwood Park, Local shops and eateries, Kirkwood Business District, Nearby Nature Trail |
Understanding Airbnb License Requirements & STR Laws in Panthersville (2026)
While Panthersville, Georgia, United States currently shows low STR regulations, specific Airbnb license requirements might still exist or change. Always verify the latest short term rental regulations and Airbnb license requirements directly with local government authorities for Panthersville to ensure full compliance before hosting.
(Source: AirROI data, 2026, finding no licensed listings among those analyzed)
Top Performing Airbnb Properties in Panthersville (2026)
Benchmark your potential! Explore examples of top-performing Airbnb properties in Panthersvillebased on Trailing Twelve Month (TTM) revenue. Analyze their characteristics, revenue, occupancy rate, and ADR to understand what drives success in this market.
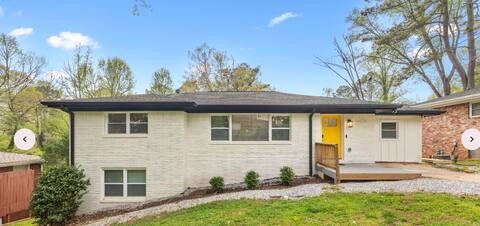
The Suite Escape -Modern Living in Metro Atlanta
Entire Place • 5 bedrooms

Cozy Decatur Home with Indoor Fireplace & Firepit
Entire Place • 3 bedrooms

East Lake Luxury: Stylish & Modern Near Everything
Entire Place • 4 bedrooms

Modern Luxury w/ Pool Table 3BR|5BD Sleeps 10
Entire Place • 3 bedrooms

Perfect Family-friendly ATL Home | Lakeview Haven
Entire Place • 3 bedrooms

The Suite Escape; Luxe- Cozy Living in Metro Atl
Entire Place • 3 bedrooms
Note: Performance varies based on location, size, amenities, seasonality, and management quality. Data reflects the past 12 months.
Top Performing Airbnb Hosts in Panthersville (2026)
Learn from the best! This table showcases top-performing Airbnb hosts in Panthersville based on the number of properties managed and estimated total revenue over the past year. Analyze their scale and performance metrics.
| Host Name | Properties | Grossing Revenue | Stay Reviews | Avg Rating |
|---|---|---|---|---|
| Jazmin | 3 | $180,428 | 131 | 4.88/5.0 |
| Wilfredo-Alessandra | 1 | $81,754 | 56 | 4.93/5.0 |
| Kanayo | 3 | $78,794 | 94 | 4.73/5.0 |
| Ni | 2 | $64,378 | 28 | 4.53/5.0 |
| David | 1 | $58,515 | 113 | 4.84/5.0 |
| David | 1 | $56,948 | 206 | 4.88/5.0 |
| Samuel And Sherly | 1 | $55,580 | 57 | 4.88/5.0 |
| Destorian | 2 | $51,866 | 128 | 4.77/5.0 |
| Prince | 1 | $47,655 | 164 | 4.60/5.0 |
| Ruben And Celine | 1 | $47,013 | 13 | 4.54/5.0 |
Analyzing the strategies of top hosts, such as their property selection, pricing, and guest communication, can offer valuable lessons for optimizing your own Airbnb operations in Panthersville.
Dive Deeper: Advanced Panthersville STR Market Data (2026)
Ready to unlock more insights? AirROI provides access to advanced metrics and comprehensive Airbnb data for Panthersville. Explore detailed analytics beyond this report to refine your investment strategy, optimize pricing, and maximize your vacation rental profits.
Explore Advanced MetricsPanthersville Short-Term Rental Market Composition (2026): Property & Room Types
Room Type Distribution
Property Type Distribution
Market Composition Insights for Panthersville
- The Panthersville Airbnb market composition is heavily skewed towards Entire Home/Apt listings, which make up 83.3% of the 72 active rentals. This indicates strong guest preference for privacy and space.
- Looking at the property type distribution in Panthersville, House properties are the most common (86.1%), reflecting the local real estate landscape.
- Houses represent a significant 86.1% portion, catering likely to families or larger groups.
- Smaller segments like hotel/boutique (combined 2.8%) offer potential for unique stay experiences.
Panthersville Airbnb Room Capacity Analysis (2026): Bedroom Distribution
Distribution of Listings by Number of Bedrooms
Room Capacity Insights for Panthersville
- The dominant room capacity in Panthersville is 3 bedrooms listings, making up 36.1% of the market. This suggests a strong demand for properties suitable for families or small groups.
- Together, 3 bedrooms and 2 bedrooms properties represent 50.0% of the active Airbnb listings in Panthersville, indicating a high concentration in these sizes.
- A significant 58.3% of listings offer 3+ bedrooms, catering to larger groups and families seeking more space in Panthersville.
Panthersville Vacation Rental Guest Capacity Trends (2026)
Distribution of Listings by Guest Capacity
Guest Capacity Insights for Panthersville
- The most common guest capacity trend in Panthersville vacation rentals is listings accommodating 8+ guests (29.2%). This suggests the primary traveler segment is likely larger groups.
- Properties designed for 8+ guests and 6 guests dominate the Panthersville STR market, accounting for 50.0% of listings.
- 59.7% of properties accommodate 6+ guests, serving the market segment for larger families or group travel in Panthersville.
- On average, properties in Panthersville are equipped to host 5.1 guests.
Panthersville Airbnb Booking Patterns (2026): Available vs. Booked Days
Available Days Distribution
Booked Days Distribution
Booking Pattern Insights for Panthersville
- The most common availability pattern in Panthersville falls within the 271-366 days range, representing 47.2% of listings. This suggests many properties have significant open periods on their calendars.
- Approximately 75.0% of listings show high availability (181+ days open annually), indicating potential for increased bookings or specific owner usage patterns.
- For booked days, the 91-180 days range is most frequent in Panthersville (27.8%), reflecting common guest stay durations or potential owner blocking patterns.
- A notable 25.0% of properties secure long booking periods (181+ days booked per year), highlighting successful long-term rental strategies or significant owner usage.
Panthersville Airbnb Minimum Stay Requirements Analysis
Distribution of Listings by Minimum Night Requirement
1 Night
28 listings
38.9% of total
2 Nights
22 listings
30.6% of total
3 Nights
5 listings
6.9% of total
4-6 Nights
3 listings
4.2% of total
7-29 Nights
2 listings
2.8% of total
30+ Nights
12 listings
16.7% of total
Key Insights
- The most prevalent minimum stay requirement in Panthersville is 1 Night, adopted by 38.9% of listings. This highlights the market's preference for shorter, flexible bookings.
- A strong majority (69.5%) of the Panthersville Airbnb data shows acceptance of very short stays (1-2 nights), indicating a dynamic, high-turnover market.
- A significant segment (16.7%) caters to monthly stays (30+ nights) in Panthersville, pointing to opportunities in the extended-stay market.
Recommendations
- Align with the market by considering a 1 Night minimum stay, as 38.9% of Panthersville hosts use this setting.
- Explore offering discounts for stays of 30+ nights to attract the 16.7% of the market seeking extended stays.
- Adjust minimum nights based on seasonality – potentially shorter during low season and longer during peak demand periods in Panthersville.
Panthersville Airbnb Cancellation Policy Trends Analysis (2026)
Flexible
28 listings
38.9% of total
Moderate
16 listings
22.2% of total
Firm
19 listings
26.4% of total
Strict
9 listings
12.5% of total
Cancellation Policy Insights for Panthersville
- The prevailing Airbnb cancellation policy trend in Panthersville is Flexible, used by 38.9% of listings.
- There's a relatively balanced mix between guest-friendly (61.1%) and stricter (38.9%) policies, offering choices for different guest needs.
Recommendations for Hosts
- Consider adopting a Flexible policy to align with the 38.9% market standard in Panthersville.
- Using a Strict policy might deter some guests, as only 12.5% of listings use it. Evaluate if potential revenue protection outweighs possible lower booking rates.
- Regularly review your cancellation policy against competitors and market demand shifts in Panthersville.
Panthersville STR Booking Lead Time Analysis (2026)
Average Booking Lead Time by Month
Booking Lead Time Insights for Panthersville
- The overall average booking lead time for vacation rentals in Panthersville is 22 days.
- Guests book furthest in advance for stays during July (average 36 days), likely coinciding with peak travel demand or local events.
- The shortest booking windows occur for stays in January (average 9 days), indicating more last-minute travel plans during this time.
- Seasonally, Fall (31 days avg.) sees the longest lead times, while Winter (16 days avg.) has the shortest, reflecting typical travel planning cycles.
Recommendations for Hosts
- Use the overall average lead time (22 days) as a baseline for your pricing and availability strategy in Panthersville.
- For July stays, consider implementing length-of-stay discounts or slightly higher rates for bookings made less than 36 days out to capitalize on advance planning.
- During January, focus on last-minute booking availability and promotions, as guests book with very short notice (9 days avg.).
- Target marketing efforts for the Fall season well in advance (at least 31 days) to capture early planners.
- Monitor your own booking lead times against these Panthersville averages to identify opportunities for dynamic pricing adjustments.
Popular & Essential Airbnb Amenities in Panthersville (2026)
Amenity Prevalence
Amenity Insights for Panthersville
- Essential amenities in Panthersville that guests expect include: Air conditioning, Wifi, Smoke alarm, TV, Kitchen, Free parking on premises. Lacking these (any) could significantly impact bookings.
- Popular amenities like Heating, Hot water, Dishes and silverware are common but not universal. Offering these can provide a competitive edge.
Recommendations for Hosts
- Ensure your listing includes all essential amenities for Panthersville: Air conditioning, Wifi, Smoke alarm, TV, Kitchen, Free parking on premises.
- Prioritize adding missing essentials: Air conditioning, Wifi, Smoke alarm, TV, Kitchen, Free parking on premises.
- Consider adding popular differentiators like Heating or Hot water to increase appeal.
- Highlight unique or less common amenities you offer (e.g., hot tub, dedicated workspace, EV charger) in your listing description and photos.
- Regularly check competitor amenities in Panthersville to stay competitive.
Panthersville Airbnb Guest Demographics & Profile Analysis (2026)
Guest Profile Summary for Panthersville
- The typical guest profile for Airbnb in Panthersville consists of primarily domestic travelers (97%), often arriving from nearby Atlanta, typically belonging to the Post-2000s (Gen Z/Alpha) group (50%), primarily speaking English or Spanish.
- Domestic travelers account for 96.7% of guests.
- Key international markets include United States (96.7%) and DC (0.6%).
- Top languages spoken are English (79.4%) followed by Spanish (13.9%).
- A significant demographic segment is the Post-2000s (Gen Z/Alpha) group, representing 50% of guests.
Recommendations for Hosts
- Target domestic marketing efforts towards travelers from Atlanta and New York.
- Tailor amenities and listing descriptions to appeal to the dominant Post-2000s (Gen Z/Alpha) demographic (e.g., highlight fast WiFi, smart home features, local guides).
- Highlight unique local experiences or amenities relevant to the primary guest profile.
- Consider seasonal promotions aligned with peak travel times for key origin markets.
Nearby Short-Term Rental Market Comparison
How does the Panthersville Airbnb market stack up against its neighbors? Compare key performance metrics like average monthly revenue, ADR, and occupancy rates in surrounding areas to understand the broader regional STR landscape.
| Market | Active Properties | Monthly Revenue | Daily Rate | Avg. Occupancy |
|---|---|---|---|---|
| Bogart | 13 | $5,528 | $637.81 | 35% |
| Gilmer County | 26 | $5,298 | $459.59 | 40% |
| Fannin County | 42 | $4,574 | $435.93 | 38% |
| East Ellijay | 15 | $4,415 | $368.05 | 41% |
| Epworth | 79 | $4,411 | $406.97 | 40% |
| Commerce | 19 | $4,298 | $285.34 | 45% |
| Jacksons' Gap | 45 | $4,249 | $467.96 | 37% |
| Eatonton | 236 | $4,178 | $502.80 | 33% |
| Sautee | 14 | $4,105 | $408.17 | 39% |
| Waleska | 45 | $4,041 | $373.64 | 42% |