Norcross Airbnb Market Analysis 2026: Short Term Rental Data & Vacation Rental Statistics in Georgia, United States
Is Airbnb profitable in Norcross in 2026? Explore comprehensive Airbnb analytics for Norcross, Georgia, United States to uncover income potential. This 2026 STR market report for Norcross, based on AirROI data from February 2025 to January 2026, reveals key trends in the niche market of 147 active listings.
Whether you're considering an Airbnb investment in Norcross, optimizing your existing vacation rental, or exploring rental arbitrage opportunities, understanding the Norcross Airbnb data is crucial. Leveraging the low regulation environment is key to maximizing your short term rental income potential. Let's dive into the specifics.
Key Norcross Airbnb Performance Metrics Overview
Monthly Airbnb Revenue Variations & Income Potential in Norcross (2026)
Understanding the monthly revenue variations for Airbnb listings in Norcross is key to maximizing your short term rental income potential. Seasonality significantly impacts earnings. Our analysis, based on data from the past 12 months, shows that the peak revenue month for STRs in Norcross is typically June, while January often presents the lowest earnings, highlighting opportunities for strategic pricing adjustments during shoulder and low seasons. Explore the typical Airbnb income in Norcross across different performance tiers:
- Best-in-class properties (Top 10%) achieve $5,099+ monthly, often utilizing dynamic pricing and superior guest experiences.
- Strong performing properties (Top 25%) earn $3,218 or more, indicating effective management and desirable locations/amenities.
- Typical properties (Median) generate around $1,602 per month, representing the average market performance.
- Entry-level properties (Bottom 25%) see earnings around $646, often with potential for optimization.
Average Monthly Airbnb Earnings Trend in Norcross
Norcross Airbnb Occupancy Rate Trends (2026)
Maximize your bookings by understanding the Norcross STR occupancy trends. Seasonal demand shifts significantly influence how often properties are booked. Typically, Marchsees the highest demand (peak season occupancy), while January experiences the lowest (low season). Effective strategies, like adjusting minimum stays or offering promotions, can boost occupancy during slower periods. Here's how different property tiers perform in Norcross:
- Best-in-class properties (Top 10%) achieve 79%+ occupancy, indicating high desirability and potentially optimized availability.
- Strong performing properties (Top 25%) maintain 66% or higher occupancy, suggesting good market fit and guest satisfaction.
- Typical properties (Median) have an occupancy rate around 42%.
- Entry-level properties (Bottom 25%) average 22% occupancy, potentially facing higher vacancy.
Average Monthly Occupancy Rate Trend in Norcross
Average Daily Rate (ADR) Airbnb Trends in Norcross (2026)
Effective short term rental pricing strategy in Norcross involves understanding monthly ADR fluctuations. The Average Daily Rate (ADR) for Airbnb in Norcross typically peaks in December and dips lowest during February. Leveraging Airbnb dynamic pricing tools or strategies based on this seasonality can significantly boost revenue. Here's a look at the typical nightly rates achieved:
- Best-in-class properties (Top 10%) command rates of $273+ per night, often due to premium features or locations.
- Strong performing properties (Top 25%) achieve nightly rates of $191 or more.
- Typical properties (Median) charge around $123 per night.
- Entry-level properties (Bottom 25%) earn around $54 per night.
Average Daily Rate (ADR) Trend by Month in Norcross
Get Live Norcross Market Intelligence 👇

Explore Real-time Analytics
Airbnb Seasonality Analysis & Trends in Norcross (2026)
Peak Season (June, July, May)
- Revenue averages $2,736 per month
- Occupancy rates average 48.0%
- Daily rates average $145
Shoulder Season
- Revenue averages $2,359 per month
- Occupancy maintains around 45.8%
- Daily rates hold near $147
Low Season (January, February, September)
- Revenue drops to average $1,768 per month
- Occupancy decreases to average 38.0%
- Daily rates adjust to average $145
Seasonality Insights for Norcross
- The Airbnb seasonality in Norcross shows moderate seasonality with distinct peak and low periods. While the sections above show seasonal averages, it's also insightful to look at the extremes:
- During the high season, the absolute peak month showcases Norcross's highest earning potential, with monthly revenues capable of climbing to $2,760, occupancy reaching a high of 50.0%, and ADRs peaking at $161.
- Conversely, the slowest single month of the year, typically falling within the low season, marks the market's lowest point. In this month, revenue might dip to $1,586, occupancy could drop to 31.1%, and ADRs may adjust down to $128.
- Understanding both the seasonal averages and these monthly peaks and troughs in revenue, occupancy, and ADR is crucial for maximizing your Airbnb profit potential in Norcross.
Seasonal Strategies for Maximizing Profit
- Peak Season: Maximize revenue through premium pricing and potentially longer minimum stays. Ensure high availability.
- Low Season: Offer competitive pricing, special promotions (e.g., extended stay discounts), and flexible cancellation policies. Target off-season travelers like remote workers or budget-conscious guests.
- Shoulder Seasons: Implement dynamic pricing that balances peak and low rates. Target weekend travelers or specific events. Offer slightly more flexible terms than peak season.
- Regularly analyze your own performance against these Norcross seasonality benchmarks and adjust your pricing and availability strategy accordingly.
Best Areas for Airbnb Investment in Norcross (2026)
Exploring the top neighborhoods for short-term rentals in Norcross? This section highlights key areas, outlining why they are attractive for hosts and guests, along with notable local attractions. Consider these locations based on your target guest profile and investment strategy.
| Neighborhood / Area | Why Host Here? (Target Guests & Appeal) | Key Attractions & Landmarks |
|---|---|---|
| Historic Norcross | Charming historic district with picturesque streets, local shops, and restaurants. Attracts families and tourists looking for a quaint, small-town experience near Atlanta. | Norcross Historic District, Thrasher Park, Cultural Arts and Community Center, Bennett Park, Local boutiques and dining |
| Peachtree Corners | A rapidly growing area with modern conveniences, excellent dining options, and proximity to tech companies. Ideal for business travelers and families. | The Forum on Peachtree Parkway, Pinckneyville Park, Curiosity Lab at Peachtree Corners, Local shops and dining spots |
| Duluth | Nearby suburb known for its diverse dining scenes and family-friendly attractions. Appeals to visitors seeking a quieter stay while still close to metropolitan activities. | Downtown Duluth, Duluth Town Green, George Pierce Park, Local restaurants and breweries |
| Berkeley Lake | Scenic area centered around a beautiful lake, perfect for outdoor enthusiasts. Ideal for those looking to escape the city and enjoy nature. | Berkeley Lake, Park and walking trails, Nearby golf courses, Local lakeside dining |
| Norcross City Center | The vibrant core of Norcross offers diverse shopping and dining, with a close-knit community feel, attracting visitors who want local culture. | Norcross City Hall, Local farmers market, Dining and shopping options, Family-friendly parks |
| Technology Park | Business hub with access to major corporate offices and tech companies. Great for professionals attending conferences or business events. | Local office parks, Corporate dining options, Easy access to major highways |
| Jones Bridge Park | Popular recreation area with walking trails and family facilities, attracting nature lovers and families for weekend getaways. | Jones Bridge Park trails, Picnic areas, Nature activities |
| Five Forks | Residential neighborhood that offers a mix of local charm and convenience, suitable for families and travelers looking for local experiences. | Local dining, Parks and playgrounds, Community events |
Understanding Airbnb License Requirements & STR Laws in Norcross (2026)
While Norcross, Georgia, United States currently shows low STR regulations, specific Airbnb license requirements might still exist or change. Always verify the latest short term rental regulations and Airbnb license requirements directly with local government authorities for Norcross to ensure full compliance before hosting.
(Source: AirROI data, 2026, finding no licensed listings among those analyzed)
Top Performing Airbnb Properties in Norcross (2026)
Benchmark your potential! Explore examples of top-performing Airbnb properties in Norcrossbased on Trailing Twelve Month (TTM) revenue. Analyze their characteristics, revenue, occupancy rate, and ADR to understand what drives success in this market.
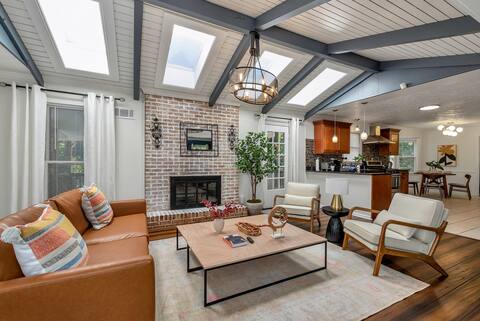
ALL Kings!/ Gameroom/ Huge Deck/ Family Friendly
Entire Place • 6 bedrooms

Family Home/Near ATL/5beds/3baths/Sleep12
Entire Place • 4 bedrooms
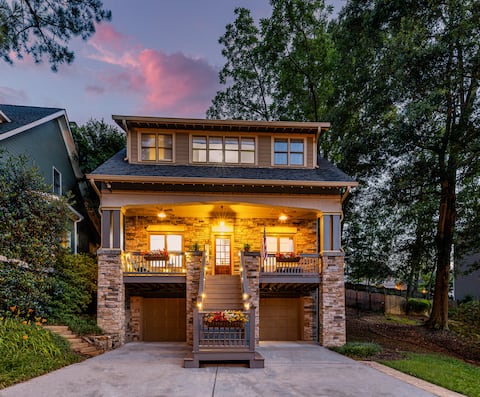
Luxury~Spacious Home in Downtown Historic Norcoss
Entire Place • 6 bedrooms
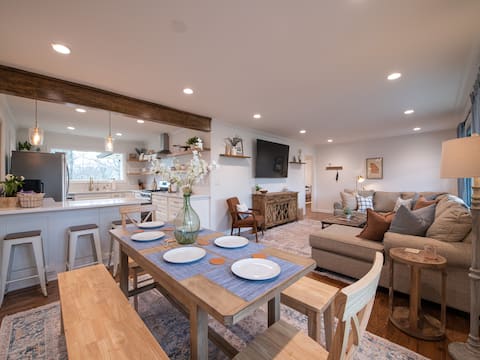
Crossing House · Boutique, Chef Kitchen, Downtown
Entire Place • 3 bedrooms

Historic Gem in the Heart of Norcross
Entire Place • 5 bedrooms
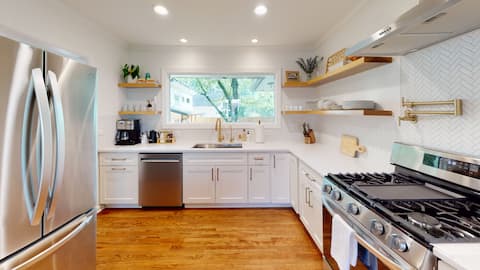
House, Cottage, Tiny Home in Downtown Norcross
Entire Place • 6 bedrooms
Note: Performance varies based on location, size, amenities, seasonality, and management quality. Data reflects the past 12 months.
Top Performing Airbnb Hosts in Norcross (2026)
Learn from the best! This table showcases top-performing Airbnb hosts in Norcross based on the number of properties managed and estimated total revenue over the past year. Analyze their scale and performance metrics.
| Host Name | Properties | Grossing Revenue | Stay Reviews | Avg Rating |
|---|---|---|---|---|
| Daniel And Catherine | 4 | $269,317 | 222 | 4.97/5.0 |
| Mountain Sights Rentals | 6 | $255,437 | 249 | 4.76/5.0 |
| Duy & Evelynn | 2 | $221,335 | 302 | 4.83/5.0 |
| Daniela | 3 | $112,873 | 142 | 4.87/5.0 |
| Lac | 1 | $94,954 | 73 | 4.79/5.0 |
| Homi Spaces | 2 | $94,816 | 234 | 4.88/5.0 |
| Lulu | 5 | $73,322 | 373 | 4.42/5.0 |
| Suite Stays Atlanta | 2 | $72,058 | 110 | 4.83/5.0 |
| Felipe | 4 | $67,060 | 104 | 4.84/5.0 |
| Victor | 4 | $65,969 | 91 | 4.96/5.0 |
Analyzing the strategies of top hosts, such as their property selection, pricing, and guest communication, can offer valuable lessons for optimizing your own Airbnb operations in Norcross.
Dive Deeper: Advanced Norcross STR Market Data (2026)
Ready to unlock more insights? AirROI provides access to advanced metrics and comprehensive Airbnb data for Norcross. Explore detailed analytics beyond this report to refine your investment strategy, optimize pricing, and maximize your vacation rental profits.
Explore Advanced MetricsNorcross Short-Term Rental Market Composition (2026): Property & Room Types
Room Type Distribution
Property Type Distribution
Market Composition Insights for Norcross
- The Norcross Airbnb market composition is heavily skewed towards Entire Home/Apt listings, which make up 69.4% of the 147 active rentals. This indicates strong guest preference for privacy and space.
- However, a notable 30.6% share for Private Rooms suggests opportunities for budget-conscious travelers or hosts renting out spare rooms.
- Looking at the property type distribution in Norcross, House properties are the most common (78.2%), reflecting the local real estate landscape.
- Houses represent a significant 78.2% portion, catering likely to families or larger groups.
- The presence of 6.1% Hotel/Boutique listings indicates integration with traditional hospitality.
- Smaller segments like others, unique stays (combined 2.7%) offer potential for unique stay experiences.
Norcross Airbnb Room Capacity Analysis (2026): Bedroom Distribution
Distribution of Listings by Number of Bedrooms
Room Capacity Insights for Norcross
- The dominant room capacity in Norcross is 3 bedrooms listings, making up 22.4% of the market. This suggests a strong demand for properties suitable for families or small groups.
- Together, 3 bedrooms and 1 bedroom properties represent 44.8% of the active Airbnb listings in Norcross, indicating a high concentration in these sizes.
- A significant 37.4% of listings offer 3+ bedrooms, catering to larger groups and families seeking more space in Norcross.
Norcross Vacation Rental Guest Capacity Trends (2026)
Distribution of Listings by Guest Capacity
Guest Capacity Insights for Norcross
- The most common guest capacity trend in Norcross vacation rentals is listings accommodating 8+ guests (23.1%). This suggests the primary traveler segment is likely larger groups.
- Properties designed for 8+ guests and 4 guests dominate the Norcross STR market, accounting for 39.4% of listings.
- 40.8% of properties accommodate 6+ guests, serving the market segment for larger families or group travel in Norcross.
- On average, properties in Norcross are equipped to host 4.1 guests.
Norcross Airbnb Booking Patterns (2026): Available vs. Booked Days
Available Days Distribution
Booked Days Distribution
Booking Pattern Insights for Norcross
- The most common availability pattern in Norcross falls within the 271-366 days range, representing 48.3% of listings. This suggests many properties have significant open periods on their calendars.
- Approximately 81.6% of listings show high availability (181+ days open annually), indicating potential for increased bookings or specific owner usage patterns.
- For booked days, the 91-180 days range is most frequent in Norcross (34.7%), reflecting common guest stay durations or potential owner blocking patterns.
- A notable 19.7% of properties secure long booking periods (181+ days booked per year), highlighting successful long-term rental strategies or significant owner usage.
Norcross Airbnb Minimum Stay Requirements Analysis
Distribution of Listings by Minimum Night Requirement
1 Night
43 listings
29.3% of total
2 Nights
42 listings
28.6% of total
3 Nights
10 listings
6.8% of total
4-6 Nights
5 listings
3.4% of total
7-29 Nights
11 listings
7.5% of total
30+ Nights
36 listings
24.5% of total
Key Insights
- The most prevalent minimum stay requirement in Norcross is 1 Night, adopted by 29.3% of listings. This highlights the market's preference for shorter, flexible bookings.
- A significant segment (24.5%) caters to monthly stays (30+ nights) in Norcross, pointing to opportunities in the extended-stay market.
Recommendations
- Align with the market by considering a 1 Night minimum stay, as 29.3% of Norcross hosts use this setting.
- If feasible, allowing 1-night stays, especially midweek or during low season, could capture last-minute bookings, as only 29.3% currently do.
- Explore offering discounts for stays of 30+ nights to attract the 24.5% of the market seeking extended stays.
- Adjust minimum nights based on seasonality – potentially shorter during low season and longer during peak demand periods in Norcross.
Norcross Airbnb Cancellation Policy Trends Analysis (2026)
Limited
3 listings
2% of total
Flexible
47 listings
32% of total
Moderate
39 listings
26.5% of total
Firm
34 listings
23.1% of total
Strict
24 listings
16.3% of total
Cancellation Policy Insights for Norcross
- The prevailing Airbnb cancellation policy trend in Norcross is Flexible, used by 32% of listings.
- There's a relatively balanced mix between guest-friendly (58.5%) and stricter (39.4%) policies, offering choices for different guest needs.
Recommendations for Hosts
- Consider adopting a Flexible policy to align with the 32% market standard in Norcross.
- Regularly review your cancellation policy against competitors and market demand shifts in Norcross.
Norcross STR Booking Lead Time Analysis (2026)
Average Booking Lead Time by Month
Booking Lead Time Insights for Norcross
- The overall average booking lead time for vacation rentals in Norcross is 21 days.
- Guests book furthest in advance for stays during November (average 29 days), likely coinciding with peak travel demand or local events.
- The shortest booking windows occur for stays in January (average 13 days), indicating more last-minute travel plans during this time.
- Seasonally, Fall (26 days avg.) sees the longest lead times, while Winter (17 days avg.) has the shortest, reflecting typical travel planning cycles.
Recommendations for Hosts
- Use the overall average lead time (21 days) as a baseline for your pricing and availability strategy in Norcross.
- During January, focus on last-minute booking availability and promotions, as guests book with very short notice (13 days avg.).
- Target marketing efforts for the Fall season well in advance (at least 26 days) to capture early planners.
- Monitor your own booking lead times against these Norcross averages to identify opportunities for dynamic pricing adjustments.
Popular & Essential Airbnb Amenities in Norcross (2026)
Amenity Prevalence
Amenity Insights for Norcross
- Essential amenities in Norcross that guests expect include: Wifi, Air conditioning. Lacking these (any) could significantly impact bookings.
- Popular amenities like Free parking on premises, Smoke alarm, Heating are common but not universal. Offering these can provide a competitive edge.
Recommendations for Hosts
- Ensure your listing includes all essential amenities for Norcross: Wifi, Air conditioning.
- Prioritize adding missing essentials: Wifi, Air conditioning.
- Consider adding popular differentiators like Free parking on premises or Smoke alarm to increase appeal.
- Highlight unique or less common amenities you offer (e.g., hot tub, dedicated workspace, EV charger) in your listing description and photos.
- Regularly check competitor amenities in Norcross to stay competitive.
Norcross Airbnb Guest Demographics & Profile Analysis (2026)
Guest Profile Summary for Norcross
- The typical guest profile for Airbnb in Norcross consists of primarily domestic travelers (94%), often arriving from nearby Atlanta, typically belonging to the Post-2000s (Gen Z/Alpha) group (50%), primarily speaking English or Spanish.
- Domestic travelers account for 94.1% of guests.
- Key international markets include United States (94.1%) and Mexico (1.1%).
- Top languages spoken are English (66.9%) followed by Spanish (16.3%).
- A significant demographic segment is the Post-2000s (Gen Z/Alpha) group, representing 50% of guests.
Recommendations for Hosts
- Target domestic marketing efforts towards travelers from Atlanta and Charlotte.
- Tailor amenities and listing descriptions to appeal to the dominant Post-2000s (Gen Z/Alpha) demographic (e.g., highlight fast WiFi, smart home features, local guides).
- Highlight unique local experiences or amenities relevant to the primary guest profile.
- Consider seasonal promotions aligned with peak travel times for key origin markets.
Nearby Short-Term Rental Market Comparison
How does the Norcross Airbnb market stack up against its neighbors? Compare key performance metrics like average monthly revenue, ADR, and occupancy rates in surrounding areas to understand the broader regional STR landscape.
| Market | Active Properties | Monthly Revenue | Daily Rate | Avg. Occupancy |
|---|---|---|---|---|
| Bogart | 13 | $5,528 | $637.81 | 35% |
| Gilmer County | 26 | $5,298 | $459.59 | 40% |
| Fannin County | 42 | $4,574 | $435.93 | 38% |
| East Ellijay | 15 | $4,415 | $368.05 | 41% |
| Epworth | 79 | $4,411 | $406.97 | 40% |
| Commerce | 19 | $4,298 | $285.34 | 45% |
| Jacksons' Gap | 45 | $4,249 | $467.96 | 37% |
| Eatonton | 236 | $4,178 | $502.80 | 33% |
| Sautee | 14 | $4,105 | $408.17 | 39% |
| Waleska | 45 | $4,041 | $373.64 | 42% |