Morganton Airbnb Market Analysis 2026: Short Term Rental Data & Vacation Rental Statistics in Georgia, United States
Is Airbnb profitable in Morganton in 2026? Explore comprehensive Airbnb analytics for Morganton, Georgia, United States to uncover income potential. This 2026 STR market report for Morganton, based on AirROI data from February 2025 to January 2026, reveals key trends in the market of 385 active listings.
Whether you're considering an Airbnb investment in Morganton, optimizing your existing vacation rental, or exploring rental arbitrage opportunities, understanding the Morganton Airbnb data is crucial. Leveraging the low regulation environment is key to maximizing your short term rental income potential. Let's dive into the specifics.
Key Morganton Airbnb Performance Metrics Overview
Monthly Airbnb Revenue Variations & Income Potential in Morganton (2026)
Understanding the monthly revenue variations for Airbnb listings in Morganton is key to maximizing your short term rental income potential. Seasonality significantly impacts earnings. Our analysis, based on data from the past 12 months, shows that the peak revenue month for STRs in Morganton is typically October, while February often presents the lowest earnings, highlighting opportunities for strategic pricing adjustments during shoulder and low seasons. Explore the typical Airbnb income in Morganton across different performance tiers:
- Best-in-class properties (Top 10%) achieve $8,014+ monthly, often utilizing dynamic pricing and superior guest experiences.
- Strong performing properties (Top 25%) earn $5,342 or more, indicating effective management and desirable locations/amenities.
- Typical properties (Median) generate around $3,171 per month, representing the average market performance.
- Entry-level properties (Bottom 25%) see earnings around $1,683, often with potential for optimization.
Average Monthly Airbnb Earnings Trend in Morganton
Morganton Airbnb Occupancy Rate Trends (2026)
Maximize your bookings by understanding the Morganton STR occupancy trends. Seasonal demand shifts significantly influence how often properties are booked. Typically, Octobersees the highest demand (peak season occupancy), while January experiences the lowest (low season). Effective strategies, like adjusting minimum stays or offering promotions, can boost occupancy during slower periods. Here's how different property tiers perform in Morganton:
- Best-in-class properties (Top 10%) achieve 73%+ occupancy, indicating high desirability and potentially optimized availability.
- Strong performing properties (Top 25%) maintain 56% or higher occupancy, suggesting good market fit and guest satisfaction.
- Typical properties (Median) have an occupancy rate around 34%.
- Entry-level properties (Bottom 25%) average 19% occupancy, potentially facing higher vacancy.
Average Monthly Occupancy Rate Trend in Morganton
Average Daily Rate (ADR) Airbnb Trends in Morganton (2026)
Effective short term rental pricing strategy in Morganton involves understanding monthly ADR fluctuations. The Average Daily Rate (ADR) for Airbnb in Morganton typically peaks in December and dips lowest during February. Leveraging Airbnb dynamic pricing tools or strategies based on this seasonality can significantly boost revenue. Here's a look at the typical nightly rates achieved:
- Best-in-class properties (Top 10%) command rates of $501+ per night, often due to premium features or locations.
- Strong performing properties (Top 25%) achieve nightly rates of $380 or more.
- Typical properties (Median) charge around $284 per night.
- Entry-level properties (Bottom 25%) earn around $206 per night.
Average Daily Rate (ADR) Trend by Month in Morganton
Get Live Morganton Market Intelligence 👇

Explore Real-time Analytics
Airbnb Seasonality Analysis & Trends in Morganton (2026)
Peak Season (October, December, November)
- Revenue averages $5,746 per month
- Occupancy rates average 47.0%
- Daily rates average $382
Shoulder Season
- Revenue averages $4,167 per month
- Occupancy maintains around 37.7%
- Daily rates hold near $322
Low Season (January, February, April)
- Revenue drops to average $2,844 per month
- Occupancy decreases to average 32.4%
- Daily rates adjust to average $304
Seasonality Insights for Morganton
- The Airbnb seasonality in Morganton shows highly seasonal trends requiring careful strategy. While the sections above show seasonal averages, it's also insightful to look at the extremes:
- During the high season, the absolute peak month showcases Morganton's highest earning potential, with monthly revenues capable of climbing to $5,898, occupancy reaching a high of 49.7%, and ADRs peaking at $390.
- Conversely, the slowest single month of the year, typically falling within the low season, marks the market's lowest point. In this month, revenue might dip to $2,644, occupancy could drop to 27.3%, and ADRs may adjust down to $282.
- Understanding both the seasonal averages and these monthly peaks and troughs in revenue, occupancy, and ADR is crucial for maximizing your Airbnb profit potential in Morganton.
Seasonal Strategies for Maximizing Profit
- Peak Season: Maximize revenue through premium pricing and potentially longer minimum stays. Ensure high availability.
- Low Season: Offer competitive pricing, special promotions (e.g., extended stay discounts), and flexible cancellation policies. Target off-season travelers like remote workers or budget-conscious guests.
- Shoulder Seasons: Implement dynamic pricing that balances peak and low rates. Target weekend travelers or specific events. Offer slightly more flexible terms than peak season.
- Regularly analyze your own performance against these Morganton seasonality benchmarks and adjust your pricing and availability strategy accordingly.
Best Areas for Airbnb Investment in Morganton (2026)
Exploring the top neighborhoods for short-term rentals in Morganton? This section highlights key areas, outlining why they are attractive for hosts and guests, along with notable local attractions. Consider these locations based on your target guest profile and investment strategy.
| Neighborhood / Area | Why Host Here? (Target Guests & Appeal) | Key Attractions & Landmarks |
|---|---|---|
| Blue Ridge Lake | A stunning natural area known for its crystal clear waters and outdoor activities such as fishing, boating, and hiking. Ideal for vacationers looking for a serene getaway surrounded by nature. | Blue Ridge Lake, Morganton Point Recreation Area, Lake Blue Ridge Dam, Toccoa River, Hiking Trails |
| Downtown Morganton | The charming downtown area offers local shops, restaurants, and a warm community vibe. Perfect for visitors wanting to experience the local culture and community events. | Morganton Festival, Local Farmers Market, Shops and Boutiques, Morganton Community Center |
| Chattahoochee National Forest | This expansive forest provides guests with an abundance of hiking, camping, and other outdoor adventures. Great for nature lovers and those seeking tranquility. | Hiking Trails, Waterfalls, Camping Sites, Wildlife Viewing |
| Aska Adventure Area | Known for its scenic drives and outdoor activities, this area is popular among adventure seekers and families looking for fun in nature. | Aska Trails, Blue Ridge Scenic Railway, Toccoa River, Fishing and Kayaking Spots |
| Mineral Bluff | A picturesque town near Morganton, offering a peaceful escape with great views and proximity to both Blue Ridge and the national forest. | Scenic Views, Quiet Atmosphere, Close to Blue Ridge |
| Lake Blue Ridge | This region offers stunning views and easy access to water activities such as kayaking and swimming. It’s perfect for summer vacations. | Kayaking, Swimming, Picnic Areas, Beach Access |
| Ellijay | A nearby town known for its apple orchards and seasonal festivals. It attracts visitors looking for a taste of local produce and rural charm. | Apple Orchards, Mountain Views, Local Craft Shops, Georgia Apple Festival |
| Copperhill | Located just over the border in Tennessee, Copperhill has its own charm with outdoor adventures and access to the Ocoee River for whitewater rafting. | Ocoee River, Outdoor Adventures, Scenic Train Rides |
Understanding Airbnb License Requirements & STR Laws in Morganton (2026)
While Morganton, Georgia, United States currently shows low STR regulations, specific Airbnb license requirements might still exist or change. Always verify the latest short term rental regulations and Airbnb license requirements directly with local government authorities for Morganton to ensure full compliance before hosting.
(Source: AirROI data, 2026, based on 0% licensed listings)
Top Performing Airbnb Properties in Morganton (2026)
Benchmark your potential! Explore examples of top-performing Airbnb properties in Morgantonbased on Trailing Twelve Month (TTM) revenue. Analyze their characteristics, revenue, occupancy rate, and ADR to understand what drives success in this market.
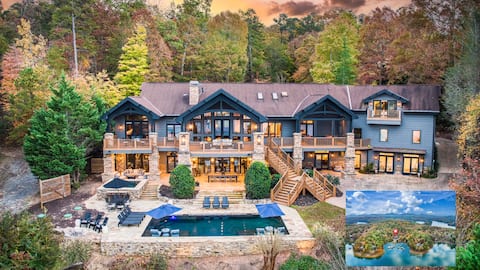
Lake Front Luxury Pool Hot tub Movie Theater Gym
Entire Place • 10 bedrooms

Lake Front Luxury Pool Hot Tub Dock Summer booking
Entire Place • 6 bedrooms

Luxe Mountain Resort - Heated Pool & 12ft Hot Tub
Entire Place • 6 bedrooms
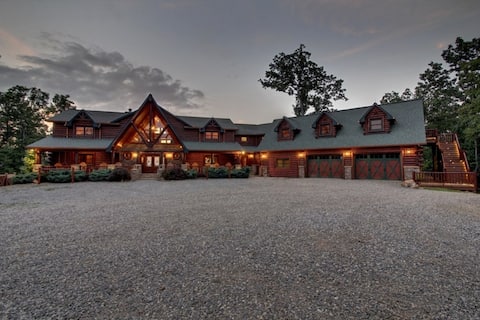
5 Star Lodge - Corp Retreats, Weddings, Families
Entire Place • 10 bedrooms

Private Mountain Resort: Sleeps 26! Views Pool Spa
Entire Place • 9 bedrooms

Mtn View•10 Min>Blue Ridge•Hot Tub•Firepit•Game Rm
Entire Place • 4 bedrooms
Note: Performance varies based on location, size, amenities, seasonality, and management quality. Data reflects the past 12 months.
Top Performing Airbnb Hosts in Morganton (2026)
Learn from the best! This table showcases top-performing Airbnb hosts in Morganton based on the number of properties managed and estimated total revenue over the past year. Analyze their scale and performance metrics.
| Host Name | Properties | Grossing Revenue | Stay Reviews | Avg Rating |
|---|---|---|---|---|
| Kristy Collection | 2 | $1,046,267 | 59 | 4.96/5.0 |
| Buffy | 42 | $923,500 | 1506 | 4.90/5.0 |
| Southern Comfort | 15 | $675,772 | 120 | 4.72/5.0 |
| Escape To Blue Ridge | 21 | $649,338 | 51 | 4.76/5.0 |
| Taylar | 7 | $430,010 | 195 | 4.92/5.0 |
| PMI North GA Mountains | 5 | $311,744 | 186 | 4.89/5.0 |
| Morning Breeze | 4 | $293,399 | 48 | 4.84/5.0 |
| Blue Sky Cabin | 6 | $275,246 | 47 | 4.87/5.0 |
| Jodi And Steve | 1 | $244,172 | 41 | 4.95/5.0 |
| Joni | 5 | $238,900 | 183 | 4.88/5.0 |
Analyzing the strategies of top hosts, such as their property selection, pricing, and guest communication, can offer valuable lessons for optimizing your own Airbnb operations in Morganton.
Dive Deeper: Advanced Morganton STR Market Data (2026)
Ready to unlock more insights? AirROI provides access to advanced metrics and comprehensive Airbnb data for Morganton. Explore detailed analytics beyond this report to refine your investment strategy, optimize pricing, and maximize your vacation rental profits.
Explore Advanced MetricsMorganton Short-Term Rental Market Composition (2026): Property & Room Types
Room Type Distribution
Property Type Distribution
Market Composition Insights for Morganton
- The Morganton Airbnb market composition is heavily skewed towards Entire Home/Apt listings, which make up 96.1% of the 385 active rentals. This indicates strong guest preference for privacy and space.
- Looking at the property type distribution in Morganton, Outdoor/Unique properties are the most common (77.7%), reflecting the local real estate landscape.
- Houses represent a significant 17.9% portion, catering likely to families or larger groups.
- Smaller segments like hotel/boutique, unique stays, others (combined 4.5%) offer potential for unique stay experiences.
Morganton Airbnb Room Capacity Analysis (2026): Bedroom Distribution
Distribution of Listings by Number of Bedrooms
Room Capacity Insights for Morganton
- The dominant room capacity in Morganton is 3 bedrooms listings, making up 38.7% of the market. This suggests a strong demand for properties suitable for families or small groups.
- Together, 3 bedrooms and 2 bedrooms properties represent 59.5% of the active Airbnb listings in Morganton, indicating a high concentration in these sizes.
- A significant 67.8% of listings offer 3+ bedrooms, catering to larger groups and families seeking more space in Morganton.
Morganton Vacation Rental Guest Capacity Trends (2026)
Distribution of Listings by Guest Capacity
Guest Capacity Insights for Morganton
- The most common guest capacity trend in Morganton vacation rentals is listings accommodating 8+ guests (49.4%). This suggests the primary traveler segment is likely larger groups.
- Properties designed for 8+ guests and 6 guests dominate the Morganton STR market, accounting for 73.6% of listings.
- 77.0% of properties accommodate 6+ guests, serving the market segment for larger families or group travel in Morganton.
- On average, properties in Morganton are equipped to host 6.4 guests.
Morganton Airbnb Booking Patterns (2026): Available vs. Booked Days
Available Days Distribution
Booked Days Distribution
Booking Pattern Insights for Morganton
- The most common availability pattern in Morganton falls within the 271-366 days range, representing 46.8% of listings. This suggests many properties have significant open periods on their calendars.
- Approximately 82.1% of listings show high availability (181+ days open annually), indicating potential for increased bookings or specific owner usage patterns.
- For booked days, the 91-180 days range is most frequent in Morganton (35.3%), reflecting common guest stay durations or potential owner blocking patterns.
- A notable 19.5% of properties secure long booking periods (181+ days booked per year), highlighting successful long-term rental strategies or significant owner usage.
Morganton Airbnb Minimum Stay Requirements Analysis
Distribution of Listings by Minimum Night Requirement
1 Night
37 listings
9.6% of total
2 Nights
161 listings
41.8% of total
3 Nights
23 listings
6% of total
4-6 Nights
1 listings
0.3% of total
30+ Nights
163 listings
42.3% of total
Key Insights
- The most prevalent minimum stay requirement in Morganton is 30+ Nights, adopted by 42.3% of listings. This highlights the market's preference for longer commitments.
- A significant segment (42.3%) caters to monthly stays (30+ nights) in Morganton, pointing to opportunities in the extended-stay market.
Recommendations
- Align with the market by considering a 30+ Nights minimum stay, as 42.3% of Morganton hosts use this setting.
- If feasible, allowing 1-night stays, especially midweek or during low season, could capture last-minute bookings, as only 9.6% currently do.
- A 2-night minimum appears standard (41.8%). Consider this for weekends or peak periods.
- Explore offering discounts for stays of 30+ nights to attract the 42.3% of the market seeking extended stays.
- Adjust minimum nights based on seasonality – potentially shorter during low season and longer during peak demand periods in Morganton.
Morganton Airbnb Cancellation Policy Trends Analysis (2026)
Super Strict 30 Days
18 listings
4.7% of total
Limited
15 listings
3.9% of total
Super Strict 60 Days
10 listings
2.6% of total
Flexible
52 listings
13.5% of total
Moderate
95 listings
24.7% of total
Firm
139 listings
36.1% of total
Strict
56 listings
14.5% of total
Cancellation Policy Insights for Morganton
- The prevailing Airbnb cancellation policy trend in Morganton is Firm, used by 36.1% of listings.
- A majority (50.6%) of hosts in Morganton utilize Firm or Strict policies, indicating a market where hosts prioritize booking security.
Recommendations for Hosts
- Consider adopting a Firm policy to align with the 36.1% market standard in Morganton.
- Using a Strict policy might deter some guests, as only 14.5% of listings use it. Evaluate if potential revenue protection outweighs possible lower booking rates.
- Regularly review your cancellation policy against competitors and market demand shifts in Morganton.
Morganton STR Booking Lead Time Analysis (2026)
Average Booking Lead Time by Month
Booking Lead Time Insights for Morganton
- The overall average booking lead time for vacation rentals in Morganton is 47 days.
- Guests book furthest in advance for stays during November (average 77 days), likely coinciding with peak travel demand or local events.
- The shortest booking windows occur for stays in February (average 33 days), indicating more last-minute travel plans during this time.
- Seasonally, Fall (60 days avg.) sees the longest lead times, while Spring (39 days avg.) has the shortest, reflecting typical travel planning cycles.
Recommendations for Hosts
- Use the overall average lead time (47 days) as a baseline for your pricing and availability strategy in Morganton.
- For November stays, consider implementing length-of-stay discounts or slightly higher rates for bookings made less than 77 days out to capitalize on advance planning.
- Target marketing efforts for the Fall season well in advance (at least 60 days) to capture early planners.
- Monitor your own booking lead times against these Morganton averages to identify opportunities for dynamic pricing adjustments.
Popular & Essential Airbnb Amenities in Morganton (2026)
Amenity Prevalence
Amenity Insights for Morganton
- Essential amenities in Morganton that guests expect include: Wifi, Smoke alarm, Air conditioning, Heating, Fire extinguisher, Microwave, Refrigerator, TV, Free parking on premises, Kitchen. Lacking these (any) could significantly impact bookings.
Recommendations for Hosts
- Ensure your listing includes all essential amenities for Morganton: Wifi, Smoke alarm, Air conditioning, Heating, Fire extinguisher, Microwave, Refrigerator, TV, Free parking on premises, Kitchen.
- Prioritize adding missing essentials: Smoke alarm, Air conditioning, Heating, Fire extinguisher, Microwave, Refrigerator, TV, Free parking on premises, Kitchen.
- Highlight unique or less common amenities you offer (e.g., hot tub, dedicated workspace, EV charger) in your listing description and photos.
- Regularly check competitor amenities in Morganton to stay competitive.
Morganton Airbnb Guest Demographics & Profile Analysis (2026)
Guest Profile Summary for Morganton
- The typical guest profile for Airbnb in Morganton consists of primarily domestic travelers (98%), often arriving from nearby Atlanta, typically belonging to the Post-2000s (Gen Z/Alpha) group (50%), primarily speaking English or Spanish.
- Domestic travelers account for 98.4% of guests.
- Key international markets include United States (98.4%) and Mexico (0.2%).
- Top languages spoken are English (75.5%) followed by Spanish (11.7%).
- A significant demographic segment is the Post-2000s (Gen Z/Alpha) group, representing 50% of guests.
Recommendations for Hosts
- Target domestic marketing efforts towards travelers from Atlanta and Orlando.
- Tailor amenities and listing descriptions to appeal to the dominant Post-2000s (Gen Z/Alpha) demographic (e.g., highlight fast WiFi, smart home features, local guides).
- Highlight unique local experiences or amenities relevant to the primary guest profile.
- Consider seasonal promotions aligned with peak travel times for key origin markets.
Nearby Short-Term Rental Market Comparison
How does the Morganton Airbnb market stack up against its neighbors? Compare key performance metrics like average monthly revenue, ADR, and occupancy rates in surrounding areas to understand the broader regional STR landscape.
| Market | Active Properties | Monthly Revenue | Daily Rate | Avg. Occupancy |
|---|---|---|---|---|
| Sevier County | 68 | $7,108 | $567.95 | 44% |
| Bogart | 13 | $5,528 | $637.81 | 35% |
| Gilmer County | 26 | $5,298 | $459.59 | 40% |
| Sevierville | 6,269 | $4,747 | $370.20 | 46% |
| Fannin County | 42 | $4,574 | $435.93 | 38% |
| East Ellijay | 15 | $4,415 | $368.05 | 41% |
| Epworth | 79 | $4,411 | $406.97 | 40% |
| Gatlinburg | 3,565 | $4,385 | $353.70 | 45% |
| Commerce | 19 | $4,298 | $285.34 | 45% |
| Eatonton | 236 | $4,178 | $502.80 | 33% |