Mineral Bluff Airbnb Market Analysis 2026: Short Term Rental Data & Vacation Rental Statistics in Georgia, United States
Is Airbnb profitable in Mineral Bluff in 2026? Explore comprehensive Airbnb analytics for Mineral Bluff, Georgia, United States to uncover income potential. This 2026 STR market report for Mineral Bluff, based on AirROI data from February 2025 to January 2026, reveals key trends in the market of 358 active listings.
Whether you're considering an Airbnb investment in Mineral Bluff, optimizing your existing vacation rental, or exploring rental arbitrage opportunities, understanding the Mineral Bluff Airbnb data is crucial. Leveraging the low regulation environment is key to maximizing your short term rental income potential. Let's dive into the specifics.
Key Mineral Bluff Airbnb Performance Metrics Overview
Monthly Airbnb Revenue Variations & Income Potential in Mineral Bluff (2026)
Understanding the monthly revenue variations for Airbnb listings in Mineral Bluff is key to maximizing your short term rental income potential. Seasonality significantly impacts earnings. Our analysis, based on data from the past 12 months, shows that the peak revenue month for STRs in Mineral Bluff is typically October, while February often presents the lowest earnings, highlighting opportunities for strategic pricing adjustments during shoulder and low seasons. Explore the typical Airbnb income in Mineral Bluff across different performance tiers:
- Best-in-class properties (Top 10%) achieve $8,227+ monthly, often utilizing dynamic pricing and superior guest experiences.
- Strong performing properties (Top 25%) earn $5,429 or more, indicating effective management and desirable locations/amenities.
- Typical properties (Median) generate around $3,228 per month, representing the average market performance.
- Entry-level properties (Bottom 25%) see earnings around $1,845, often with potential for optimization.
Average Monthly Airbnb Earnings Trend in Mineral Bluff
Mineral Bluff Airbnb Occupancy Rate Trends (2026)
Maximize your bookings by understanding the Mineral Bluff STR occupancy trends. Seasonal demand shifts significantly influence how often properties are booked. Typically, Octobersees the highest demand (peak season occupancy), while January experiences the lowest (low season). Effective strategies, like adjusting minimum stays or offering promotions, can boost occupancy during slower periods. Here's how different property tiers perform in Mineral Bluff:
- Best-in-class properties (Top 10%) achieve 69%+ occupancy, indicating high desirability and potentially optimized availability.
- Strong performing properties (Top 25%) maintain 53% or higher occupancy, suggesting good market fit and guest satisfaction.
- Typical properties (Median) have an occupancy rate around 34%.
- Entry-level properties (Bottom 25%) average 19% occupancy, potentially facing higher vacancy.
Average Monthly Occupancy Rate Trend in Mineral Bluff
Average Daily Rate (ADR) Airbnb Trends in Mineral Bluff (2026)
Effective short term rental pricing strategy in Mineral Bluff involves understanding monthly ADR fluctuations. The Average Daily Rate (ADR) for Airbnb in Mineral Bluff typically peaks in December and dips lowest during April. Leveraging Airbnb dynamic pricing tools or strategies based on this seasonality can significantly boost revenue. Here's a look at the typical nightly rates achieved:
- Best-in-class properties (Top 10%) command rates of $541+ per night, often due to premium features or locations.
- Strong performing properties (Top 25%) achieve nightly rates of $404 or more.
- Typical properties (Median) charge around $303 per night.
- Entry-level properties (Bottom 25%) earn around $236 per night.
Average Daily Rate (ADR) Trend by Month in Mineral Bluff
Get Live Mineral Bluff Market Intelligence 👇

Explore Real-time Analytics
Airbnb Seasonality Analysis & Trends in Mineral Bluff (2026)
Peak Season (October, December, November)
- Revenue averages $5,851 per month
- Occupancy rates average 44.8%
- Daily rates average $416
Shoulder Season
- Revenue averages $3,967 per month
- Occupancy maintains around 36.4%
- Daily rates hold near $326
Low Season (January, February, April)
- Revenue drops to average $3,019 per month
- Occupancy decreases to average 31.5%
- Daily rates adjust to average $318
Seasonality Insights for Mineral Bluff
- The Airbnb seasonality in Mineral Bluff shows highly seasonal trends requiring careful strategy. While the sections above show seasonal averages, it's also insightful to look at the extremes:
- During the high season, the absolute peak month showcases Mineral Bluff's highest earning potential, with monthly revenues capable of climbing to $6,146, occupancy reaching a high of 48.2%, and ADRs peaking at $429.
- Conversely, the slowest single month of the year, typically falling within the low season, marks the market's lowest point. In this month, revenue might dip to $2,817, occupancy could drop to 26.8%, and ADRs may adjust down to $285.
- Understanding both the seasonal averages and these monthly peaks and troughs in revenue, occupancy, and ADR is crucial for maximizing your Airbnb profit potential in Mineral Bluff.
Seasonal Strategies for Maximizing Profit
- Peak Season: Maximize revenue through premium pricing and potentially longer minimum stays. Ensure high availability.
- Low Season: Offer competitive pricing, special promotions (e.g., extended stay discounts), and flexible cancellation policies. Target off-season travelers like remote workers or budget-conscious guests.
- Shoulder Seasons: Implement dynamic pricing that balances peak and low rates. Target weekend travelers or specific events. Offer slightly more flexible terms than peak season.
- Regularly analyze your own performance against these Mineral Bluff seasonality benchmarks and adjust your pricing and availability strategy accordingly.
Best Areas for Airbnb Investment in Mineral Bluff (2026)
Exploring the top neighborhoods for short-term rentals in Mineral Bluff? This section highlights key areas, outlining why they are attractive for hosts and guests, along with notable local attractions. Consider these locations based on your target guest profile and investment strategy.
| Neighborhood / Area | Why Host Here? (Target Guests & Appeal) | Key Attractions & Landmarks |
|---|---|---|
| Upper Blue Ridge | A tranquil destination known for its scenic views and outdoor activities. Full of charm and ideal for nature lovers seeking a peaceful retreat only a short drive from downtown Blue Ridge. | Blue Ridge Lake, Aska Trail, Blue Ridge Scenic Railway, Mercier Orchards, Toccoa River |
| Cherry Log | Nestled in the mountains, Cherry Log offers a quintessential cabin experience with easy access to hiking, fishing, and relaxation. Perfect for families and couples looking for a romantic getaway. | Cherry Log Christian Church, Hiking Trails, Scenic Drives, Local Cabins |
| Blue Ridge Downtown | The vibrant downtown area with shops, restaurants, and cultural attractions. A great place for visitors who want to experience local charm while being close to outdoor adventures. | Blue Ridge Scenic Railway, Local Art Galleries, Shady Grove Baptist Church, Restaurants, Festivals |
| Ellijay | Known as the Apple Capital of Georgia, Ellijay is perfect for those who enjoy fruit picking and outdoor festivals. It's a family-friendly area with plenty of fun activities throughout the year. | Apple Orchards, Historic Downtown Ellijay, Cartecay River, Mountain Biking Trails, Local Wineries |
| Blairsville | A picturesque mountain town offering access to Lake Nottely and the Chattahoochee National Forest. Ideal for those looking to enjoy the great outdoors and a peaceful mountain environment. | Lake Nottely, Blood Mountain, Vogel State Park, Local Hiking Trails |
| Hiawassee | Located on the shores of Lake Chatuge, Hiawassee offers water activities and stunning mountain views. Attracts visitors looking for relaxation and outdoor adventures. | Lake Chatuge, Hiawassee River, Georgia Mountain Fairgrounds, Bell Mountain |
| Suches | Known as the 'Valley Above the Clouds', Suches is a great spot for those seeking solitude and natural beauty. Its vast wilderness and hiking trails make it a hidden gem. | Blood Mountain Wilderness, Wolfpen Gap, Local Hiking Trails, Scenic Views |
| Young Harris | Home to the fascinating Young Harris College, this small town is perfect for visitors interested in arts and culture, as well as outdoor activities. | Young Harris College, Chatuge Lake, Local Arts and Crafts Shops, Scenic Forests |
Understanding Airbnb License Requirements & STR Laws in Mineral Bluff (2026)
While Mineral Bluff, Georgia, United States currently shows low STR regulations, specific Airbnb license requirements might still exist or change. Always verify the latest short term rental regulations and Airbnb license requirements directly with local government authorities for Mineral Bluff to ensure full compliance before hosting.
(Source: AirROI data, 2026, based on 1% licensed listings)
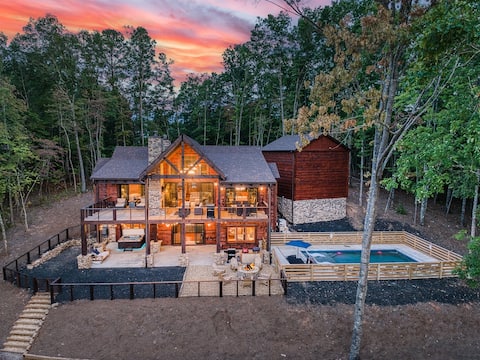
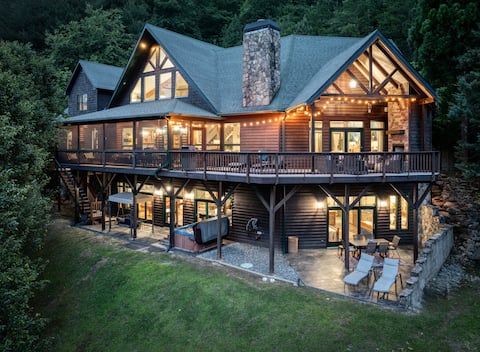
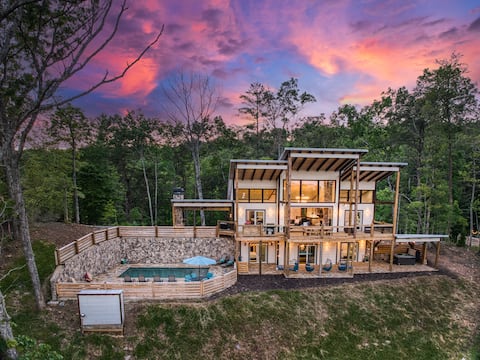
Top Performing Airbnb Properties in Mineral Bluff (2026)
Benchmark your potential! Explore examples of top-performing Airbnb properties in Mineral Bluffbased on Trailing Twelve Month (TTM) revenue. Analyze their characteristics, revenue, occupancy rate, and ADR to understand what drives success in this market.

Luxury Riverfront Pool Theater Games Hot Tub
Entire Place • 9 bedrooms
Pool, Views, Sauna & Cold Plunge, 5 Kings, Peloton
Entire Place • 6 bedrooms

Blue Ridge Family Oasis: Heated Pool, Sauna, Hot T
Entire Place • 6 bedrooms

Views*5 kings*Hot Tub*Heated Pool*Holiday Magic
Entire Place • 6 bedrooms
6 BR Lodge on the Toccoa w/pool
Entire Place • 6 bedrooms
Pool * View * Outdoor Kitchen & Fireplace * HotTub
Entire Place • 4 bedrooms
Note: Performance varies based on location, size, amenities, seasonality, and management quality. Data reflects the past 12 months.
Top Performing Airbnb Hosts in Mineral Bluff (2026)
Learn from the best! This table showcases top-performing Airbnb hosts in Mineral Bluff based on the number of properties managed and estimated total revenue over the past year. Analyze their scale and performance metrics.
| Host Name | Properties | Grossing Revenue | Stay Reviews | Avg Rating |
|---|---|---|---|---|
| Escape To Blue Ridge | 28 | $919,544 | 77 | 4.94/5.0 |
| Southern Comfort | 20 | $741,127 | 223 | 4.77/5.0 |
| Faith | 6 | $641,177 | 193 | 4.96/5.0 |
| Jenny B. | 15 | $393,611 | 132 | 4.72/5.0 |
| Kristy Collection | 2 | $393,427 | 51 | 4.91/5.0 |
| Taylar | 7 | $350,513 | 229 | 4.89/5.0 |
| Jodi And Steve | 2 | $333,536 | 42 | 5.00/5.0 |
| Bruce And Beatriz | 5 | $318,671 | 612 | 4.95/5.0 |
| Blue Sky Cabin | 10 | $260,841 | 56 | 4.94/5.0 |
| Kathleen | 1 | $234,766 | 50 | 4.98/5.0 |
Analyzing the strategies of top hosts, such as their property selection, pricing, and guest communication, can offer valuable lessons for optimizing your own Airbnb operations in Mineral Bluff.
Dive Deeper: Advanced Mineral Bluff STR Market Data (2026)
Ready to unlock more insights? AirROI provides access to advanced metrics and comprehensive Airbnb data for Mineral Bluff. Explore detailed analytics beyond this report to refine your investment strategy, optimize pricing, and maximize your vacation rental profits.
Explore Advanced MetricsMineral Bluff Short-Term Rental Market Composition (2026): Property & Room Types
Room Type Distribution
Property Type Distribution
Market Composition Insights for Mineral Bluff
- The Mineral Bluff Airbnb market composition is heavily skewed towards Entire Home/Apt listings, which make up 98.3% of the 358 active rentals. This indicates strong guest preference for privacy and space.
- Looking at the property type distribution in Mineral Bluff, Outdoor/Unique properties are the most common (86%), reflecting the local real estate landscape.
- Smaller segments like hotel/boutique, apartment/condo, unique stays (combined 1.2%) offer potential for unique stay experiences.
Mineral Bluff Airbnb Room Capacity Analysis (2026): Bedroom Distribution
Distribution of Listings by Number of Bedrooms
Room Capacity Insights for Mineral Bluff
- The dominant room capacity in Mineral Bluff is 3 bedrooms listings, making up 47.2% of the market. This suggests a strong demand for properties suitable for families or small groups.
- Together, 3 bedrooms and 4 bedrooms properties represent 70.9% of the active Airbnb listings in Mineral Bluff, indicating a high concentration in these sizes.
- A significant 77.0% of listings offer 3+ bedrooms, catering to larger groups and families seeking more space in Mineral Bluff.
Mineral Bluff Vacation Rental Guest Capacity Trends (2026)
Distribution of Listings by Guest Capacity
Guest Capacity Insights for Mineral Bluff
- The most common guest capacity trend in Mineral Bluff vacation rentals is listings accommodating 8+ guests (60.9%). This suggests the primary traveler segment is likely larger groups.
- Properties designed for 8+ guests and 6 guests dominate the Mineral Bluff STR market, accounting for 81.0% of listings.
- 84.1% of properties accommodate 6+ guests, serving the market segment for larger families or group travel in Mineral Bluff.
- On average, properties in Mineral Bluff are equipped to host 6.8 guests.
Mineral Bluff Airbnb Booking Patterns (2026): Available vs. Booked Days
Available Days Distribution
Booked Days Distribution
Booking Pattern Insights for Mineral Bluff
- The most common availability pattern in Mineral Bluff falls within the 271-366 days range, representing 50.8% of listings. This suggests many properties have significant open periods on their calendars.
- Approximately 83.5% of listings show high availability (181+ days open annually), indicating potential for increased bookings or specific owner usage patterns.
- For booked days, the 31-90 days range is most frequent in Mineral Bluff (34.9%), reflecting common guest stay durations or potential owner blocking patterns.
- A notable 18.5% of properties secure long booking periods (181+ days booked per year), highlighting successful long-term rental strategies or significant owner usage.
Mineral Bluff Airbnb Minimum Stay Requirements Analysis
Distribution of Listings by Minimum Night Requirement
1 Night
13 listings
3.6% of total
2 Nights
170 listings
47.5% of total
3 Nights
18 listings
5% of total
4-6 Nights
3 listings
0.8% of total
30+ Nights
154 listings
43% of total
Key Insights
- The most prevalent minimum stay requirement in Mineral Bluff is 2 Nights, adopted by 47.5% of listings. This highlights the market's preference for shorter, flexible bookings.
- A significant segment (43%) caters to monthly stays (30+ nights) in Mineral Bluff, pointing to opportunities in the extended-stay market.
Recommendations
- Align with the market by considering a 2 Nights minimum stay, as 47.5% of Mineral Bluff hosts use this setting.
- If feasible, allowing 1-night stays, especially midweek or during low season, could capture last-minute bookings, as only 3.6% currently do.
- A 2-night minimum appears standard (47.5%). Consider this for weekends or peak periods.
- Explore offering discounts for stays of 30+ nights to attract the 43% of the market seeking extended stays.
- Adjust minimum nights based on seasonality – potentially shorter during low season and longer during peak demand periods in Mineral Bluff.
Mineral Bluff Airbnb Cancellation Policy Trends Analysis (2026)
Limited
14 listings
3.9% of total
Super Strict 60 Days
8 listings
2.2% of total
Super Strict 30 Days
31 listings
8.7% of total
Flexible
26 listings
7.3% of total
Moderate
102 listings
28.5% of total
Firm
111 listings
31% of total
Strict
66 listings
18.4% of total
Cancellation Policy Insights for Mineral Bluff
- The prevailing Airbnb cancellation policy trend in Mineral Bluff is Firm, used by 31% of listings.
- There's a relatively balanced mix between guest-friendly (35.8%) and stricter (49.4%) policies, offering choices for different guest needs.
Recommendations for Hosts
- Consider adopting a Firm policy to align with the 31% market standard in Mineral Bluff.
- Regularly review your cancellation policy against competitors and market demand shifts in Mineral Bluff.
Mineral Bluff STR Booking Lead Time Analysis (2026)
Average Booking Lead Time by Month
Booking Lead Time Insights for Mineral Bluff
- The overall average booking lead time for vacation rentals in Mineral Bluff is 52 days.
- Guests book furthest in advance for stays during November (average 87 days), likely coinciding with peak travel demand or local events.
- The shortest booking windows occur for stays in February (average 34 days), indicating more last-minute travel plans during this time.
- Seasonally, Fall (69 days avg.) sees the longest lead times, while Spring (41 days avg.) has the shortest, reflecting typical travel planning cycles.
Recommendations for Hosts
- Use the overall average lead time (52 days) as a baseline for your pricing and availability strategy in Mineral Bluff.
- For November stays, consider implementing length-of-stay discounts or slightly higher rates for bookings made less than 87 days out to capitalize on advance planning.
- Target marketing efforts for the Fall season well in advance (at least 69 days) to capture early planners.
- Monitor your own booking lead times against these Mineral Bluff averages to identify opportunities for dynamic pricing adjustments.
Popular & Essential Airbnb Amenities in Mineral Bluff (2026)
Amenity Prevalence
Amenity Insights for Mineral Bluff
- Essential amenities in Mineral Bluff that guests expect include: Air conditioning, Wifi, Heating, Refrigerator, Kitchen, Smoke alarm, Coffee maker, Microwave, Washer, Free parking on premises. Lacking these (any) could significantly impact bookings.
Recommendations for Hosts
- Ensure your listing includes all essential amenities for Mineral Bluff: Air conditioning, Wifi, Heating, Refrigerator, Kitchen, Smoke alarm, Coffee maker, Microwave, Washer, Free parking on premises.
- Prioritize adding missing essentials: Air conditioning, Wifi, Heating, Refrigerator, Kitchen, Smoke alarm, Coffee maker, Microwave, Washer, Free parking on premises.
- Highlight unique or less common amenities you offer (e.g., hot tub, dedicated workspace, EV charger) in your listing description and photos.
- Regularly check competitor amenities in Mineral Bluff to stay competitive.
Mineral Bluff Airbnb Guest Demographics & Profile Analysis (2026)
Guest Profile Summary for Mineral Bluff
- The typical guest profile for Airbnb in Mineral Bluff consists of primarily domestic travelers (99%), often arriving from nearby Atlanta, typically belonging to the Post-2000s (Gen Z/Alpha) group (50%), primarily speaking English or Spanish.
- Domestic travelers account for 98.7% of guests.
- Key international markets include United States (98.7%) and Canada (0.3%).
- Top languages spoken are English (77.5%) followed by Spanish (12.6%).
- A significant demographic segment is the Post-2000s (Gen Z/Alpha) group, representing 50% of guests.
Recommendations for Hosts
- Target domestic marketing efforts towards travelers from Atlanta and Tampa.
- Tailor amenities and listing descriptions to appeal to the dominant Post-2000s (Gen Z/Alpha) demographic (e.g., highlight fast WiFi, smart home features, local guides).
- Highlight unique local experiences or amenities relevant to the primary guest profile.
- Consider seasonal promotions aligned with peak travel times for key origin markets.
Nearby Short-Term Rental Market Comparison
How does the Mineral Bluff Airbnb market stack up against its neighbors? Compare key performance metrics like average monthly revenue, ADR, and occupancy rates in surrounding areas to understand the broader regional STR landscape.
| Market | Active Properties | Monthly Revenue | Daily Rate | Avg. Occupancy |
|---|---|---|---|---|
| Sevier County | 68 | $7,108 | $567.95 | 44% |
| Bogart | 13 | $5,528 | $637.81 | 35% |
| Gilmer County | 26 | $5,298 | $459.59 | 40% |
| Sevierville | 6,269 | $4,747 | $370.20 | 46% |
| Fannin County | 42 | $4,574 | $435.93 | 38% |
| East Ellijay | 15 | $4,415 | $368.05 | 41% |
| Epworth | 79 | $4,411 | $406.97 | 40% |
| Gatlinburg | 3,565 | $4,385 | $353.70 | 45% |
| Commerce | 19 | $4,298 | $285.34 | 45% |
| Eatonton | 236 | $4,178 | $502.80 | 33% |