Gilmer County Airbnb Market Analysis 2026: Short Term Rental Data & Vacation Rental Statistics in Georgia, United States
Is Airbnb profitable in Gilmer County in 2026? Explore comprehensive Airbnb analytics for Gilmer County, Georgia, United States to uncover income potential. This 2026 STR market report for Gilmer County, based on AirROI data from February 2025 to January 2026, reveals key trends in the niche market of 26 active listings.
Whether you're considering an Airbnb investment in Gilmer County, optimizing your existing vacation rental, or exploring rental arbitrage opportunities, understanding the Gilmer County Airbnb data is crucial. Leveraging the low regulation environment is key to maximizing your short term rental income potential. Let's dive into the specifics.
Key Gilmer County Airbnb Performance Metrics Overview
Monthly Airbnb Revenue Variations & Income Potential in Gilmer County (2026)
Understanding the monthly revenue variations for Airbnb listings in Gilmer County is key to maximizing your short term rental income potential. Seasonality significantly impacts earnings. Our analysis, based on data from the past 12 months, shows that the peak revenue month for STRs in Gilmer County is typically October, while February often presents the lowest earnings, highlighting opportunities for strategic pricing adjustments during shoulder and low seasons. Explore the typical Airbnb income in Gilmer County across different performance tiers:
- Best-in-class properties (Top 10%) achieve $13,173+ monthly, often utilizing dynamic pricing and superior guest experiences.
- Strong performing properties (Top 25%) earn $9,448 or more, indicating effective management and desirable locations/amenities.
- Typical properties (Median) generate around $4,466 per month, representing the average market performance.
- Entry-level properties (Bottom 25%) see earnings around $2,316, often with potential for optimization.
Average Monthly Airbnb Earnings Trend in Gilmer County
Gilmer County Airbnb Occupancy Rate Trends (2026)
Maximize your bookings by understanding the Gilmer County STR occupancy trends. Seasonal demand shifts significantly influence how often properties are booked. Typically, Octobersees the highest demand (peak season occupancy), while April experiences the lowest (low season). Effective strategies, like adjusting minimum stays or offering promotions, can boost occupancy during slower periods. Here's how different property tiers perform in Gilmer County:
- Best-in-class properties (Top 10%) achieve 71%+ occupancy, indicating high desirability and potentially optimized availability.
- Strong performing properties (Top 25%) maintain 59% or higher occupancy, suggesting good market fit and guest satisfaction.
- Typical properties (Median) have an occupancy rate around 42%.
- Entry-level properties (Bottom 25%) average 25% occupancy, potentially facing higher vacancy.
Average Monthly Occupancy Rate Trend in Gilmer County
Average Daily Rate (ADR) Airbnb Trends in Gilmer County (2026)
Effective short term rental pricing strategy in Gilmer County involves understanding monthly ADR fluctuations. The Average Daily Rate (ADR) for Airbnb in Gilmer County typically peaks in December and dips lowest during February. Leveraging Airbnb dynamic pricing tools or strategies based on this seasonality can significantly boost revenue. Here's a look at the typical nightly rates achieved:
- Best-in-class properties (Top 10%) command rates of $798+ per night, often due to premium features or locations.
- Strong performing properties (Top 25%) achieve nightly rates of $599 or more.
- Typical properties (Median) charge around $344 per night.
- Entry-level properties (Bottom 25%) earn around $258 per night.
Average Daily Rate (ADR) Trend by Month in Gilmer County
Get Live Gilmer County Market Intelligence 👇

Explore Real-time Analytics
Airbnb Seasonality Analysis & Trends in Gilmer County (2026)
Peak Season (October, December, July)
- Revenue averages $8,630 per month
- Occupancy rates average 53.1%
- Daily rates average $504
Shoulder Season
- Revenue averages $6,410 per month
- Occupancy maintains around 42.1%
- Daily rates hold near $458
Low Season (February, April, May)
- Revenue drops to average $3,920 per month
- Occupancy decreases to average 35.7%
- Daily rates adjust to average $397
Seasonality Insights for Gilmer County
- The Airbnb seasonality in Gilmer County shows highly seasonal trends requiring careful strategy. While the sections above show seasonal averages, it's also insightful to look at the extremes:
- During the high season, the absolute peak month showcases Gilmer County's highest earning potential, with monthly revenues capable of climbing to $9,002, occupancy reaching a high of 55.4%, and ADRs peaking at $562.
- Conversely, the slowest single month of the year, typically falling within the low season, marks the market's lowest point. In this month, revenue might dip to $3,461, occupancy could drop to 32.1%, and ADRs may adjust down to $377.
- Understanding both the seasonal averages and these monthly peaks and troughs in revenue, occupancy, and ADR is crucial for maximizing your Airbnb profit potential in Gilmer County.
Seasonal Strategies for Maximizing Profit
- Peak Season: Maximize revenue through premium pricing and potentially longer minimum stays. Ensure high availability.
- Low Season: Offer competitive pricing, special promotions (e.g., extended stay discounts), and flexible cancellation policies. Target off-season travelers like remote workers or budget-conscious guests.
- Shoulder Seasons: Implement dynamic pricing that balances peak and low rates. Target weekend travelers or specific events. Offer slightly more flexible terms than peak season.
- Regularly analyze your own performance against these Gilmer County seasonality benchmarks and adjust your pricing and availability strategy accordingly.
Best Areas for Airbnb Investment in Gilmer County (2026)
Exploring the top neighborhoods for short-term rentals in Gilmer County? This section highlights key areas, outlining why they are attractive for hosts and guests, along with notable local attractions. Consider these locations based on your target guest profile and investment strategy.
| Neighborhood / Area | Why Host Here? (Target Guests & Appeal) | Key Attractions & Landmarks |
|---|---|---|
| Blue Ridge Lake | A stunning lakeside area perfect for outdoor enthusiasts and nature lovers. Offers beautiful scenery and activities like fishing, hiking, and boating, making it a desirable spot for vacation rentals. | Blue Ridge Lake, Lake Ocoee, Meridian's Lakeside, Aska Mining Company, Cohutta Wilderness Area, Toccoa River |
| Ellijay | A charming town known for its apple orchards and beautiful scenery. It attracts visitors, especially in the fall, making it a great location for seasonal rentals. | Hillcrest Orchards, Ellijay River, Apple Hill Farms, Cartecay Vineyards, Gilmer Arts |
| Big Canoe | A gated community that offers a range of amenities and natural beauty. It's a popular retreat for families and individuals seeking relaxation and outdoor activities. | Big Canoe Lake, Hiking Trails, Golf Courses, Waterfalls, Fishing and Canoeing |
| Cherry Log | A small, peaceful community close to Blue Ridge and offers cabin rentals amidst beautiful mountain scenery. Ideal for those looking for a cozy getaway. | Cherry Log Creek, Nearby hiking trails, Amicalola Falls State Park, Blue Ridge Scenic Railway |
| Dahlonega | Known for its gold rush history and vibrant arts scene, Dahlonega attracts tourists interested in both nature and culture, offering strong potential for Airbnbs. | Dahlonega Gold Museum, Consolidated Gold Mine, Wine Tours, Cannon Falls Park, North Georgia College & State University |
| Cascadia | A remote and serene area providing ample opportunities for outdoor adventures like hiking and fishing. It's perfect for travelers looking to escape the city. | Wildcat Creek Falls, Hiking trails in the Chattahoochee National Forest, Nearby fishing spots |
| Hiawassee | Located by Lake Chatuge and surrounded by mountains, Hiawassee is increasingly popular for water sports and mountain activities, making it a prime location for vacation homes. | Lake Chatuge, Hiawassee River, Trackrock Stables, Chatuge Dam |
| Blairsville | Nestled in the mountains with easy access to scenic drives, hiking, and outdoor activities, Blairsville is a quaint town that attracts many visitors year-round. | Union County Historical Society, Vogel State Park, Nottely Lake, Sautee and Nacoochee Arts and Crafts |
Understanding Airbnb License Requirements & STR Laws in Gilmer County (2026)
While Gilmer County, Georgia, United States currently shows low STR regulations, specific Airbnb license requirements might still exist or change. Always verify the latest short term rental regulations and Airbnb license requirements directly with local government authorities for Gilmer County to ensure full compliance before hosting.
(Source: AirROI data, 2026, finding no licensed listings among those analyzed)
Top Performing Airbnb Properties in Gilmer County (2026)
Benchmark your potential! Explore examples of top-performing Airbnb properties in Gilmer Countybased on Trailing Twelve Month (TTM) revenue. Analyze their characteristics, revenue, occupancy rate, and ADR to understand what drives success in this market.

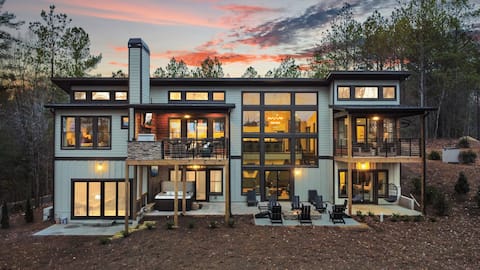
Luxury Retreat, Mountain View, Wellness, sleeps 22
Entire Place • 9 bedrooms
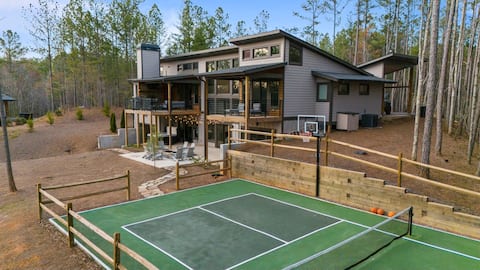
Amazing Grace ~Pickleball, Pool, Hot Tub, Fire Pit
Entire Place • 5 bedrooms

Splash Mountain Lodge ~ Indoor Pool ~ Fire Pit
Entire Place • 5 bedrooms
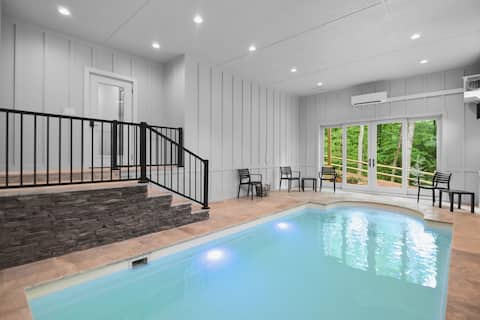
Living Water ~ 5BR ~ Indoor Pool ~ Water Wall
Entire Place • 5 bedrooms
Higher Ground ~ Indoor Pool ~ Hot Tub ~ Fire Pit
Entire Place • 5 bedrooms
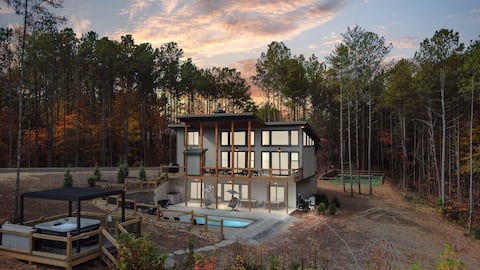
Mountain Oasis ~ Pickleball, Pool, Hot Tub & More!
Entire Place • 4 bedrooms
Note: Performance varies based on location, size, amenities, seasonality, and management quality. Data reflects the past 12 months.
Top Performing Airbnb Hosts in Gilmer County (2026)
Learn from the best! This table showcases top-performing Airbnb hosts in Gilmer County based on the number of properties managed and estimated total revenue over the past year. Analyze their scale and performance metrics.
| Host Name | Properties | Grossing Revenue | Stay Reviews | Avg Rating |
|---|---|---|---|---|
| Coastal Vibe Vacations | 7 | $806,214 | 219 | 4.87/5.0 |
| Faith | 3 | $335,451 | 23 | 5.00/5.0 |
| Drew | 1 | $93,026 | 144 | 4.83/5.0 |
| Ricardo | 1 | $59,776 | 146 | 4.97/5.0 |
| Willow Creek Cabin Rentals | 1 | $51,184 | 36 | 4.97/5.0 |
| Southern Comfort | 2 | $49,509 | 28 | 4.93/5.0 |
| Paola | 1 | $45,883 | 56 | 4.98/5.0 |
| Jamison | 1 | $39,989 | 232 | 4.91/5.0 |
| Mick | 1 | $34,668 | 192 | 4.94/5.0 |
| Morning Breeze | 1 | $33,985 | 9 | 4.89/5.0 |
Analyzing the strategies of top hosts, such as their property selection, pricing, and guest communication, can offer valuable lessons for optimizing your own Airbnb operations in Gilmer County.
Dive Deeper: Advanced Gilmer County STR Market Data (2026)
Ready to unlock more insights? AirROI provides access to advanced metrics and comprehensive Airbnb data for Gilmer County. Explore detailed analytics beyond this report to refine your investment strategy, optimize pricing, and maximize your vacation rental profits.
Explore Advanced MetricsGilmer County Short-Term Rental Market Composition (2026): Property & Room Types
Room Type Distribution
Property Type Distribution
Market Composition Insights for Gilmer County
- The Gilmer County Airbnb market composition is heavily skewed towards Entire Home/Apt listings, which make up 96.2% of the 26 active rentals. This indicates strong guest preference for privacy and space.
- Looking at the property type distribution in Gilmer County, Outdoor/Unique properties are the most common (80.8%), reflecting the local real estate landscape.
- Houses represent a significant 19.2% portion, catering likely to families or larger groups.
Gilmer County Airbnb Room Capacity Analysis (2026): Bedroom Distribution
Distribution of Listings by Number of Bedrooms
Room Capacity Insights for Gilmer County
- The dominant room capacity in Gilmer County is 5+ bedrooms listings, making up 34.6% of the market. This suggests a strong demand for properties suitable for families or small groups.
- Together, 5+ bedrooms and 2 bedrooms properties represent 61.5% of the active Airbnb listings in Gilmer County, indicating a high concentration in these sizes.
- A significant 73.1% of listings offer 3+ bedrooms, catering to larger groups and families seeking more space in Gilmer County.
Gilmer County Vacation Rental Guest Capacity Trends (2026)
Distribution of Listings by Guest Capacity
Guest Capacity Insights for Gilmer County
- The most common guest capacity trend in Gilmer County vacation rentals is listings accommodating 8+ guests (57.7%). This suggests the primary traveler segment is likely larger groups.
- Properties designed for 8+ guests and 6 guests dominate the Gilmer County STR market, accounting for 80.8% of listings.
- 80.8% of properties accommodate 6+ guests, serving the market segment for larger families or group travel in Gilmer County.
- On average, properties in Gilmer County are equipped to host 6.8 guests.
Gilmer County Airbnb Booking Patterns (2026): Available vs. Booked Days
Available Days Distribution
Booked Days Distribution
Booking Pattern Insights for Gilmer County
- The most common availability pattern in Gilmer County falls within the 271-366 days range, representing 34.6% of listings. This suggests many properties have significant open periods on their calendars.
- Approximately 69.2% of listings show high availability (181+ days open annually), indicating potential for increased bookings or specific owner usage patterns.
- For booked days, the 91-180 days range is most frequent in Gilmer County (38.5%), reflecting common guest stay durations or potential owner blocking patterns.
- A notable 34.6% of properties secure long booking periods (181+ days booked per year), highlighting successful long-term rental strategies or significant owner usage.
Gilmer County Airbnb Minimum Stay Requirements Analysis
Distribution of Listings by Minimum Night Requirement
2 Nights
12 listings
46.2% of total
3 Nights
3 listings
11.5% of total
30+ Nights
11 listings
42.3% of total
Key Insights
- The most prevalent minimum stay requirement in Gilmer County is 2 Nights, adopted by 46.2% of listings. This highlights the market's preference for shorter, flexible bookings.
- A significant segment (42.3%) caters to monthly stays (30+ nights) in Gilmer County, pointing to opportunities in the extended-stay market.
Recommendations
- Align with the market by considering a 2 Nights minimum stay, as 46.2% of Gilmer County hosts use this setting.
- A 2-night minimum appears standard (46.2%). Consider this for weekends or peak periods.
- Explore offering discounts for stays of 30+ nights to attract the 42.3% of the market seeking extended stays.
- Adjust minimum nights based on seasonality – potentially shorter during low season and longer during peak demand periods in Gilmer County.
Gilmer County Airbnb Cancellation Policy Trends Analysis (2026)
Super Strict 60 Days
6 listings
23.1% of total
Super Strict 30 Days
6 listings
23.1% of total
Limited
3 listings
11.5% of total
Flexible
2 listings
7.7% of total
Moderate
3 listings
11.5% of total
Firm
5 listings
19.2% of total
Strict
1 listings
3.8% of total
Cancellation Policy Insights for Gilmer County
- The prevailing Airbnb cancellation policy trend in Gilmer County is Super Strict 60 Days, used by 23.1% of listings.
- There's a relatively balanced mix between guest-friendly (19.2%) and stricter (23.0%) policies, offering choices for different guest needs.
- Strict cancellation policies are quite rare (3.8%), potentially making listings with this policy less competitive unless justified by high demand or property type.
Recommendations for Hosts
- Consider adopting a Super Strict 60 Days policy to align with the 23.1% market standard in Gilmer County.
- Using a Strict policy might deter some guests, as only 3.8% of listings use it. Evaluate if potential revenue protection outweighs possible lower booking rates.
- Regularly review your cancellation policy against competitors and market demand shifts in Gilmer County.
Gilmer County STR Booking Lead Time Analysis (2026)
Average Booking Lead Time by Month
Booking Lead Time Insights for Gilmer County
- The overall average booking lead time for vacation rentals in Gilmer County is 63 days.
- Guests book furthest in advance for stays during October (average 104 days), likely coinciding with peak travel demand or local events.
- The shortest booking windows occur for stays in March (average 48 days), indicating more last-minute travel plans during this time.
- Seasonally, Fall (85 days avg.) sees the longest lead times, while Summer (53 days avg.) has the shortest, reflecting typical travel planning cycles.
Recommendations for Hosts
- Use the overall average lead time (63 days) as a baseline for your pricing and availability strategy in Gilmer County.
- For October stays, consider implementing length-of-stay discounts or slightly higher rates for bookings made less than 104 days out to capitalize on advance planning.
- Target marketing efforts for the Fall season well in advance (at least 85 days) to capture early planners.
- Monitor your own booking lead times against these Gilmer County averages to identify opportunities for dynamic pricing adjustments.
Popular & Essential Airbnb Amenities in Gilmer County (2026)
Amenity Prevalence
No amenities with partial availability (less than 100%) were found to display in the chart. All essential amenities might be present in all listings. Check insights below.
Amenity Insights for Gilmer County
- Essential amenities in Gilmer County that guests expect include: Kitchen, Oven, Microwave, Bed linens, Free parking on premises, Air conditioning, Refrigerator, Heating, Dishes and silverware, BBQ grill. Lacking these (any) could significantly impact bookings.
Recommendations for Hosts
- Ensure your listing includes all essential amenities for Gilmer County: Kitchen, Oven, Microwave, Bed linens, Free parking on premises, Air conditioning, Refrigerator, Heating, Dishes and silverware, BBQ grill.
- Highlight unique or less common amenities you offer (e.g., hot tub, dedicated workspace, EV charger) in your listing description and photos.
- Regularly check competitor amenities in Gilmer County to stay competitive.
Gilmer County Airbnb Guest Demographics & Profile Analysis (2026)
Guest Profile Summary for Gilmer County
- The typical guest profile for Airbnb in Gilmer County consists of primarily domestic travelers (96%), often arriving from nearby Atlanta, typically belonging to the Post-2000s (Gen Z/Alpha) group (50%), primarily speaking English or Spanish.
- Domestic travelers account for 95.7% of guests.
- Key international markets include United States (95.7%) and DC (1.7%).
- Top languages spoken are English (77.6%) followed by Spanish (15.5%).
- A significant demographic segment is the Post-2000s (Gen Z/Alpha) group, representing 50% of guests.
Recommendations for Hosts
- Target domestic marketing efforts towards travelers from Atlanta and Tampa.
- Tailor amenities and listing descriptions to appeal to the dominant Post-2000s (Gen Z/Alpha) demographic (e.g., highlight fast WiFi, smart home features, local guides).
- Highlight unique local experiences or amenities relevant to the primary guest profile.
- Consider seasonal promotions aligned with peak travel times for key origin markets.
Nearby Short-Term Rental Market Comparison
How does the Gilmer County Airbnb market stack up against its neighbors? Compare key performance metrics like average monthly revenue, ADR, and occupancy rates in surrounding areas to understand the broader regional STR landscape.
| Market | Active Properties | Monthly Revenue | Daily Rate | Avg. Occupancy |
|---|---|---|---|---|
| Sevier County | 68 | $7,108 | $567.95 | 44% |
| Bogart | 13 | $5,528 | $637.81 | 35% |
| Sevierville | 6,269 | $4,747 | $370.20 | 46% |
| Fannin County | 42 | $4,574 | $435.93 | 38% |
| East Ellijay | 15 | $4,415 | $368.05 | 41% |
| Epworth | 79 | $4,411 | $406.97 | 40% |
| Gatlinburg | 3,565 | $4,385 | $353.70 | 45% |
| Commerce | 19 | $4,298 | $285.34 | 45% |
| Eatonton | 236 | $4,178 | $502.80 | 33% |
| Pigeon Forge | 2,938 | $4,158 | $337.10 | 45% |