Dallas Airbnb Market Analysis 2026: Short Term Rental Data & Vacation Rental Statistics in Georgia, United States
Is Airbnb profitable in Dallas in 2026? Explore comprehensive Airbnb analytics for Dallas, Georgia, United States to uncover income potential. This 2026 STR market report for Dallas, based on AirROI data from February 2025 to January 2026, reveals key trends in the niche market of 63 active listings.
Whether you're considering an Airbnb investment in Dallas, optimizing your existing vacation rental, or exploring rental arbitrage opportunities, understanding the Dallas Airbnb data is crucial. Leveraging the low regulation environment is key to maximizing your short term rental income potential. Let's dive into the specifics.
Key Dallas Airbnb Performance Metrics Overview
Monthly Airbnb Revenue Variations & Income Potential in Dallas (2026)
Understanding the monthly revenue variations for Airbnb listings in Dallas is key to maximizing your short term rental income potential. Seasonality significantly impacts earnings. Our analysis, based on data from the past 12 months, shows that the peak revenue month for STRs in Dallas is typically October, while January often presents the lowest earnings, highlighting opportunities for strategic pricing adjustments during shoulder and low seasons. Explore the typical Airbnb income in Dallas across different performance tiers:
- Best-in-class properties (Top 10%) achieve $5,380+ monthly, often utilizing dynamic pricing and superior guest experiences.
- Strong performing properties (Top 25%) earn $3,020 or more, indicating effective management and desirable locations/amenities.
- Typical properties (Median) generate around $1,501 per month, representing the average market performance.
- Entry-level properties (Bottom 25%) see earnings around $684, often with potential for optimization.
Average Monthly Airbnb Earnings Trend in Dallas
Dallas Airbnb Occupancy Rate Trends (2026)
Maximize your bookings by understanding the Dallas STR occupancy trends. Seasonal demand shifts significantly influence how often properties are booked. Typically, Julysees the highest demand (peak season occupancy), while January experiences the lowest (low season). Effective strategies, like adjusting minimum stays or offering promotions, can boost occupancy during slower periods. Here's how different property tiers perform in Dallas:
- Best-in-class properties (Top 10%) achieve 79%+ occupancy, indicating high desirability and potentially optimized availability.
- Strong performing properties (Top 25%) maintain 58% or higher occupancy, suggesting good market fit and guest satisfaction.
- Typical properties (Median) have an occupancy rate around 38%.
- Entry-level properties (Bottom 25%) average 19% occupancy, potentially facing higher vacancy.
Average Monthly Occupancy Rate Trend in Dallas
Average Daily Rate (ADR) Airbnb Trends in Dallas (2026)
Effective short term rental pricing strategy in Dallas involves understanding monthly ADR fluctuations. The Average Daily Rate (ADR) for Airbnb in Dallas typically peaks in October and dips lowest during March. Leveraging Airbnb dynamic pricing tools or strategies based on this seasonality can significantly boost revenue. Here's a look at the typical nightly rates achieved:
- Best-in-class properties (Top 10%) command rates of $287+ per night, often due to premium features or locations.
- Strong performing properties (Top 25%) achieve nightly rates of $180 or more.
- Typical properties (Median) charge around $118 per night.
- Entry-level properties (Bottom 25%) earn around $58 per night.
Average Daily Rate (ADR) Trend by Month in Dallas
Get Live Dallas Market Intelligence 👇

Explore Real-time Analytics
Airbnb Seasonality Analysis & Trends in Dallas (2026)
Peak Season (October, July, June)
- Revenue averages $3,129 per month
- Occupancy rates average 46.9%
- Daily rates average $162
Shoulder Season
- Revenue averages $2,401 per month
- Occupancy maintains around 40.0%
- Daily rates hold near $158
Low Season (January, February, April)
- Revenue drops to average $1,708 per month
- Occupancy decreases to average 37.7%
- Daily rates adjust to average $151
Seasonality Insights for Dallas
- The Airbnb seasonality in Dallas shows highly seasonal trends requiring careful strategy. While the sections above show seasonal averages, it's also insightful to look at the extremes:
- During the high season, the absolute peak month showcases Dallas's highest earning potential, with monthly revenues capable of climbing to $3,218, occupancy reaching a high of 51.2%, and ADRs peaking at $172.
- Conversely, the slowest single month of the year, typically falling within the low season, marks the market's lowest point. In this month, revenue might dip to $1,320, occupancy could drop to 27.1%, and ADRs may adjust down to $142.
- Understanding both the seasonal averages and these monthly peaks and troughs in revenue, occupancy, and ADR is crucial for maximizing your Airbnb profit potential in Dallas.
Seasonal Strategies for Maximizing Profit
- Peak Season: Maximize revenue through premium pricing and potentially longer minimum stays. Ensure high availability.
- Low Season: Offer competitive pricing, special promotions (e.g., extended stay discounts), and flexible cancellation policies. Target off-season travelers like remote workers or budget-conscious guests.
- Shoulder Seasons: Implement dynamic pricing that balances peak and low rates. Target weekend travelers or specific events. Offer slightly more flexible terms than peak season.
- Regularly analyze your own performance against these Dallas seasonality benchmarks and adjust your pricing and availability strategy accordingly.
Best Areas for Airbnb Investment in Dallas (2026)
Exploring the top neighborhoods for short-term rentals in Dallas? This section highlights key areas, outlining why they are attractive for hosts and guests, along with notable local attractions. Consider these locations based on your target guest profile and investment strategy.
| Neighborhood / Area | Why Host Here? (Target Guests & Appeal) | Key Attractions & Landmarks |
|---|---|---|
| Downtown Dallas | The bustling heart of the city, known for its business centers, nightlife, and cultural attractions. Ideal for both tourists and professionals visiting the area. | Dallas Museum of Art, Klyde Warren Park, Reunion Tower, The Sixth Floor Museum, Dallas World Aquarium |
| Bishop Arts District | A vibrant neighborhood known for its eclectic shops, art galleries, and restaurants. Popular with locals and visitors looking for a unique experience. | Bishop Arts Theatre, Eleanor Tinsley Park, Oak Cliff Coffee Roasters, Bishop Arts District shops and eateries |
| Deep Ellum | An arts and entertainment district famous for its live music scene and street art. Attracts young crowds and music lovers. | Deep Ellum Art Company, The Bomb Factory, Trees, Street murals, Fletcher’s Corny Dogs |
| North Dallas | A suburban area known for its family-friendly neighborhoods, shopping, and dining options. Appeals to families and business travelers alike. | Galleria Dallas, Preston Center, Valley View Center, Parks and recreational areas |
| Uptown Dallas | A trendy area with a vibrant social scene, restaurants, and shops. Attracts young professionals and those seeking an urban lifestyle. | Katy Trail, West Village, The Crescent, Uptown Park |
| Highland Park | An affluent neighborhood known for its luxury homes and boutiques. Popular for upscale travelers and long-term stays. | Highland Park Village, Dallas Country Club, Armstrong Park, Luxury shopping |
| West End Historic District | A historic area with cobblestone streets filled with shops, restaurants, and attractions. Great for tourists exploring Dallas's history. | The Dallas Holocaust and Human Rights Museum, Dealey Plaza, West End Marketplace, The Sixth Floor Museum |
| Fair Park | Famous for the State Fair of Texas and various museums. Appeals to visitors during the fair and families looking for educational activities. | Fair Park, Dallas World Aquarium, Texas Discovery Gardens, Museum of Nature & Science |
Understanding Airbnb License Requirements & STR Laws in Dallas (2026)
While Dallas, Georgia, United States currently shows low STR regulations, specific Airbnb license requirements might still exist or change. Always verify the latest short term rental regulations and Airbnb license requirements directly with local government authorities for Dallas to ensure full compliance before hosting.
(Source: AirROI data, 2026, finding no licensed listings among those analyzed)
Top Performing Airbnb Properties in Dallas (2026)
Benchmark your potential! Explore examples of top-performing Airbnb properties in Dallasbased on Trailing Twelve Month (TTM) revenue. Analyze their characteristics, revenue, occupancy rate, and ADR to understand what drives success in this market.
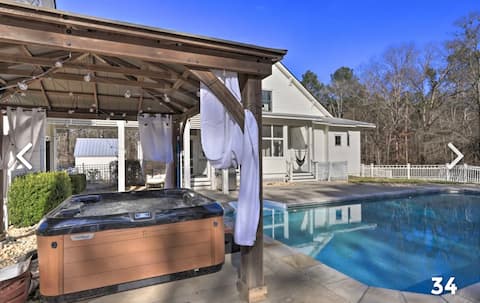
Luxury Farmhouse * Pool * Hot Tub* Fire Pit
Entire Place • 5 bedrooms
Spacious Spanish-style Ranch Convenient to ATL
Entire Place • 5 bedrooms
Delta B Lodge- a rustic retreat on 10 acres
Entire Place • 5 bedrooms

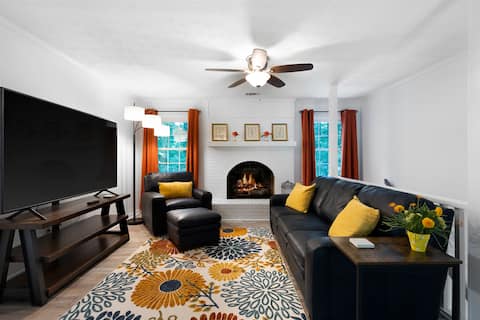
Family Home
Entire Place • 6 bedrooms

Premium Luxury Group Getaway
Entire Place • 5 bedrooms

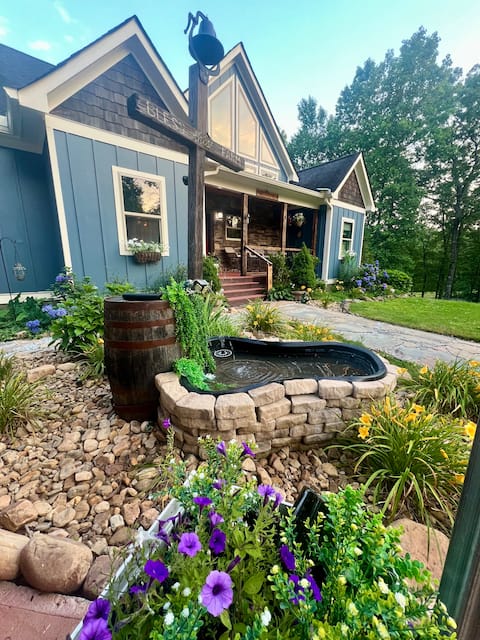
"Zen Country Wellness Retreat: 5BR by Gigi Nicole"
Entire Place • 5 bedrooms
Note: Performance varies based on location, size, amenities, seasonality, and management quality. Data reflects the past 12 months.
Top Performing Airbnb Hosts in Dallas (2026)
Learn from the best! This table showcases top-performing Airbnb hosts in Dallas based on the number of properties managed and estimated total revenue over the past year. Analyze their scale and performance metrics.
| Host Name | Properties | Grossing Revenue | Stay Reviews | Avg Rating |
|---|---|---|---|---|
| Stephanie | 5 | $167,989 | 173 | 4.98/5.0 |
| Amber | 1 | $83,306 | 88 | 4.98/5.0 |
| Shine | 3 | $78,012 | 173 | 4.67/5.0 |
| Callie | 1 | $77,005 | 24 | 4.92/5.0 |
| Hugues | 1 | $71,141 | 28 | 4.68/5.0 |
| Erik | 2 | $57,711 | 46 | 4.89/5.0 |
| Gigi Nicole | 1 | $48,761 | 141 | 4.85/5.0 |
| Wendy | 1 | $43,725 | 75 | 5.00/5.0 |
| Sean | 1 | $38,638 | 169 | 4.78/5.0 |
| Jason | 1 | $36,989 | 59 | 4.98/5.0 |
Analyzing the strategies of top hosts, such as their property selection, pricing, and guest communication, can offer valuable lessons for optimizing your own Airbnb operations in Dallas.
Dive Deeper: Advanced Dallas STR Market Data (2026)
Ready to unlock more insights? AirROI provides access to advanced metrics and comprehensive Airbnb data for Dallas. Explore detailed analytics beyond this report to refine your investment strategy, optimize pricing, and maximize your vacation rental profits.
Explore Advanced MetricsDallas Short-Term Rental Market Composition (2026): Property & Room Types
Room Type Distribution
Property Type Distribution
Market Composition Insights for Dallas
- The Dallas Airbnb market composition is heavily skewed towards Entire Home/Apt listings, which make up 61.9% of the 63 active rentals. This indicates strong guest preference for privacy and space.
- However, a notable 38.1% share for Private Rooms suggests opportunities for budget-conscious travelers or hosts renting out spare rooms.
- Looking at the property type distribution in Dallas, House properties are the most common (79.4%), reflecting the local real estate landscape.
- Houses represent a significant 79.4% portion, catering likely to families or larger groups.
- Smaller segments like apartment/condo, hotel/boutique (combined 4.8%) offer potential for unique stay experiences.
Dallas Airbnb Room Capacity Analysis (2026): Bedroom Distribution
Distribution of Listings by Number of Bedrooms
Room Capacity Insights for Dallas
- The dominant room capacity in Dallas is 2 bedrooms listings, making up 17.5% of the market. This suggests a strong demand for properties suitable for couples or solo travelers.
- Together, 2 bedrooms and 3 bedrooms properties represent 33.4% of the active Airbnb listings in Dallas, indicating a high concentration in these sizes.
- A significant 34.9% of listings offer 3+ bedrooms, catering to larger groups and families seeking more space in Dallas.
Dallas Vacation Rental Guest Capacity Trends (2026)
Distribution of Listings by Guest Capacity
Guest Capacity Insights for Dallas
- The most common guest capacity trend in Dallas vacation rentals is listings accommodating 8+ guests (22.2%). This suggests the primary traveler segment is likely larger groups.
- Properties designed for 8+ guests and 4 guests dominate the Dallas STR market, accounting for 38.1% of listings.
- 39.6% of properties accommodate 6+ guests, serving the market segment for larger families or group travel in Dallas.
- On average, properties in Dallas are equipped to host 3.7 guests.
Dallas Airbnb Booking Patterns (2026): Available vs. Booked Days
Available Days Distribution
Booked Days Distribution
Booking Pattern Insights for Dallas
- The most common availability pattern in Dallas falls within the 271-366 days range, representing 47.6% of listings. This suggests many properties have significant open periods on their calendars.
- Approximately 87.3% of listings show high availability (181+ days open annually), indicating potential for increased bookings or specific owner usage patterns.
- For booked days, the 91-180 days range is most frequent in Dallas (42.9%), reflecting common guest stay durations or potential owner blocking patterns.
- A notable 12.7% of properties secure long booking periods (181+ days booked per year), highlighting successful long-term rental strategies or significant owner usage.
Dallas Airbnb Minimum Stay Requirements Analysis
Distribution of Listings by Minimum Night Requirement
1 Night
26 listings
41.3% of total
2 Nights
22 listings
34.9% of total
3 Nights
2 listings
3.2% of total
4-6 Nights
2 listings
3.2% of total
30+ Nights
11 listings
17.5% of total
Key Insights
- The most prevalent minimum stay requirement in Dallas is 1 Night, adopted by 41.3% of listings. This highlights the market's preference for shorter, flexible bookings.
- A strong majority (76.2%) of the Dallas Airbnb data shows acceptance of very short stays (1-2 nights), indicating a dynamic, high-turnover market.
- A significant segment (17.5%) caters to monthly stays (30+ nights) in Dallas, pointing to opportunities in the extended-stay market.
Recommendations
- Align with the market by considering a 1 Night minimum stay, as 41.3% of Dallas hosts use this setting.
- Explore offering discounts for stays of 30+ nights to attract the 17.5% of the market seeking extended stays.
- Adjust minimum nights based on seasonality – potentially shorter during low season and longer during peak demand periods in Dallas.
Dallas Airbnb Cancellation Policy Trends Analysis (2026)
Limited
1 listings
1.6% of total
Flexible
30 listings
48.4% of total
Moderate
20 listings
32.3% of total
Firm
11 listings
17.7% of total
Cancellation Policy Insights for Dallas
- The prevailing Airbnb cancellation policy trend in Dallas is Flexible, used by 48.4% of listings.
- The market strongly favors guest-friendly terms, with 80.7% of listings offering Flexible or Moderate policies. This suggests guests in Dallas may expect booking flexibility.
Recommendations for Hosts
- Consider adopting a Flexible policy to align with the 48.4% market standard in Dallas.
- Regularly review your cancellation policy against competitors and market demand shifts in Dallas.
Dallas STR Booking Lead Time Analysis (2026)
Average Booking Lead Time by Month
Booking Lead Time Insights for Dallas
- The overall average booking lead time for vacation rentals in Dallas is 30 days.
- Guests book furthest in advance for stays during November (average 56 days), likely coinciding with peak travel demand or local events.
- The shortest booking windows occur for stays in March (average 14 days), indicating more last-minute travel plans during this time.
- Seasonally, Fall (44 days avg.) sees the longest lead times, while Winter (23 days avg.) has the shortest, reflecting typical travel planning cycles.
Recommendations for Hosts
- Use the overall average lead time (30 days) as a baseline for your pricing and availability strategy in Dallas.
- For November stays, consider implementing length-of-stay discounts or slightly higher rates for bookings made less than 56 days out to capitalize on advance planning.
- During March, focus on last-minute booking availability and promotions, as guests book with very short notice (14 days avg.).
- Target marketing efforts for the Fall season well in advance (at least 44 days) to capture early planners.
- Monitor your own booking lead times against these Dallas averages to identify opportunities for dynamic pricing adjustments.
Popular & Essential Airbnb Amenities in Dallas (2026)
Amenity Prevalence
Amenity Insights for Dallas
- Essential amenities in Dallas that guests expect include: Wifi, Air conditioning, TV, Free parking on premises, Smoke alarm. Lacking these (any) could significantly impact bookings.
- Popular amenities like Kitchen, Heating, Washer are common but not universal. Offering these can provide a competitive edge.
Recommendations for Hosts
- Ensure your listing includes all essential amenities for Dallas: Wifi, Air conditioning, TV, Free parking on premises, Smoke alarm.
- Prioritize adding missing essentials: Wifi, Air conditioning, TV, Free parking on premises, Smoke alarm.
- Consider adding popular differentiators like Kitchen or Heating to increase appeal.
- Highlight unique or less common amenities you offer (e.g., hot tub, dedicated workspace, EV charger) in your listing description and photos.
- Regularly check competitor amenities in Dallas to stay competitive.
Dallas Airbnb Guest Demographics & Profile Analysis (2026)
Guest Profile Summary for Dallas
- The typical guest profile for Airbnb in Dallas consists of primarily domestic travelers (98%), often arriving from nearby Atlanta, typically belonging to the Post-2000s (Gen Z/Alpha) group (50%), primarily speaking English or Spanish.
- Domestic travelers account for 98.2% of guests.
- Key international markets include United States (98.2%) and Costa Rica (0.4%).
- Top languages spoken are English (83.2%) followed by Spanish (10.2%).
- A significant demographic segment is the Post-2000s (Gen Z/Alpha) group, representing 50% of guests.
Recommendations for Hosts
- Target domestic marketing efforts towards travelers from Atlanta and Wetumpka.
- Tailor amenities and listing descriptions to appeal to the dominant Post-2000s (Gen Z/Alpha) demographic (e.g., highlight fast WiFi, smart home features, local guides).
- Highlight unique local experiences or amenities relevant to the primary guest profile.
- Consider seasonal promotions aligned with peak travel times for key origin markets.
Nearby Short-Term Rental Market Comparison
How does the Dallas Airbnb market stack up against its neighbors? Compare key performance metrics like average monthly revenue, ADR, and occupancy rates in surrounding areas to understand the broader regional STR landscape.
| Market | Active Properties | Monthly Revenue | Daily Rate | Avg. Occupancy |
|---|---|---|---|---|
| Bogart | 13 | $5,528 | $637.81 | 35% |
| Gilmer County | 26 | $5,298 | $459.59 | 40% |
| Fannin County | 42 | $4,574 | $435.93 | 38% |
| East Ellijay | 15 | $4,415 | $368.05 | 41% |
| Epworth | 79 | $4,411 | $406.97 | 40% |
| Commerce | 19 | $4,298 | $285.34 | 45% |
| Jacksons' Gap | 45 | $4,249 | $467.96 | 37% |
| Eatonton | 236 | $4,178 | $502.80 | 33% |
| Sautee | 14 | $4,105 | $408.17 | 39% |
| Waleska | 45 | $4,041 | $373.64 | 42% |