Conyers Airbnb Market Analysis 2026: Short Term Rental Data & Vacation Rental Statistics in Georgia, United States
Is Airbnb profitable in Conyers in 2026? Explore comprehensive Airbnb analytics for Conyers, Georgia, United States to uncover income potential. This 2026 STR market report for Conyers, based on AirROI data from February 2025 to January 2026, reveals key trends in the niche market of 112 active listings.
Whether you're considering an Airbnb investment in Conyers, optimizing your existing vacation rental, or exploring rental arbitrage opportunities, understanding the Conyers Airbnb data is crucial. Leveraging the low regulation environment is key to maximizing your short term rental income potential. Let's dive into the specifics.
Key Conyers Airbnb Performance Metrics Overview
Monthly Airbnb Revenue Variations & Income Potential in Conyers (2026)
Understanding the monthly revenue variations for Airbnb listings in Conyers is key to maximizing your short term rental income potential. Seasonality significantly impacts earnings. Our analysis, based on data from the past 12 months, shows that the peak revenue month for STRs in Conyers is typically July, while February often presents the lowest earnings, highlighting opportunities for strategic pricing adjustments during shoulder and low seasons. Explore the typical Airbnb income in Conyers across different performance tiers:
- Best-in-class properties (Top 10%) achieve $6,111+ monthly, often utilizing dynamic pricing and superior guest experiences.
- Strong performing properties (Top 25%) earn $3,742 or more, indicating effective management and desirable locations/amenities.
- Typical properties (Median) generate around $1,830 per month, representing the average market performance.
- Entry-level properties (Bottom 25%) see earnings around $856, often with potential for optimization.
Average Monthly Airbnb Earnings Trend in Conyers
Conyers Airbnb Occupancy Rate Trends (2026)
Maximize your bookings by understanding the Conyers STR occupancy trends. Seasonal demand shifts significantly influence how often properties are booked. Typically, Junesees the highest demand (peak season occupancy), while September experiences the lowest (low season). Effective strategies, like adjusting minimum stays or offering promotions, can boost occupancy during slower periods. Here's how different property tiers perform in Conyers:
- Best-in-class properties (Top 10%) achieve 78%+ occupancy, indicating high desirability and potentially optimized availability.
- Strong performing properties (Top 25%) maintain 57% or higher occupancy, suggesting good market fit and guest satisfaction.
- Typical properties (Median) have an occupancy rate around 34%.
- Entry-level properties (Bottom 25%) average 18% occupancy, potentially facing higher vacancy.
Average Monthly Occupancy Rate Trend in Conyers
Average Daily Rate (ADR) Airbnb Trends in Conyers (2026)
Effective short term rental pricing strategy in Conyers involves understanding monthly ADR fluctuations. The Average Daily Rate (ADR) for Airbnb in Conyers typically peaks in December and dips lowest during February. Leveraging Airbnb dynamic pricing tools or strategies based on this seasonality can significantly boost revenue. Here's a look at the typical nightly rates achieved:
- Best-in-class properties (Top 10%) command rates of $382+ per night, often due to premium features or locations.
- Strong performing properties (Top 25%) achieve nightly rates of $212 or more.
- Typical properties (Median) charge around $137 per night.
- Entry-level properties (Bottom 25%) earn around $84 per night.
Average Daily Rate (ADR) Trend by Month in Conyers
Get Live Conyers Market Intelligence 👇

Explore Real-time Analytics
Airbnb Seasonality Analysis & Trends in Conyers (2026)
Peak Season (July, June, August)
- Revenue averages $3,309 per month
- Occupancy rates average 43.7%
- Daily rates average $183
Shoulder Season
- Revenue averages $2,761 per month
- Occupancy maintains around 38.1%
- Daily rates hold near $195
Low Season (February, March, September)
- Revenue drops to average $2,131 per month
- Occupancy decreases to average 35.9%
- Daily rates adjust to average $180
Seasonality Insights for Conyers
- The Airbnb seasonality in Conyers shows moderate seasonality with distinct peak and low periods. While the sections above show seasonal averages, it's also insightful to look at the extremes:
- During the high season, the absolute peak month showcases Conyers's highest earning potential, with monthly revenues capable of climbing to $3,431, occupancy reaching a high of 45.0%, and ADRs peaking at $209.
- Conversely, the slowest single month of the year, typically falling within the low season, marks the market's lowest point. In this month, revenue might dip to $1,901, occupancy could drop to 30.6%, and ADRs may adjust down to $165.
- Understanding both the seasonal averages and these monthly peaks and troughs in revenue, occupancy, and ADR is crucial for maximizing your Airbnb profit potential in Conyers.
Seasonal Strategies for Maximizing Profit
- Peak Season: Maximize revenue through premium pricing and potentially longer minimum stays. Ensure high availability.
- Low Season: Offer competitive pricing, special promotions (e.g., extended stay discounts), and flexible cancellation policies. Target off-season travelers like remote workers or budget-conscious guests.
- Shoulder Seasons: Implement dynamic pricing that balances peak and low rates. Target weekend travelers or specific events. Offer slightly more flexible terms than peak season.
- Regularly analyze your own performance against these Conyers seasonality benchmarks and adjust your pricing and availability strategy accordingly.
Best Areas for Airbnb Investment in Conyers (2026)
Exploring the top neighborhoods for short-term rentals in Conyers? This section highlights key areas, outlining why they are attractive for hosts and guests, along with notable local attractions. Consider these locations based on your target guest profile and investment strategy.
| Neighborhood / Area | Why Host Here? (Target Guests & Appeal) | Key Attractions & Landmarks |
|---|---|---|
| Old Town Conyers | Historic district with charming shops, eateries, and a vibrant arts scene. It's a popular location for visitors looking to explore Conyers’ history and culture. | Portable Art Gallery, Conyers Historic Cemetery, Olde Town Park, Conyers Welcome Center |
| Monastery of the Holy Spirit | A serene and spiritual retreat offering a unique Airbnb experience. Visitors come for tranquility and nature, making it ideal for those seeking peace away from urban life. | Monastery Gardens, Scenic hiking trails, Gift shop and café |
| Georgia International Horse Park | A premier venue for horse-related events and conventions, it attracts many equestrian enthusiasts and hosts various events throughout the year. | Horse Park Events, Museum of the Horse, Equestrian facilities |
| Lithonia | Close to Conyers, this area offers a suburban feel with shopping, parks, and a family-friendly environment that's appealing to visitors and residents. | Stonecrest Mall, Arabia Mountain, Panola Mountain State Park |
| Havana Hills | A picturesque suburban community with great local dining and close access to parks, making it attractive for families and nature lovers. | Havana Hills Park, Nearby trails, Local dining options |
| Salem Church Road | A growing area with new developments, ideal for travelers looking for modern accommodations while still being close to nature and outdoor activities. | Parks and Recreation, Hiking trails, Community events |
| Rockdale River Trail | Offers a scenic and recreational experience for outdoor enthusiasts, making it an attractive spot for visitors looking to explore local nature. | Walking and biking trails, Fishing spots, Scenic views |
| Downtown Conyers | The heartbeat of Conyers with a mix of local shops, restaurants, and community events. It's an attractive area for those wanting to experience local culture. | Local farmers market, Arts and events center, Unique shops and cafés |
Understanding Airbnb License Requirements & STR Laws in Conyers (2026)
While Conyers, Georgia, United States currently shows low STR regulations, specific Airbnb license requirements might still exist or change. Always verify the latest short term rental regulations and Airbnb license requirements directly with local government authorities for Conyers to ensure full compliance before hosting.
(Source: AirROI data, 2026, finding no licensed listings among those analyzed)
Top Performing Airbnb Properties in Conyers (2026)
Benchmark your potential! Explore examples of top-performing Airbnb properties in Conyersbased on Trailing Twelve Month (TTM) revenue. Analyze their characteristics, revenue, occupancy rate, and ADR to understand what drives success in this market.
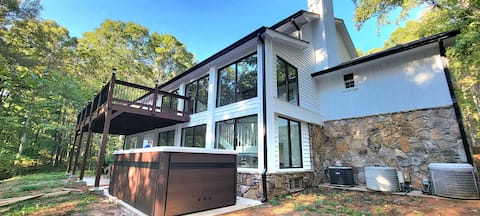
The Villa - 5 Bdrm on 28 acres w/ barn & swim spa
Entire Place • 5 bedrooms

Villa Encanto-Lakefront-Pool/Spa. Near Atlanta
Entire Place • 6 bedrooms

Atlanta 4500 Sq. ft. 9 Private Bedrooms 15 Beds
Entire Place • 9 bedrooms
GREAT DEAL-Cabin w/Lake, Fire Pit, Trails, & Pool
Entire Place • 3 bedrooms
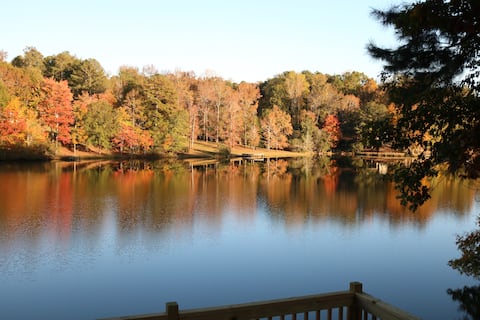
**PICTURE Perfect Lake-Front Getaway
Entire Place • 5 bedrooms
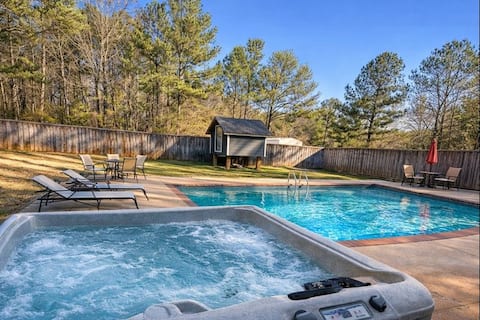
POOL / Hot Tub/ Pet Friendly / Sleeps 10
Entire Place • 4 bedrooms
Note: Performance varies based on location, size, amenities, seasonality, and management quality. Data reflects the past 12 months.
Top Performing Airbnb Hosts in Conyers (2026)
Learn from the best! This table showcases top-performing Airbnb hosts in Conyers based on the number of properties managed and estimated total revenue over the past year. Analyze their scale and performance metrics.
| Host Name | Properties | Grossing Revenue | Stay Reviews | Avg Rating |
|---|---|---|---|---|
| Dayana | 3 | $150,593 | 207 | 4.47/5.0 |
| Dasi | 2 | $148,433 | 202 | 4.78/5.0 |
| Alina | 1 | $139,349 | 37 | 4.97/5.0 |
| Dana | 4 | $133,819 | 221 | 4.58/5.0 |
| Jorge | 1 | $121,874 | 73 | 4.97/5.0 |
| Andre | 1 | $114,036 | 70 | 4.90/5.0 |
| Timothy | 1 | $102,484 | 13 | 5.00/5.0 |
| Sara B | 7 | $81,769 | 722 | 4.47/5.0 |
| Lisa | 1 | $78,991 | 91 | 4.70/5.0 |
| Kendra | 1 | $74,926 | 167 | 4.97/5.0 |
Analyzing the strategies of top hosts, such as their property selection, pricing, and guest communication, can offer valuable lessons for optimizing your own Airbnb operations in Conyers.
Dive Deeper: Advanced Conyers STR Market Data (2026)
Ready to unlock more insights? AirROI provides access to advanced metrics and comprehensive Airbnb data for Conyers. Explore detailed analytics beyond this report to refine your investment strategy, optimize pricing, and maximize your vacation rental profits.
Explore Advanced MetricsConyers Short-Term Rental Market Composition (2026): Property & Room Types
Room Type Distribution
Property Type Distribution
Market Composition Insights for Conyers
- The Conyers Airbnb market composition is heavily skewed towards Entire Home/Apt listings, which make up 87.5% of the 112 active rentals. This indicates strong guest preference for privacy and space.
- Looking at the property type distribution in Conyers, House properties are the most common (68.8%), reflecting the local real estate landscape.
- Houses represent a significant 68.8% portion, catering likely to families or larger groups.
- Smaller segments like hotel/boutique, unique stays (combined 5.4%) offer potential for unique stay experiences.
Conyers Airbnb Room Capacity Analysis (2026): Bedroom Distribution
Distribution of Listings by Number of Bedrooms
Room Capacity Insights for Conyers
- The dominant room capacity in Conyers is 2 bedrooms listings, making up 25.9% of the market. This suggests a strong demand for properties suitable for couples or solo travelers.
- Together, 2 bedrooms and 3 bedrooms properties represent 46.4% of the active Airbnb listings in Conyers, indicating a high concentration in these sizes.
- A significant 41.9% of listings offer 3+ bedrooms, catering to larger groups and families seeking more space in Conyers.
Conyers Vacation Rental Guest Capacity Trends (2026)
Distribution of Listings by Guest Capacity
Guest Capacity Insights for Conyers
- The most common guest capacity trend in Conyers vacation rentals is listings accommodating 8+ guests (23.2%). This suggests the primary traveler segment is likely larger groups.
- Properties designed for 8+ guests and 6 guests dominate the Conyers STR market, accounting for 42.0% of listings.
- 43.8% of properties accommodate 6+ guests, serving the market segment for larger families or group travel in Conyers.
- On average, properties in Conyers are equipped to host 4.7 guests.
Conyers Airbnb Booking Patterns (2026): Available vs. Booked Days
Available Days Distribution
Booked Days Distribution
Booking Pattern Insights for Conyers
- The most common availability pattern in Conyers falls within the 271-366 days range, representing 54.5% of listings. This suggests many properties have significant open periods on their calendars.
- Approximately 82.2% of listings show high availability (181+ days open annually), indicating potential for increased bookings or specific owner usage patterns.
- For booked days, the 31-90 days range is most frequent in Conyers (37.5%), reflecting common guest stay durations or potential owner blocking patterns.
- A notable 18.7% of properties secure long booking periods (181+ days booked per year), highlighting successful long-term rental strategies or significant owner usage.
Conyers Airbnb Minimum Stay Requirements Analysis
Distribution of Listings by Minimum Night Requirement
1 Night
18 listings
16.1% of total
2 Nights
47 listings
42% of total
3 Nights
7 listings
6.3% of total
4-6 Nights
4 listings
3.6% of total
7-29 Nights
6 listings
5.4% of total
30+ Nights
30 listings
26.8% of total
Key Insights
- The most prevalent minimum stay requirement in Conyers is 2 Nights, adopted by 42% of listings. This highlights the market's preference for shorter, flexible bookings.
- A significant segment (26.8%) caters to monthly stays (30+ nights) in Conyers, pointing to opportunities in the extended-stay market.
Recommendations
- Align with the market by considering a 2 Nights minimum stay, as 42% of Conyers hosts use this setting.
- If feasible, allowing 1-night stays, especially midweek or during low season, could capture last-minute bookings, as only 16.1% currently do.
- A 2-night minimum appears standard (42%). Consider this for weekends or peak periods.
- Explore offering discounts for stays of 30+ nights to attract the 26.8% of the market seeking extended stays.
- Adjust minimum nights based on seasonality – potentially shorter during low season and longer during peak demand periods in Conyers.
Conyers Airbnb Cancellation Policy Trends Analysis (2026)
Limited
3 listings
2.7% of total
Flexible
24 listings
21.4% of total
Moderate
33 listings
29.5% of total
Firm
41 listings
36.6% of total
Strict
11 listings
9.8% of total
Cancellation Policy Insights for Conyers
- The prevailing Airbnb cancellation policy trend in Conyers is Firm, used by 36.6% of listings.
- There's a relatively balanced mix between guest-friendly (50.9%) and stricter (46.4%) policies, offering choices for different guest needs.
- Strict cancellation policies are quite rare (9.8%), potentially making listings with this policy less competitive unless justified by high demand or property type.
Recommendations for Hosts
- Consider adopting a Firm policy to align with the 36.6% market standard in Conyers.
- Using a Strict policy might deter some guests, as only 9.8% of listings use it. Evaluate if potential revenue protection outweighs possible lower booking rates.
- Regularly review your cancellation policy against competitors and market demand shifts in Conyers.
Conyers STR Booking Lead Time Analysis (2026)
Average Booking Lead Time by Month
Booking Lead Time Insights for Conyers
- The overall average booking lead time for vacation rentals in Conyers is 25 days.
- Guests book furthest in advance for stays during November (average 41 days), likely coinciding with peak travel demand or local events.
- The shortest booking windows occur for stays in February (average 11 days), indicating more last-minute travel plans during this time.
- Seasonally, Summer (32 days avg.) sees the longest lead times, while Winter (15 days avg.) has the shortest, reflecting typical travel planning cycles.
Recommendations for Hosts
- Use the overall average lead time (25 days) as a baseline for your pricing and availability strategy in Conyers.
- For November stays, consider implementing length-of-stay discounts or slightly higher rates for bookings made less than 41 days out to capitalize on advance planning.
- During February, focus on last-minute booking availability and promotions, as guests book with very short notice (11 days avg.).
- Target marketing efforts for the Summer season well in advance (at least 32 days) to capture early planners.
- Monitor your own booking lead times against these Conyers averages to identify opportunities for dynamic pricing adjustments.
Popular & Essential Airbnb Amenities in Conyers (2026)
Amenity Prevalence
Amenity Insights for Conyers
- Essential amenities in Conyers that guests expect include: Free parking on premises, Air conditioning, Wifi, TV. Lacking these (any) could significantly impact bookings.
- Popular amenities like Smoke alarm, Hot water, Heating are common but not universal. Offering these can provide a competitive edge.
Recommendations for Hosts
- Ensure your listing includes all essential amenities for Conyers: Free parking on premises, Air conditioning, Wifi, TV.
- Prioritize adding missing essentials: Free parking on premises, Air conditioning, Wifi, TV.
- Consider adding popular differentiators like Smoke alarm or Hot water to increase appeal.
- Highlight unique or less common amenities you offer (e.g., hot tub, dedicated workspace, EV charger) in your listing description and photos.
- Regularly check competitor amenities in Conyers to stay competitive.
Conyers Airbnb Guest Demographics & Profile Analysis (2026)
Guest Profile Summary for Conyers
- The typical guest profile for Airbnb in Conyers consists of primarily domestic travelers (97%), often arriving from nearby Atlanta, typically belonging to the Post-2000s (Gen Z/Alpha) group (50%), primarily speaking English or Spanish.
- Domestic travelers account for 96.7% of guests.
- Key international markets include United States (96.7%) and Canada (0.7%).
- Top languages spoken are English (80.8%) followed by Spanish (9.6%).
- A significant demographic segment is the Post-2000s (Gen Z/Alpha) group, representing 50% of guests.
Recommendations for Hosts
- Target domestic marketing efforts towards travelers from Atlanta and Covington.
- Tailor amenities and listing descriptions to appeal to the dominant Post-2000s (Gen Z/Alpha) demographic (e.g., highlight fast WiFi, smart home features, local guides).
- Highlight unique local experiences or amenities relevant to the primary guest profile.
- Consider seasonal promotions aligned with peak travel times for key origin markets.
Nearby Short-Term Rental Market Comparison
How does the Conyers Airbnb market stack up against its neighbors? Compare key performance metrics like average monthly revenue, ADR, and occupancy rates in surrounding areas to understand the broader regional STR landscape.
| Market | Active Properties | Monthly Revenue | Daily Rate | Avg. Occupancy |
|---|---|---|---|---|
| Bogart | 13 | $5,528 | $637.81 | 35% |
| Gilmer County | 26 | $5,298 | $459.59 | 40% |
| Fannin County | 42 | $4,574 | $435.93 | 38% |
| East Ellijay | 15 | $4,415 | $368.05 | 41% |
| Epworth | 79 | $4,411 | $406.97 | 40% |
| Commerce | 19 | $4,298 | $285.34 | 45% |
| Jacksons' Gap | 45 | $4,249 | $467.96 | 37% |
| Eatonton | 236 | $4,178 | $502.80 | 33% |
| Sautee | 14 | $4,105 | $408.17 | 39% |
| Waleska | 45 | $4,041 | $373.64 | 42% |