Cherry Log Airbnb Market Analysis 2026: Short Term Rental Data & Vacation Rental Statistics in Georgia, United States
Is Airbnb profitable in Cherry Log in 2026? Explore comprehensive Airbnb analytics for Cherry Log, Georgia, United States to uncover income potential. This 2026 STR market report for Cherry Log, based on AirROI data from February 2025 to January 2026, reveals key trends in the market of 248 active listings.
Whether you're considering an Airbnb investment in Cherry Log, optimizing your existing vacation rental, or exploring rental arbitrage opportunities, understanding the Cherry Log Airbnb data is crucial. Leveraging the low regulation environment is key to maximizing your short term rental income potential. Let's dive into the specifics.
Key Cherry Log Airbnb Performance Metrics Overview
Monthly Airbnb Revenue Variations & Income Potential in Cherry Log (2026)
Understanding the monthly revenue variations for Airbnb listings in Cherry Log is key to maximizing your short term rental income potential. Seasonality significantly impacts earnings. Our analysis, based on data from the past 12 months, shows that the peak revenue month for STRs in Cherry Log is typically October, while April often presents the lowest earnings, highlighting opportunities for strategic pricing adjustments during shoulder and low seasons. Explore the typical Airbnb income in Cherry Log across different performance tiers:
- Best-in-class properties (Top 10%) achieve $8,091+ monthly, often utilizing dynamic pricing and superior guest experiences.
- Strong performing properties (Top 25%) earn $5,276 or more, indicating effective management and desirable locations/amenities.
- Typical properties (Median) generate around $3,279 per month, representing the average market performance.
- Entry-level properties (Bottom 25%) see earnings around $1,998, often with potential for optimization.
Average Monthly Airbnb Earnings Trend in Cherry Log
Cherry Log Airbnb Occupancy Rate Trends (2026)
Maximize your bookings by understanding the Cherry Log STR occupancy trends. Seasonal demand shifts significantly influence how often properties are booked. Typically, Octobersees the highest demand (peak season occupancy), while January experiences the lowest (low season). Effective strategies, like adjusting minimum stays or offering promotions, can boost occupancy during slower periods. Here's how different property tiers perform in Cherry Log:
- Best-in-class properties (Top 10%) achieve 78%+ occupancy, indicating high desirability and potentially optimized availability.
- Strong performing properties (Top 25%) maintain 61% or higher occupancy, suggesting good market fit and guest satisfaction.
- Typical properties (Median) have an occupancy rate around 40%.
- Entry-level properties (Bottom 25%) average 24% occupancy, potentially facing higher vacancy.
Average Monthly Occupancy Rate Trend in Cherry Log
Average Daily Rate (ADR) Airbnb Trends in Cherry Log (2026)
Effective short term rental pricing strategy in Cherry Log involves understanding monthly ADR fluctuations. The Average Daily Rate (ADR) for Airbnb in Cherry Log typically peaks in December and dips lowest during April. Leveraging Airbnb dynamic pricing tools or strategies based on this seasonality can significantly boost revenue. Here's a look at the typical nightly rates achieved:
- Best-in-class properties (Top 10%) command rates of $514+ per night, often due to premium features or locations.
- Strong performing properties (Top 25%) achieve nightly rates of $360 or more.
- Typical properties (Median) charge around $270 per night.
- Entry-level properties (Bottom 25%) earn around $210 per night.
Average Daily Rate (ADR) Trend by Month in Cherry Log
Get Live Cherry Log Market Intelligence 👇

Explore Real-time Analytics
Airbnb Seasonality Analysis & Trends in Cherry Log (2026)
Peak Season (October, November, December)
- Revenue averages $5,994 per month
- Occupancy rates average 51.7%
- Daily rates average $378
Shoulder Season
- Revenue averages $3,912 per month
- Occupancy maintains around 40.9%
- Daily rates hold near $304
Low Season (February, April, May)
- Revenue drops to average $2,872 per month
- Occupancy decreases to average 37.9%
- Daily rates adjust to average $263
Seasonality Insights for Cherry Log
- The Airbnb seasonality in Cherry Log shows highly seasonal trends requiring careful strategy. While the sections above show seasonal averages, it's also insightful to look at the extremes:
- During the high season, the absolute peak month showcases Cherry Log's highest earning potential, with monthly revenues capable of climbing to $6,295, occupancy reaching a high of 56.0%, and ADRs peaking at $390.
- Conversely, the slowest single month of the year, typically falling within the low season, marks the market's lowest point. In this month, revenue might dip to $2,787, occupancy could drop to 32.0%, and ADRs may adjust down to $254.
- Understanding both the seasonal averages and these monthly peaks and troughs in revenue, occupancy, and ADR is crucial for maximizing your Airbnb profit potential in Cherry Log.
Seasonal Strategies for Maximizing Profit
- Peak Season: Maximize revenue through premium pricing and potentially longer minimum stays. Ensure high availability.
- Low Season: Offer competitive pricing, special promotions (e.g., extended stay discounts), and flexible cancellation policies. Target off-season travelers like remote workers or budget-conscious guests.
- Shoulder Seasons: Implement dynamic pricing that balances peak and low rates. Target weekend travelers or specific events. Offer slightly more flexible terms than peak season.
- Regularly analyze your own performance against these Cherry Log seasonality benchmarks and adjust your pricing and availability strategy accordingly.
Best Areas for Airbnb Investment in Cherry Log (2026)
Exploring the top neighborhoods for short-term rentals in Cherry Log? This section highlights key areas, outlining why they are attractive for hosts and guests, along with notable local attractions. Consider these locations based on your target guest profile and investment strategy.
| Neighborhood / Area | Why Host Here? (Target Guests & Appeal) | Key Attractions & Landmarks |
|---|---|---|
| Blue Ridge | A charming mountain town known for its scenic views, outdoor activities, and arts culture. Perfect for those seeking a peaceful getaway with access to nature. | Blue Ridge Scenic Railway, Lake Blue Ridge, Aska Trails, Mercier Orchards, Downtown Blue Ridge |
| Ellijay | Famous for its apple orchards and outdoor activities. A great location for families and those looking to enjoy fall festivals and apple picking. | Apple orchards, Amicalola Falls State Park, CARTECAY RIVER, Downtown Ellijay, Ellijay River |
| Hiawassee | Nestled by Lake Chatuge with stunning mountain views, this area attracts visitors for water sports, hiking, and relaxation. | Lake Chatuge, Brasstown Bald, Hiawassee River, Bell Mountain, Chatuge Gale Park |
| Dahlonega | Known for its historic gold rush, Dahlonega offers rich history and beautiful vineyards. It attracts wine lovers and history buffs alike. | Dahlonega Gold Museum, Consolidated Gold Mine, Wolf Mountain Vineyard & Winery, Hiking trails, Historic downtown |
| Jasper | A relaxed small town in the foothills of the Blue Ridge Mountains. Offers access to the natural beauty of the area and a quieter pace. | Pickens County Chamber of Commerce, Tate House Museum, Amicalola Falls State Park, Downtown Jasper |
| Blairsville | Gateway to the Chattahoochee National Forest, known for its hiking trails and beautiful Lake Nottely. A favorite for outdoor enthusiasts. | Lake Nottely, Blood Mountain, Vogel State Park, Union County Farmers Market, Downtown Blairsville |
| Chatsworth | Rich in Cherokee history and surrounded by the beauty of the North Georgia mountains. A lesser-known area that's gaining popularity. | Fort Mountain State Park, Chatsworth Depot, Cohutta Wilderness, DownTown Chatsworth |
| Suches | A hidden gem known for its scenic beauty and outdoor activities such as hiking and fishing. Ideal for those seeking tranquility away from the hustle. | Wolfpen Gap, Lake Winfield Scott, Benton McKaye Trail, Suches Community Center |
Understanding Airbnb License Requirements & STR Laws in Cherry Log (2026)
While Cherry Log, Georgia, United States currently shows low STR regulations, specific Airbnb license requirements might still exist or change. Always verify the latest short term rental regulations and Airbnb license requirements directly with local government authorities for Cherry Log to ensure full compliance before hosting.
(Source: AirROI data, 2026, finding no licensed listings among those analyzed)
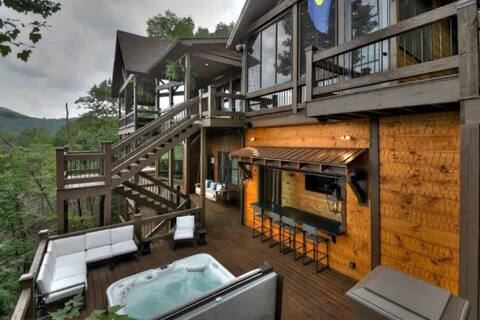
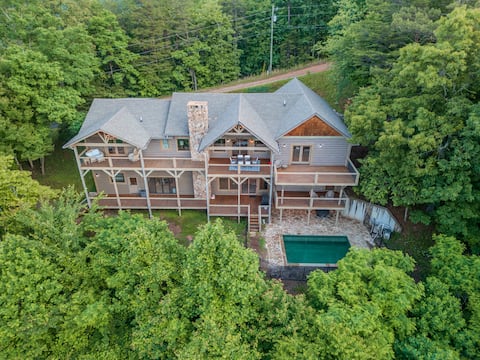
Top Performing Airbnb Properties in Cherry Log (2026)
Benchmark your potential! Explore examples of top-performing Airbnb properties in Cherry Logbased on Trailing Twelve Month (TTM) revenue. Analyze their characteristics, revenue, occupancy rate, and ADR to understand what drives success in this market.
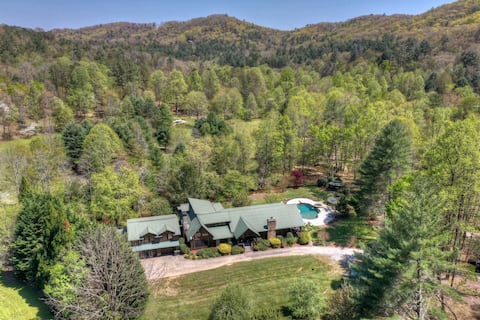
Stanley Creek Lodge - Pool home in Aska Adventure
Private Room • 6 bedrooms
Luxury Looks | Free Night Offer!
Entire Place • 5 bedrooms
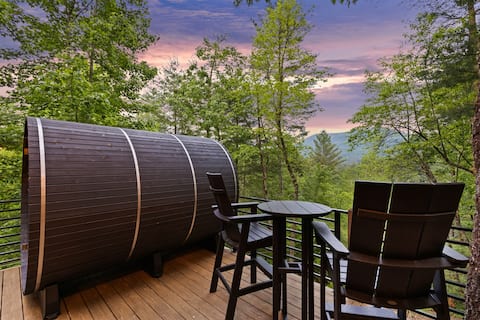
Amazing Luxury Treehouse! New Sauna! Kid's utopia! P
Entire Place • 3 bedrooms
Heated pool, hot tub, fire pit l Majestic views
Entire Place • 5 bedrooms
A Stoney River - Cherry Log, GA - Goose Island
Entire Place • 6 bedrooms
Escape to Elegance w/ Stunning Views, Games Galore
Entire Place • 4 bedrooms
Note: Performance varies based on location, size, amenities, seasonality, and management quality. Data reflects the past 12 months.
Top Performing Airbnb Hosts in Cherry Log (2026)
Learn from the best! This table showcases top-performing Airbnb hosts in Cherry Log based on the number of properties managed and estimated total revenue over the past year. Analyze their scale and performance metrics.
| Host Name | Properties | Grossing Revenue | Stay Reviews | Avg Rating |
|---|---|---|---|---|
| Southern Comfort | 24 | $1,134,032 | 262 | 4.66/5.0 |
| Escape To Blue Ridge | 7 | $320,090 | 29 | 4.91/5.0 |
| Bruce And Beatriz | 7 | $285,525 | 885 | 4.91/5.0 |
| Dave | 6 | $273,523 | 510 | 4.93/5.0 |
| Safiri | 5 | $255,291 | 211 | 4.93/5.0 |
| StandoutSTR | 2 | $232,203 | 74 | 5.00/5.0 |
| Susie | 2 | $230,742 | 58 | 5.00/5.0 |
| Blue Sky Cabin | 10 | $202,149 | 129 | 4.66/5.0 |
| Andrew | 7 | $188,390 | 23 | 5.00/5.0 |
| Tony | 1 | $182,880 | 84 | 4.86/5.0 |
Analyzing the strategies of top hosts, such as their property selection, pricing, and guest communication, can offer valuable lessons for optimizing your own Airbnb operations in Cherry Log.
Dive Deeper: Advanced Cherry Log STR Market Data (2026)
Ready to unlock more insights? AirROI provides access to advanced metrics and comprehensive Airbnb data for Cherry Log. Explore detailed analytics beyond this report to refine your investment strategy, optimize pricing, and maximize your vacation rental profits.
Explore Advanced MetricsCherry Log Short-Term Rental Market Composition (2026): Property & Room Types
Room Type Distribution
Property Type Distribution
Market Composition Insights for Cherry Log
- The Cherry Log Airbnb market composition is heavily skewed towards Entire Home/Apt listings, which make up 97.6% of the 248 active rentals. This indicates strong guest preference for privacy and space.
- Looking at the property type distribution in Cherry Log, Outdoor/Unique properties are the most common (90.3%), reflecting the local real estate landscape.
- Smaller segments like unique stays (combined 3.6%) offer potential for unique stay experiences.
Cherry Log Airbnb Room Capacity Analysis (2026): Bedroom Distribution
Distribution of Listings by Number of Bedrooms
Room Capacity Insights for Cherry Log
- The dominant room capacity in Cherry Log is 2 bedrooms listings, making up 34.7% of the market. This suggests a strong demand for properties suitable for couples or solo travelers.
- Together, 2 bedrooms and 3 bedrooms properties represent 69.0% of the active Airbnb listings in Cherry Log, indicating a high concentration in these sizes.
- A significant 54.4% of listings offer 3+ bedrooms, catering to larger groups and families seeking more space in Cherry Log.
Cherry Log Vacation Rental Guest Capacity Trends (2026)
Distribution of Listings by Guest Capacity
Guest Capacity Insights for Cherry Log
- The most common guest capacity trend in Cherry Log vacation rentals is listings accommodating 8+ guests (34.3%). This suggests the primary traveler segment is likely larger groups.
- Properties designed for 8+ guests and 6 guests dominate the Cherry Log STR market, accounting for 62.5% of listings.
- 65.3% of properties accommodate 6+ guests, serving the market segment for larger families or group travel in Cherry Log.
- On average, properties in Cherry Log are equipped to host 5.9 guests.
Cherry Log Airbnb Booking Patterns (2026): Available vs. Booked Days
Available Days Distribution
Booked Days Distribution
Booking Pattern Insights for Cherry Log
- The most common availability pattern in Cherry Log falls within the 181-270 days range, representing 40.3% of listings. This suggests many properties have significant open periods on their calendars.
- Approximately 76.2% of listings show high availability (181+ days open annually), indicating potential for increased bookings or specific owner usage patterns.
- For booked days, the 91-180 days range is most frequent in Cherry Log (41.9%), reflecting common guest stay durations or potential owner blocking patterns.
- A notable 24.6% of properties secure long booking periods (181+ days booked per year), highlighting successful long-term rental strategies or significant owner usage.
Cherry Log Airbnb Minimum Stay Requirements Analysis
Distribution of Listings by Minimum Night Requirement
1 Night
11 listings
4.4% of total
2 Nights
111 listings
44.8% of total
3 Nights
6 listings
2.4% of total
30+ Nights
120 listings
48.4% of total
Key Insights
- The most prevalent minimum stay requirement in Cherry Log is 30+ Nights, adopted by 48.4% of listings. This highlights the market's preference for longer commitments.
- A significant segment (48.4%) caters to monthly stays (30+ nights) in Cherry Log, pointing to opportunities in the extended-stay market.
Recommendations
- Align with the market by considering a 30+ Nights minimum stay, as 48.4% of Cherry Log hosts use this setting.
- If feasible, allowing 1-night stays, especially midweek or during low season, could capture last-minute bookings, as only 4.4% currently do.
- A 2-night minimum appears standard (44.8%). Consider this for weekends or peak periods.
- Explore offering discounts for stays of 30+ nights to attract the 48.4% of the market seeking extended stays.
- Adjust minimum nights based on seasonality – potentially shorter during low season and longer during peak demand periods in Cherry Log.
Cherry Log Airbnb Cancellation Policy Trends Analysis (2026)
Limited
7 listings
2.8% of total
Super Strict 30 Days
28 listings
11.3% of total
Super Strict 60 Days
5 listings
2% of total
Flexible
12 listings
4.8% of total
Moderate
53 listings
21.4% of total
Firm
99 listings
39.9% of total
Strict
44 listings
17.7% of total
Cancellation Policy Insights for Cherry Log
- The prevailing Airbnb cancellation policy trend in Cherry Log is Firm, used by 39.9% of listings.
- A majority (57.6%) of hosts in Cherry Log utilize Firm or Strict policies, indicating a market where hosts prioritize booking security.
Recommendations for Hosts
- Consider adopting a Firm policy to align with the 39.9% market standard in Cherry Log.
- Regularly review your cancellation policy against competitors and market demand shifts in Cherry Log.
Cherry Log STR Booking Lead Time Analysis (2026)
Average Booking Lead Time by Month
Booking Lead Time Insights for Cherry Log
- The overall average booking lead time for vacation rentals in Cherry Log is 44 days.
- Guests book furthest in advance for stays during November (average 67 days), likely coinciding with peak travel demand or local events.
- The shortest booking windows occur for stays in January (average 32 days), indicating more last-minute travel plans during this time.
- Seasonally, Fall (57 days avg.) sees the longest lead times, while Summer (35 days avg.) has the shortest, reflecting typical travel planning cycles.
Recommendations for Hosts
- Use the overall average lead time (44 days) as a baseline for your pricing and availability strategy in Cherry Log.
- For November stays, consider implementing length-of-stay discounts or slightly higher rates for bookings made less than 67 days out to capitalize on advance planning.
- Target marketing efforts for the Fall season well in advance (at least 57 days) to capture early planners.
- Monitor your own booking lead times against these Cherry Log averages to identify opportunities for dynamic pricing adjustments.
Popular & Essential Airbnb Amenities in Cherry Log (2026)
Amenity Prevalence
Amenity Insights for Cherry Log
- Essential amenities in Cherry Log that guests expect include: Wifi, Air conditioning, Smoke alarm, Kitchen, Refrigerator, Heating, Microwave, Free parking on premises, Dishes and silverware, Coffee maker. Lacking these (any) could significantly impact bookings.
Recommendations for Hosts
- Ensure your listing includes all essential amenities for Cherry Log: Wifi, Air conditioning, Smoke alarm, Kitchen, Refrigerator, Heating, Microwave, Free parking on premises, Dishes and silverware, Coffee maker.
- Prioritize adding missing essentials: Smoke alarm, Kitchen, Refrigerator, Heating, Microwave, Free parking on premises, Dishes and silverware, Coffee maker.
- Highlight unique or less common amenities you offer (e.g., hot tub, dedicated workspace, EV charger) in your listing description and photos.
- Regularly check competitor amenities in Cherry Log to stay competitive.
Cherry Log Airbnb Guest Demographics & Profile Analysis (2026)
Guest Profile Summary for Cherry Log
- The typical guest profile for Airbnb in Cherry Log consists of primarily domestic travelers (99%), often arriving from nearby Atlanta, typically belonging to the Post-2000s (Gen Z/Alpha) group (50%), primarily speaking English or Spanish.
- Domestic travelers account for 98.5% of guests.
- Key international markets include United States (98.5%) and Canada (0.3%).
- Top languages spoken are English (76.6%) followed by Spanish (11.3%).
- A significant demographic segment is the Post-2000s (Gen Z/Alpha) group, representing 50% of guests.
Recommendations for Hosts
- Target domestic marketing efforts towards travelers from Atlanta and Orlando.
- Tailor amenities and listing descriptions to appeal to the dominant Post-2000s (Gen Z/Alpha) demographic (e.g., highlight fast WiFi, smart home features, local guides).
- Highlight unique local experiences or amenities relevant to the primary guest profile.
- Consider seasonal promotions aligned with peak travel times for key origin markets.
Nearby Short-Term Rental Market Comparison
How does the Cherry Log Airbnb market stack up against its neighbors? Compare key performance metrics like average monthly revenue, ADR, and occupancy rates in surrounding areas to understand the broader regional STR landscape.
| Market | Active Properties | Monthly Revenue | Daily Rate | Avg. Occupancy |
|---|---|---|---|---|
| Sevier County | 68 | $7,108 | $567.95 | 44% |
| Bogart | 13 | $5,528 | $637.81 | 35% |
| Gilmer County | 26 | $5,298 | $459.59 | 40% |
| Sevierville | 6,269 | $4,747 | $370.20 | 46% |
| Fannin County | 42 | $4,574 | $435.93 | 38% |
| East Ellijay | 15 | $4,415 | $368.05 | 41% |
| Epworth | 79 | $4,411 | $406.97 | 40% |
| Gatlinburg | 3,565 | $4,385 | $353.70 | 45% |
| Commerce | 19 | $4,298 | $285.34 | 45% |
| Eatonton | 236 | $4,178 | $502.80 | 33% |