Blairsville Airbnb Market Analysis 2026: Short Term Rental Data & Vacation Rental Statistics in Georgia, United States
Is Airbnb profitable in Blairsville in 2026? Explore comprehensive Airbnb analytics for Blairsville, Georgia, United States to uncover income potential. This 2026 STR market report for Blairsville, based on AirROI data from February 2025 to January 2026, reveals key trends in the market of 280 active listings.
Whether you're considering an Airbnb investment in Blairsville, optimizing your existing vacation rental, or exploring rental arbitrage opportunities, understanding the Blairsville Airbnb data is crucial. Leveraging the low regulation environment is key to maximizing your short term rental income potential. Let's dive into the specifics.
Key Blairsville Airbnb Performance Metrics Overview
Monthly Airbnb Revenue Variations & Income Potential in Blairsville (2026)
Understanding the monthly revenue variations for Airbnb listings in Blairsville is key to maximizing your short term rental income potential. Seasonality significantly impacts earnings. Our analysis, based on data from the past 12 months, shows that the peak revenue month for STRs in Blairsville is typically October, while February often presents the lowest earnings, highlighting opportunities for strategic pricing adjustments during shoulder and low seasons. Explore the typical Airbnb income in Blairsville across different performance tiers:
- Best-in-class properties (Top 10%) achieve $5,988+ monthly, often utilizing dynamic pricing and superior guest experiences.
- Strong performing properties (Top 25%) earn $3,881 or more, indicating effective management and desirable locations/amenities.
- Typical properties (Median) generate around $2,305 per month, representing the average market performance.
- Entry-level properties (Bottom 25%) see earnings around $1,246, often with potential for optimization.
Average Monthly Airbnb Earnings Trend in Blairsville
Blairsville Airbnb Occupancy Rate Trends (2026)
Maximize your bookings by understanding the Blairsville STR occupancy trends. Seasonal demand shifts significantly influence how often properties are booked. Typically, Octobersees the highest demand (peak season occupancy), while January experiences the lowest (low season). Effective strategies, like adjusting minimum stays or offering promotions, can boost occupancy during slower periods. Here's how different property tiers perform in Blairsville:
- Best-in-class properties (Top 10%) achieve 76%+ occupancy, indicating high desirability and potentially optimized availability.
- Strong performing properties (Top 25%) maintain 61% or higher occupancy, suggesting good market fit and guest satisfaction.
- Typical properties (Median) have an occupancy rate around 38%.
- Entry-level properties (Bottom 25%) average 20% occupancy, potentially facing higher vacancy.
Average Monthly Occupancy Rate Trend in Blairsville
Average Daily Rate (ADR) Airbnb Trends in Blairsville (2026)
Effective short term rental pricing strategy in Blairsville involves understanding monthly ADR fluctuations. The Average Daily Rate (ADR) for Airbnb in Blairsville typically peaks in December and dips lowest during February. Leveraging Airbnb dynamic pricing tools or strategies based on this seasonality can significantly boost revenue. Here's a look at the typical nightly rates achieved:
- Best-in-class properties (Top 10%) command rates of $415+ per night, often due to premium features or locations.
- Strong performing properties (Top 25%) achieve nightly rates of $270 or more.
- Typical properties (Median) charge around $190 per night.
- Entry-level properties (Bottom 25%) earn around $151 per night.
Average Daily Rate (ADR) Trend by Month in Blairsville
Get Live Blairsville Market Intelligence 👇

Explore Real-time Analytics
Airbnb Seasonality Analysis & Trends in Blairsville (2026)
Peak Season (October, July, June)
- Revenue averages $4,056 per month
- Occupancy rates average 48.6%
- Daily rates average $254
Shoulder Season
- Revenue averages $3,054 per month
- Occupancy maintains around 41.0%
- Daily rates hold near $246
Low Season (January, February, April)
- Revenue drops to average $1,966 per month
- Occupancy decreases to average 32.3%
- Daily rates adjust to average $229
Seasonality Insights for Blairsville
- The Airbnb seasonality in Blairsville shows highly seasonal trends requiring careful strategy. While the sections above show seasonal averages, it's also insightful to look at the extremes:
- During the high season, the absolute peak month showcases Blairsville's highest earning potential, with monthly revenues capable of climbing to $4,376, occupancy reaching a high of 53.8%, and ADRs peaking at $277.
- Conversely, the slowest single month of the year, typically falling within the low season, marks the market's lowest point. In this month, revenue might dip to $1,818, occupancy could drop to 25.8%, and ADRs may adjust down to $213.
- Understanding both the seasonal averages and these monthly peaks and troughs in revenue, occupancy, and ADR is crucial for maximizing your Airbnb profit potential in Blairsville.
Seasonal Strategies for Maximizing Profit
- Peak Season: Maximize revenue through premium pricing and potentially longer minimum stays. Ensure high availability.
- Low Season: Offer competitive pricing, special promotions (e.g., extended stay discounts), and flexible cancellation policies. Target off-season travelers like remote workers or budget-conscious guests.
- Shoulder Seasons: Implement dynamic pricing that balances peak and low rates. Target weekend travelers or specific events. Offer slightly more flexible terms than peak season.
- Regularly analyze your own performance against these Blairsville seasonality benchmarks and adjust your pricing and availability strategy accordingly.
Best Areas for Airbnb Investment in Blairsville (2026)
Exploring the top neighborhoods for short-term rentals in Blairsville? This section highlights key areas, outlining why they are attractive for hosts and guests, along with notable local attractions. Consider these locations based on your target guest profile and investment strategy.
| Neighborhood / Area | Why Host Here? (Target Guests & Appeal) | Key Attractions & Landmarks |
|---|---|---|
| Lake Nottely | Popular for its scenic views, fishing, and boating opportunities. Ideal for families and outdoor enthusiasts looking to rent lakeside properties for both relaxation and adventure. | Lake Nottely Dam, Nottely River, Fishing and Boating, Camping Areas, Hiking Trails |
| Blairsville Downtown | The charming downtown area offers unique shops, restaurants, and local events. Attracts visitors for its small-town feel and community atmosphere, making it great for hosts. | Memorial Park, Historic Courthouse, Local Art Galleries, Shopping District, Events and Festivals |
| Union County | Nestled in the mountains, this area is perfect for those seeking adventure, with plenty of hiking, camping, and outdoor activities. Great for nature lovers and adventure seekers. | Brasstown Bald, Chattahoochee National Forest, Hiking Trails, Waterfalls, Camping Sites |
| Trackrock | Known for its outdoor activities and proximity to historical sites. It appeals to guests seeking peace and tranquility in nature while being close to attractions. | Trackrock Gap Petroglyphs, Waterfalls, Hiking and Biking Trails, Scenic Views, Local Flora and Fauna |
| Wolf Creek | A serene area known for its beautiful landscapes and golf courses, perfect for those looking to relax and enjoy nature while being able to access local amenities. | Wolf Creek Falls, Golf Courses, Picnic Areas, Outdoor Recreation, Scenic Drive |
| Blue Ridge Mountains | Attracts those wanting mountain retreats, offering breathtaking views and outdoor activities year-round. Very popular for vacation rentals. | Hiking Trails, Scenic Overlooks, Outdoor Sports, Camping Opportunities, Fishing |
| Lake Blue Ridge | Renowned for its stunning lake views, making it a perfect getaway for families and outdoor enthusiasts alike. The area offers plenty of water activities. | Lake Blue Ridge Dam, Boating, Swimming and Fishing, Picnic Areas, Hiking Trails |
| Aska Adventure Area | A prime location for adventure seekers, this area offers a mix of outdoor activities including hiking, biking, and river rafting, making it a great destination for adventurous travelers. | Aska Trails, Toccoa River, Biking Trails, Outdoor Activities, Scenic Views |
Understanding Airbnb License Requirements & STR Laws in Blairsville (2026)
While Blairsville, Georgia, United States currently shows low STR regulations, specific Airbnb license requirements might still exist or change. Always verify the latest short term rental regulations and Airbnb license requirements directly with local government authorities for Blairsville to ensure full compliance before hosting.
(Source: AirROI data, 2026, based on 1% licensed listings)
Top Performing Airbnb Properties in Blairsville (2026)
Benchmark your potential! Explore examples of top-performing Airbnb properties in Blairsvillebased on Trailing Twelve Month (TTM) revenue. Analyze their characteristics, revenue, occupancy rate, and ADR to understand what drives success in this market.
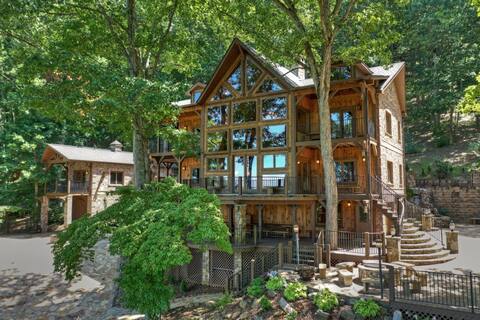
Stunning views! Luxury Mountain Lodge
Entire Place • 9 bedrooms
Sugarboo Farms: Sleeps 47 – Pool – HotTub – Events
Entire Place • 17 bedrooms
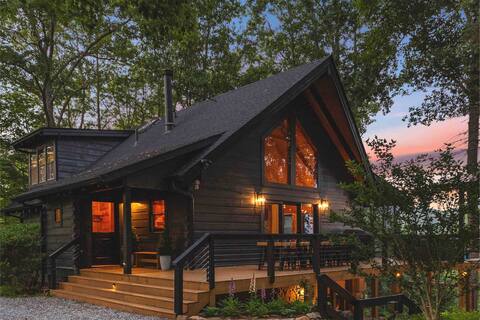
Stunning Views Blue Ridge Mountain Cabin! Hot Tub
Entire Place • 4 bedrooms

Private Sunset-view Cabin • Sauna • HotTub • Games
Entire Place • 4 bedrooms

Lake Cottage Kayak/Firepit/Dock/Pool Table/hot tub
Entire Place • 3 bedrooms
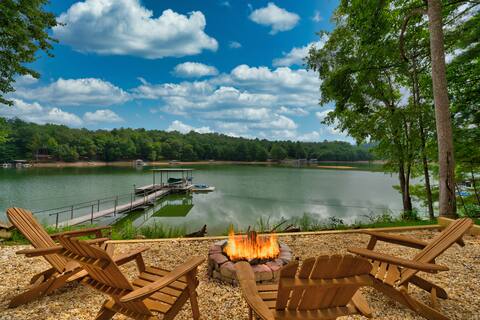
7 Bedroom! Amazing Lake, Deep water-Private Dock
Entire Place • 7 bedrooms
Note: Performance varies based on location, size, amenities, seasonality, and management quality. Data reflects the past 12 months.
Top Performing Airbnb Hosts in Blairsville (2026)
Learn from the best! This table showcases top-performing Airbnb hosts in Blairsville based on the number of properties managed and estimated total revenue over the past year. Analyze their scale and performance metrics.
| Host Name | Properties | Grossing Revenue | Stay Reviews | Avg Rating |
|---|---|---|---|---|
| Joni | 14 | $549,254 | 634 | 4.85/5.0 |
| Evolve | 12 | $383,837 | 551 | 4.87/5.0 |
| Cornel And Kristina | 2 | $281,360 | 112 | 4.99/5.0 |
| Escape To Blue Ridge | 4 | $247,507 | 19 | 4.81/5.0 |
| Richard Gerald | 1 | $245,681 | 4 | 5.00/5.0 |
| PMI North GA Mountains | 6 | $245,319 | 177 | 4.93/5.0 |
| Scott And Riann | 2 | $230,231 | 133 | 5.00/5.0 |
| Bruce And Beatriz | 8 | $210,429 | 886 | 4.86/5.0 |
| Little Bear | 9 | $136,113 | 126 | 4.84/5.0 |
| Oasis Lodgings | 3 | $126,693 | 164 | 4.74/5.0 |
Analyzing the strategies of top hosts, such as their property selection, pricing, and guest communication, can offer valuable lessons for optimizing your own Airbnb operations in Blairsville.
Dive Deeper: Advanced Blairsville STR Market Data (2026)
Ready to unlock more insights? AirROI provides access to advanced metrics and comprehensive Airbnb data for Blairsville. Explore detailed analytics beyond this report to refine your investment strategy, optimize pricing, and maximize your vacation rental profits.
Explore Advanced MetricsBlairsville Short-Term Rental Market Composition (2026): Property & Room Types
Room Type Distribution
Property Type Distribution
Market Composition Insights for Blairsville
- The Blairsville Airbnb market composition is heavily skewed towards Entire Home/Apt listings, which make up 99.3% of the 280 active rentals. This indicates strong guest preference for privacy and space.
- Looking at the property type distribution in Blairsville, Outdoor/Unique properties are the most common (65.4%), reflecting the local real estate landscape.
- Houses represent a significant 29.3% portion, catering likely to families or larger groups.
- Smaller segments like apartment/condo, others, hotel/boutique (combined 5.4%) offer potential for unique stay experiences.
Blairsville Airbnb Room Capacity Analysis (2026): Bedroom Distribution
Distribution of Listings by Number of Bedrooms
Room Capacity Insights for Blairsville
- The dominant room capacity in Blairsville is 2 bedrooms listings, making up 33.2% of the market. This suggests a strong demand for properties suitable for couples or solo travelers.
- Together, 2 bedrooms and 3 bedrooms properties represent 61.1% of the active Airbnb listings in Blairsville, indicating a high concentration in these sizes.
- A significant 47.2% of listings offer 3+ bedrooms, catering to larger groups and families seeking more space in Blairsville.
Blairsville Vacation Rental Guest Capacity Trends (2026)
Distribution of Listings by Guest Capacity
Guest Capacity Insights for Blairsville
- The most common guest capacity trend in Blairsville vacation rentals is listings accommodating 6 guests (31.8%). This suggests the primary traveler segment is likely larger groups.
- Properties designed for 6 guests and 4 guests dominate the Blairsville STR market, accounting for 57.9% of listings.
- 57.8% of properties accommodate 6+ guests, serving the market segment for larger families or group travel in Blairsville.
- On average, properties in Blairsville are equipped to host 5.5 guests.
Blairsville Airbnb Booking Patterns (2026): Available vs. Booked Days
Available Days Distribution
Booked Days Distribution
Booking Pattern Insights for Blairsville
- The most common availability pattern in Blairsville falls within the 271-366 days range, representing 46.4% of listings. This suggests many properties have significant open periods on their calendars.
- Approximately 76.8% of listings show high availability (181+ days open annually), indicating potential for increased bookings or specific owner usage patterns.
- For booked days, the 91-180 days range is most frequent in Blairsville (29.6%), reflecting common guest stay durations or potential owner blocking patterns.
- A notable 24.3% of properties secure long booking periods (181+ days booked per year), highlighting successful long-term rental strategies or significant owner usage.
Blairsville Airbnb Minimum Stay Requirements Analysis
Distribution of Listings by Minimum Night Requirement
1 Night
28 listings
10% of total
2 Nights
132 listings
47.1% of total
3 Nights
20 listings
7.1% of total
4-6 Nights
1 listings
0.4% of total
7-29 Nights
2 listings
0.7% of total
30+ Nights
97 listings
34.6% of total
Key Insights
- The most prevalent minimum stay requirement in Blairsville is 2 Nights, adopted by 47.1% of listings. This highlights the market's preference for shorter, flexible bookings.
- A significant segment (34.6%) caters to monthly stays (30+ nights) in Blairsville, pointing to opportunities in the extended-stay market.
Recommendations
- Align with the market by considering a 2 Nights minimum stay, as 47.1% of Blairsville hosts use this setting.
- If feasible, allowing 1-night stays, especially midweek or during low season, could capture last-minute bookings, as only 10% currently do.
- A 2-night minimum appears standard (47.1%). Consider this for weekends or peak periods.
- Explore offering discounts for stays of 30+ nights to attract the 34.6% of the market seeking extended stays.
- Adjust minimum nights based on seasonality – potentially shorter during low season and longer during peak demand periods in Blairsville.
Blairsville Airbnb Cancellation Policy Trends Analysis (2026)
Limited
2 listings
0.7% of total
Super Strict 30 Days
12 listings
4.3% of total
Flexible
34 listings
12.1% of total
Moderate
85 listings
30.4% of total
Firm
115 listings
41.1% of total
Strict
32 listings
11.4% of total
Cancellation Policy Insights for Blairsville
- The prevailing Airbnb cancellation policy trend in Blairsville is Firm, used by 41.1% of listings.
- A majority (52.5%) of hosts in Blairsville utilize Firm or Strict policies, indicating a market where hosts prioritize booking security.
Recommendations for Hosts
- Consider adopting a Firm policy to align with the 41.1% market standard in Blairsville.
- Using a Strict policy might deter some guests, as only 11.4% of listings use it. Evaluate if potential revenue protection outweighs possible lower booking rates.
- Regularly review your cancellation policy against competitors and market demand shifts in Blairsville.
Blairsville STR Booking Lead Time Analysis (2026)
Average Booking Lead Time by Month
Booking Lead Time Insights for Blairsville
- The overall average booking lead time for vacation rentals in Blairsville is 50 days.
- Guests book furthest in advance for stays during November (average 66 days), likely coinciding with peak travel demand or local events.
- The shortest booking windows occur for stays in February (average 30 days), indicating more last-minute travel plans during this time.
- Seasonally, Fall (59 days avg.) sees the longest lead times, while Winter (37 days avg.) has the shortest, reflecting typical travel planning cycles.
Recommendations for Hosts
- Use the overall average lead time (50 days) as a baseline for your pricing and availability strategy in Blairsville.
- For November stays, consider implementing length-of-stay discounts or slightly higher rates for bookings made less than 66 days out to capitalize on advance planning.
- Target marketing efforts for the Fall season well in advance (at least 59 days) to capture early planners.
- Monitor your own booking lead times against these Blairsville averages to identify opportunities for dynamic pricing adjustments.
Popular & Essential Airbnb Amenities in Blairsville (2026)
Amenity Prevalence
Amenity Insights for Blairsville
- Essential amenities in Blairsville that guests expect include: Air conditioning, Free parking on premises, TV, Smoke alarm, Heating, Wifi, Kitchen, Dishes and silverware, Coffee maker, Refrigerator. Lacking these (any) could significantly impact bookings.
Recommendations for Hosts
- Ensure your listing includes all essential amenities for Blairsville: Air conditioning, Free parking on premises, TV, Smoke alarm, Heating, Wifi, Kitchen, Dishes and silverware, Coffee maker, Refrigerator.
- Prioritize adding missing essentials: Air conditioning, Free parking on premises, TV, Smoke alarm, Heating, Wifi, Kitchen, Dishes and silverware, Coffee maker, Refrigerator.
- Highlight unique or less common amenities you offer (e.g., hot tub, dedicated workspace, EV charger) in your listing description and photos.
- Regularly check competitor amenities in Blairsville to stay competitive.
Blairsville Airbnb Guest Demographics & Profile Analysis (2026)
Guest Profile Summary for Blairsville
- The typical guest profile for Airbnb in Blairsville consists of primarily domestic travelers (99%), often arriving from nearby Atlanta, typically belonging to the Post-2000s (Gen Z/Alpha) group (50%), primarily speaking English or Spanish.
- Domestic travelers account for 98.6% of guests.
- Key international markets include United States (98.6%) and DC (0.3%).
- Top languages spoken are English (76.5%) followed by Spanish (11.7%).
- A significant demographic segment is the Post-2000s (Gen Z/Alpha) group, representing 50% of guests.
Recommendations for Hosts
- Target domestic marketing efforts towards travelers from Atlanta and Orlando.
- Tailor amenities and listing descriptions to appeal to the dominant Post-2000s (Gen Z/Alpha) demographic (e.g., highlight fast WiFi, smart home features, local guides).
- Highlight unique local experiences or amenities relevant to the primary guest profile.
- Consider seasonal promotions aligned with peak travel times for key origin markets.
Nearby Short-Term Rental Market Comparison
How does the Blairsville Airbnb market stack up against its neighbors? Compare key performance metrics like average monthly revenue, ADR, and occupancy rates in surrounding areas to understand the broader regional STR landscape.
| Market | Active Properties | Monthly Revenue | Daily Rate | Avg. Occupancy |
|---|---|---|---|---|
| Sevier County | 68 | $7,108 | $567.95 | 44% |
| Bogart | 13 | $5,528 | $637.81 | 35% |
| Gilmer County | 26 | $5,298 | $459.59 | 40% |
| Union Mills | 15 | $4,938 | $442.76 | 41% |
| Sevierville | 6,269 | $4,747 | $370.20 | 46% |
| Fannin County | 42 | $4,574 | $435.93 | 38% |
| East Ellijay | 15 | $4,415 | $368.05 | 41% |
| Epworth | 79 | $4,411 | $406.97 | 40% |
| Six Mile | 57 | $4,396 | $449.78 | 42% |
| Gatlinburg | 3,565 | $4,385 | $353.70 | 45% |